

Abstract
Background
Fusarium head blight (FHB), a devastating disease in wheat worldwide, results in yield loses and mycotoxin, such as deoxynivalenol (DON), accumulation in infected grains. DON also facilitates the pathogen colonization and spread of FHB symptoms during disease development. UDP-glycosyltransferase enzymes (UGTs) are known to contribute to detoxification and enhance FHB resistance by glycosylating DON into DON-3-glucoside (D3G) in wheat. However, a comprehensive investigation of wheat (Triticum aestivum) UGT genes is still lacking.
Results
In this study, we carried out a genome-wide analysis of family-1 UDP glycosyltransferases in wheat based on the PSPG conserved box that resulted in the identification of 179 putative UGT genes. The identified genes were clustered into 16 major phylogenetic groups with a lack of phylogenetic group K. The UGT genes were invariably distributed among all the chromosomes of the 3 genomes. At least 10 intron insertion events were found in the UGT sequences, where intron 4 was observed as the most conserved intron. The expression analysis of the wheat UGT genes using both online microarray data and quantitative real-time PCR verification suggested the distinct role of UGT genes in different tissues and developmental stages. The expression of many UGT genes was up-regulated after Fusarium graminearum inoculation, and six of the genes were further verified by RT-qPCR.
Conclusion
We identified 179 UGT genes from wheat using the available sequenced wheat genome. This study provides useful insight into the phylogenetic structure, distribution, and expression patterns of family-1 UDP glycosyltransferases in wheat. The results also offer a foundation for future work aimed at elucidating the molecular mechanisms underlying the resistance to FHB and DON accumulation.
Electronic supplementary material
The online version of this article (10.1186/s12870-018-1286-5) contains supplementary material, which is available to authorized users.
Keywords: UDP-glycosyltransferase, Fusarium head blight, Wheat, Expression pattern, Phylogeny, Deoxynivalenol
Background
Fusarium head blight (FHB) or scab, primarily caused by Fusarium graminearum, is one of the most devastating diseases in wheat and barley worldwide [1]. FHB infection not only results in heavy yield loss but also deteriorates grain quality due to the production of trichothecene mycotoxins such as deoxynivalenol (DON), nivalenol (NIV) and their acetylated forms 3 (or 15)-acetyl-4-deoxynivalenol, 4-acetylnivalenol or fusarenone X (FX), of which DON is one of the most important members [2]. The accumulation of DON and other toxins in the infected grains is making wheat unfit for human and livestock consumption posing a risk to world food security [3]. DON along with other trichothecenes also act as fungal virulence factors, facilitating the colonization and spread of scab symptoms within wheat spikes [2]. When the TRI5 gene was disrupted, the DON-nonproducing mutants of F. graminearum lacked the ability to spread in wheat spikes [4]. The resistance to DON accumulation is different in FHB infected wheat varieties, highlighting the involvement of a host resistance system during the course of DON production [1]. DON-3-glucoside (D3G), a non-toxic masked form of DON, has been observed in wheat grains in addition to DON and is stored in plant cell vacuoles [5]. Using their enzymatic defense system, plants convert DON into D3G as previously described for the first time in Arabidopsis [6]. The resistance to FHB infection and D3G accumulation in wheat grains is correlated with the ability of a higher conversion of DON into D3G [7]. DON conversion into D3G, a natural detoxification process in plants called glycosylation, along with other mechanisms of detoxification such as acetylation and de-epoxidation, reduce mycotoxin accumulation and are potential resistance factors against FHB [2, 5, 8].
Glycosylation is a widespread cellular modification reaction in all living organisms, attaching a carbohydrate to the hydroxyl or other functional group of a molecule in a biosynthetic pathway [9]. Glycosylation is a form of co-translational and post-translational modification altering the chemical property, sub-cellular location and activity of a variety of bio-molecules [10]. Glycosylation modifications are catalyzed by glycosyltransferase enzymes (GTs), which are highly divergent, polyphyletic and belong to a multigene family [11]. Glycosylation, in addition to other reactions, paves the way to the production of a huge variety of secondary metabolites in plants. GTs from different species can be classified into 94 families based on their amino acid sequence similarities, catalytic mechanisms as well as the presence of conserved sequence motifs according to the most recent update of CAZy (http://www.cazy.org/GlycosylTransferases.html). Among them, family-1 GTs are the most common glycosyltransferases in the plant kingdom generally catalyzing the process of glycosylation by transferring sugar moieties from activated donor molecules to acceptor molecules [5, 12, 13]. Family-1 GTs use uridine 5′-diphosphate sugars as the donor molecule; hence, they are also named uridine-diphosphate glycosyltransferases (UGTs) [14]. These enzymes act upon a huge variety of highly diverse and complex substrates in the plant kingdom such as flavonoids, terpenes, auxin, cytokinin, salicylic acid and many others to regulate plant growth, development, disease resistance and interaction with the environment [15]. The sequences at N-terminal region of these enzymes are highly diverse and are considered to be responsible for recognition of a variety of substrates. The C-terminal region on the other hand contains a conserved motif called Plant Secondary Product Glycosyltransferase (PSPG). The PSPG box is a unique, well conserved region of 44 amino acids found in all UGTs across all studied plant taxa [14, 16].
UDP-glycosyltransferases have been identified in various plant species, including Linum usitatissimum, Arabidopsis thaliana, Malus domestica, Vitis vinifera, Populus trichocarpa, Glycine max, Mimulus guttatus, Oryza sativa, Sorghum bicolor, Brachypodium distachyon, Zea mays, Gossypium raimondii, Gossypium arboreum, Gossypium hirsutum and most recently in Prunus persica, Brassica rapa, and Brassica oleracea with approximately more than 100 UGTs in all the higher plants investigated [15, 17–22]. UGTs have been shown to display broad as well as selective substrate specificity in plants recognizing a wide range of acceptor molecules [23, 24]. The UGTs not only glycosylate acceptor molecules, such as anthocyanidins, flavonols, flavonoids, saponins, sterols terpenoids, phenylpropanoids and plant hormones, but also detoxify and deactivate xenobiotics and play a pivotal role in plant-pathogen interactions [9, 21].
Functioning of UGTs has been described in many plants such as Arabidopsis, kiwifruit and strawberry [25–28]. Besides their various other attributes, UGT genes have also been demonstrated to contribute to FHB resistance in crops possibly through DON glycosylation [5]. Four highly DON inducible candidate GTs were identified in barley and one of them HvUGT13248 gene, the first monocot DON-glucosyltransferase, extended DON resistance in yeast and has since been expressed in Arabidopsis and wheat providing resistance against DON and other mycotoxins [29–33]. Similarly, two DON detoxification genes conjugating DON to D3G have been identified in Brachypodium distachyon [19]. Recently the HvUGT-10 W1 gene isolated from an FHB resistant barley variety (10 W1) also conferred FHB tolerance [34]. In wheat only a few candidate UGT genes such as TaUGTB2, TaUGT1, TaUGT2, TaUGT3, TaUGT4, and TaUGT12887 have been identified and the later 4 genes have been shown to be closely related to FHB resistance; however, a large scale systematic investigation of UGTs in the wheat genome is still lacking [35–39].
In this study we identified 179 UGT genes from wheat using the available sequenced wheat genome. The genetic relationships of these UGTs were determined using sequence alignment and phylogenetic tree analysis. The differential expression of genes in various wheat tissues as well as wheat spikes treated with F. graminearum vs control expressions patterns were analyzed using NCBI and universal microarray data and further confirmed through RT-qPCR analysis of the selected genes. This study will hopefully provide a baseline to conduct future functional characterization analysis of wheat UGT genes in order to understand the molecular mechanisms behind substrate specificity in general and especially the resistance to FHB and DON accumulation in crops.
Methods
Identification of UGT genes in wheat
The 44-amino acid conserved sequence of the PSPG motif was used as a query to search against the wheat genome database (TGACv1) at the Ensemble Plants (http://plants.ensembl.org/Triticum_aestivum/) by HMMER profile to identify members of the UGT protein family in wheat [9, 40]. The identified protein sequences of each UGT were further verified through the PFAM (http://pfam.xfam.org/) and the SMART (http://smart.embl-heidelberg.de/) databases to confirm the presence of the UDP-glycosyltransferase domain. The information (including amino acid length, transcript count and location) was also obtained from Ensemble Plants. The molecular weight (MW) and isoelectric point (PI) of each UGT protein were calculated using the online ExPASy program (http://web.expasy.org/compute_pi/) [41]. The subcellular localization of each UGT protein was predicted using the online CELLO v2.5 system (http://cello.life.nctu.edu.tw/cello.html) [42].
Sequence alignment and phylogenetic analysis
Multiple sequence alignments of the wheat UGT protein sequences were performed by MUSCLE (http://www.ebi.ac.uk/Tools/msa/muscle/). The phylogenetic tree was constructed using MEGA 7.0 software (http://www.megasoftware.net/) based on the full-length UGT protein sequences through a neighbor-joining algorithm using a 1000 bootstrap value [43].
Chromosomal locations
The genetic location of each UGT on the chromosomes was retrieved from the final TGACv1 map [40]. The genetic map of each UGT on the chromosome was modified from the primary map drawn by the MapInspect tool (http://mapinspect.software.informer.com/).
Intron mapping
The wheat UGT intron map was constructed by determining the intron positions, splice sites and phases. The intron phases were determined as described previously: the introns positioned between two triplet codons were defined as phase 0, introns positioned after the first base in the codon were defined as phase 1, and the introns positioned after the second base in the codon were defined as phase 2 [20].
Expression profile analysis
A genome-wide expression analysis of the wheat UGT genes in various organs and developmental stages was performed using high-throughput RNA sequence data from 5 organs (root, stem, leaf, spike and grain), each with 3 developmental stages (https://urgi.versailles.inra.fr/files/RNASeqWheat/) [44]. To analyze the expression profiles of the wheat UGT genes after F. graminearum inoculation, the Affymetrix wheat array data with wheat spikelets from the susceptible spring wheat cultivar Roblin inoculated with either water or F. graminearum strains that do or do not produce DON were downloaded (https://www.ncbi.nlm.nih.gov/geo/) for further analysis (accession number GSE54554). The expression profiles of these UGT genes were generated by using MeV 4.7 software (https://sourceforge.net/projects/mev-tm4/files/mev-tm4/).
Plant materials and treatment
The wheat cultivar used in this study was Annong 8455, which is highly susceptible to FHB in China. The wheat plants were grown in a green house at 22 °C for 14-h light and 12 °C for 10-h dark at the Jiangsu Academy of Agricultural Sciences, China.
The early anthesis stage spikelets were chosen for further F. graminearum or water (CK) inoculation as described previously [45]. Approximately 10 μl of fungal suspension (1 × 10⁶ conidia per mL) of F. graminearum or water was injected into the central spikelet of a spike during early anthesis. The inoculated spikes were covered with a plastic bag for 3 days.
RNA isolation and RT-qPCR analysis
To validate the expression pattern of the six selected genes, the total RNA was isolated from the root, stem, leaf, pre-emergence spikelet, pre-anthesis spikelet, and grains of 7, 14 and 21 days after flowering (DAF) using the Promega SV total RNA isolation system (Promega, United States), according to the manufacturer’s instructions. The RNA of the spikelets treated with water or F. graminearum after 2 and 4 days was also extracted in the same way. The first-strand cDNAs were synthesized from the total RNA by using the PrimeScript 1st strand cDNA Synthesis Kit (Takara Bio, Dalian, China), according to the manufacturer’s manual. Real-time PCR was performed with a Roche thermal cycler 96 using SYBR Green to detect gene expression. The wheat tubulin gene was used as an endogenous control. The gene specific primers used for RT-qPCR are listed in the Additional file 1: Table S1. The PCR conditions were as follows: 95 °C for 30 s, 95 °C for 5 s, 60 °C for 20 s and 72 °C for 10 s for 45 cycles. Data from the individual runs were collated using the 2−ΔΔCT method [46]. All the reactions were performed using at least three replicates.
Results
Identification of UGT genes in wheat
A nearly complete and accurate sequence assembly of the allohexaploid wheat reference accession, Chinese Spring (CS42), was released recently, enabling a more in-depth analysis of UGT genes in this key global crop [40]. The conserved UGT domain of 44 amino acids called the PSPG box was used in this study to identify the presence of UGT genes in the wheat genome [9]. A total of 179 putative UGT genes having an average length of 471 amino acids were identified and used for further analysis (Table 1). Most of the genes were in the range of 400 to 500 amino acids, while only a few genes were above 500 and below 300 amino acids in size and 1 to 3 transcripts were counted for these genes (Additional file 2: Figure S1). The theoretical isoelectric point (pI) and molecular weight (Mw) ranged from 4.77 to 10.32 (average pI = 5.79) and from 26.9 kDa to 76.5 kDa (average Mw = 50.9 kDa), respectively (Table 1). The theoretical cellular localization showed 22, 19, 5, 2 and 0.6% of the genes were localized only into the chloroplast, cytoplasm, plasma membrane, mitochondria and nucleus, respectively, while the rest of the genes were localized into any of these compartments (Table 1).
Table 1.
The list of the putative wheat UGT genes identified in this study
| No. | Gene stable ID | Amino acid length | Transcript count | PI | MW (kDa) | Subcellular location | Location |
|---|---|---|---|---|---|---|---|
| 1 | TRIAE_CS42_1AL_TGACv1_000152_AA0004850 | 569 | 2 | 5.6 | 62.3 | Chloroplast Cytoplasmic | TGACv1_000152_1AL: 34,636–36,800 |
| 2 | TRIAE_CS42_1AL_TGACv1_000696_AA0017290 | 479 | 1 | 5.7 | 52.2 | Cytoplasmic | TGACv1_000696_1AL: 81,630–83,635 |
| 3 | TRIAE_CS42_1AL_TGACv1_001147_AA0025960 | 456 | 1 | 5.3 | 49.3 | Chloroplast Cytoplasmic PlasmaMembrane | TGACv1_001147_1AL: 8789–10,755 |
| 4 | TRIAE_CS42_1AL_TGACv1_001208_AA0027000 | 474 | 1 | 6 | 50.6 | Mitochondrial PlasmaMembrane | TGACv1_001208_1AL: 53,142–54,992 |
| 5 | TRIAE_CS42_1AL_TGACv1_001652_AA0033630 | 324 | 1 | 6.2 | 35 | PlasmaMembrane | TGACv1_001652_1AL: 54,716–56,210 |
| 6 | TRIAE_CS42_1AS_TGACv1_020318_AA0076580 | 505 | 3 | 5.3 | 55.2 | Cytoplasmic Mitochondrial | TGACv1_020318_1AS: 8106–11,995 |
| 7 | TRIAE_CS42_1BL_TGACv1_031128_AA0108300 | 464 | 1 | 5.4 | 49.6 | PlasmaMembrane | TGACv1_031128_1BL: 73,386–75,090 |
| 8 | TRIAE_CS42_1BL_TGACv1_032253_AA0127550 | 504 | 1 | 6 | 54.1 | Chloroplast Cytoplasmic | TGACv1_032253_1BL: 30,766–32,648 |
| 9 | TRIAE_CS42_1BL_TGACv1_032609_AA0132000 | 451 | 1 | 6 | 48.4 | PlasmaMembrane | TGACv1_032609_1BL: 18,947–20,825 |
| 10 | TRIAE_CS42_1BL_TGACv1_034076_AA0143330 | 423 | 1 | 5.9 | 45.3 | Cytoplasmic Mitochondrial | TGACv1_034076_1BL: 13,111–14,941 |
| 11 | TRIAE_CS42_1BS_TGACv1_049891_AA0163670 | 536 | 1 | 5.5 | 58 | Cytoplasmic Chloroplast | TGACv1_049891_1BS: 3226–6480 |
| 12 | TRIAE_CS42_1BS_TGACv1_050208_AA0169040 | 542 | 1 | 5.6 | 56.7 | Chloroplast PlasmaMembrane | TGACv1_050208_1BS: 22,661–24,740 |
| 13 | TRIAE_CS42_1DL_TGACv1_061249_AA0190020 | 486 | 1 | 6 | 52.4 | Cytoplasmic PlasmaMembrane | TGACv1_061249_1DL: 118,022–119,855 |
| 14 | TRIAE_CS42_1DL_TGACv1_061472_AA0196220 | 473 | 1 | 5.6 | 50.6 | Cytoplasmic | TGACv1_061472_1DL: 36,915–38,810 |
| 15 | TRIAE_CS42_1DL_TGACv1_061688_AA0201770 | 386 | 1 | 6 | 42.6 | Cytoplasmic | TGACv1_061688_1DL: 38,929–45,276 |
| 16 | TRIAE_CS42_1DL_TGACv1_062127_AA0209080 | 497 | 1 | 5.2 | 53 | Chloroplast Cytoplasmic | TGACv1_062127_1DL: 35,096–37,034 |
| 17 | TRIAE_CS42_2AL_TGACv1_092977_AA0268460 | 496 | 2 | 5.9 | 53.3 | Chloroplast PlasmaMembrane | TGACv1_092977_2AL: 132,556–134,743 |
| 18 | TRIAE_CS42_2AL_TGACv1_094039_AA0291500 | 363 | 1 | 6.7 | 37.6 | Chloroplast PlasmaMembrane | TGACv1_094039_2AL: 11,847–13,415 |
| 19 | TRIAE_CS42_2AL_TGACv1_094526_AA0299210 | 444 | 1 | 5.5 | 47.4 | PlasmaMembrane Chloroplast Cytoplasmic | TGACv1_094526_2AL: 10,962–12,595 |
| 20 | TRIAE_CS42_2AL_TGACv1_094669_AA0301250 | 493 | 1 | 5.7 | 53.5 | Chloroplast PlasmaMembrane Cytoplasmic | TGACv1_094669_2AL: 43,325–45,075 |
| 21 | TRIAE_CS42_2AL_TGACv1_095609_AA0312870 | 479 | 1 | 5.4 | 51.7 | Cytoplasmic | TGACv1_095609_2AL: 23,136–25,080 |
| 22 | TRIAE_CS42_2AS_TGACv1_112708_AA0343800 | 465 | 1 | 9 | 51 | Mitochondrial Chloroplast | TGACv1_112708_2AS: 5716–7407 |
| 23 | TRIAE_CS42_2AS_TGACv1_113114_AA0351430 | 314 | 1 | 5 | 35.1 | Cytoplasmic | TGACv1_113114_2AS: 82,126–83,619 |
| 24 | TRIAE_CS42_2AS_TGACv1_113164_AA0352370 | 474 | 1 | 5.5 | 51.6 | Chloroplast | TGACv1_113164_2AS: 56,381–58,985 |
| 25 | TRIAE_CS42_2AS_TGACv1_113792_AA0360520 | 471 | 1 | 5.8 | 51.1 | Chloroplast | TGACv1_113792_2AS: 1565–3515 |
| 26 | TRIAE_CS42_2AS_TGACv1_113792_AA0360550 | 470 | 1 | 5.4 | 50.6 | Cytoplasmic Chloroplast | TGACv1_113792_2AS: 12,613–15,275 |
| 27 | TRIAE_CS42_2BL_TGACv1_132343_AA0436900 | 489 | 1 | 5.7 | 53.4 | Chloroplast | TGACv1_132343_2BL: 30,155–32,015 |
| 28 | TRIAE_CS42_2BL_TGACv1_133391_AA0442380 | 485 | 1 | 5.4 | 51.3 | Chloroplast PlasmaMembrane Cytoplasmic | TGACv1_133391_2BL: 9937–11,795 |
| 29 | TRIAE_CS42_2BS_TGACv1_146052_AA0454210 | 480 | 2 | 5.4 | 54.9 | Cytoplasmic Chloroplast | TGACv1_146052_2BS: 172,038–174,105 |
| 30 | TRIAE_CS42_2BS_TGACv1_146052_AA0454220 | 234 | 1 | 5.2 | 26 | Chloroplast Cytoplasmic | TGACv1_146052_2BS: 175,207–176,915 |
| 31 | TRIAE_CS42_2BS_TGACv1_146119_AA0455760 | 477 | 1 | 5.9 | 51.6 | Chloroplast PlasmaMembrane | TGACv1_146119_2BS: 73,276–75,131 |
| 32 | TRIAE_CS42_2BS_TGACv1_146212_AA0458920 | 477 | 1 | 5.9 | 51.8 | Chloroplast | TGACv1_146212_2BS: 40,106–41,900 |
| 33 | TRIAE_CS42_2BS_TGACv1_146276_AA0461240 | 458 | 1 | 6.2 | 49.8 | Chloroplast | TGACv1_146276_2BS: 43,496–45,300 |
| 34 | TRIAE_CS42_2BS_TGACv1_146286_AA0461540 | 466 | 1 | 8.4 | 51.1 | Chloroplast Mitochondrial | TGACv1_146286_2BS: 86,006–87,750 |
| 35 | TRIAE_CS42_2BS_TGACv1_146500_AA0466680 | 498 | 1 | 5.2 | 52.4 | Chloroplast | TGACv1_146500_2BS: 99,495–101,475 |
| 36 | TRIAE_CS42_2BS_TGACv1_146843_AA0473870 | 505 | 1 | 6.4 | 53.9 | Chloroplast PlasmaMembrane | TGACv1_146843_2BS: 70,557–72,425 |
| 37 | TRIAE_CS42_2BS_TGACv1_147441_AA0483230 | 477 | 1 | 6.1 | 50.8 | Cytoplasmic | TGACv1_147441_2BS: 41,416–43,450 |
| 38 | TRIAE_CS42_2BS_TGACv1_147641_AA0485890 | 519 | 1 | 5.6 | 56.9 | Chloroplast | TGACv1_147641_2BS: 19,336–29,770 |
| 39 | TRIAE_CS42_2DL_TGACv1_158399_AA0517610 | 492 | 1 | 5.4 | 54 | Cytoplasmic | TGACv1_158399_2DL: 87,645–89,545 |
| 40 | TRIAE_CS42_2DL_TGACv1_159414_AA0537930 | 482 | 1 | 5.4 | 51.9 | PlasmaMembrane Cytoplasmic | TGACv1_159414_2DL: 9459–11,225 |
| 41 | TRIAE_CS42_2DL_TGACv1_159743_AA0542200 | 469 | 1 | 5.5 | 51.3 | Cytoplasmic | TGACv1_159743_2DL: 29,369–31,464 |
| 42 | TRIAE_CS42_2DL_TGACv1_160147_AA0547510 | 499 | 1 | 5.9 | 53.3 | PlasmaMembrane Chloroplast | TGACv1_160147_2DL: 11,782–13,675 |
| 43 | TRIAE_CS42_2DL_TGACv1_160383_AA0549920 | 485 | 2 | 5.5 | 53.7 | Cytoplasmic Mitochondrial Chloroplast | TGACv1_160383_2DL: 17,866–19,990 |
| 44 | TRIAE_CS42_2DL_TGACv1_160484_AA0550940 | 476 | 1 | 6.4 | 51.5 | PlasmaMembrane | TGACv1_160484_2DL: 22,697–24,835 |
| 45 | TRIAE_CS42_2DS_TGACv1_177189_AA0568300 | 505 | 1 | 5 | 53.5 | Chloroplast | TGACv1_177189_2DS: 168,676–170,825 |
| 46 | TRIAE_CS42_2DS_TGACv1_177304_AA0572860 | 462 | 1 | 5.2 | 49.6 | PlasmaMembrane Cytoplasmic | TGACv1_177304_2DS: 18,887–22,885 |
| 47 | TRIAE_CS42_2DS_TGACv1_177710_AA0582890 | 508 | 2 | 5.4 | 55.8 | Chloroplast | TGACv1_177710_2DS: 37,388–39,565 |
| 48 | TRIAE_CS42_2DS_TGACv1_177916_AA0587150 | 493 | 1 | 5.7 | 53.3 | Chloroplast | TGACv1_177916_2DS: 19,783–21,976 |
| 49 | TRIAE_CS42_2DS_TGACv1_178033_AA0589680 | 467 | 1 | 6.4 | 50.9 | Chloroplast | TGACv1_178033_2DS: 37,145–39,412 |
| 50 | TRIAE_CS42_2DS_TGACv1_178118_AA0591100 | 372 | 1 | 8.5 | 40 | PlasmaMembrane | TGACv1_178118_2DS: 56,233–58,495 |
| 51 | TRIAE_CS42_2DS_TGACv1_178131_AA0591440 | 497 | 1 | 5.7 | 53 | Chloroplast PlasmaMembrane Cytoplasmic | TGACv1_178131_2DS: 31,516–33,382 |
| 52 | TRIAE_CS42_2DS_TGACv1_178315_AA0594020 | 476 | 1 | 6 | 51.3 | Chloroplast | TGACv1_178315_2DS: 49,188–50,874 |
| 53 | TRIAE_CS42_2DS_TGACv1_178795_AA0601130 | 469 | 1 | 6.3 | 50 | Cytoplasmic | TGACv1_178795_2DS: 43,800–45,517 |
| 54 | TRIAE_CS42_3AL_TGACv1_194443_AA0633160 | 500 | 2 | 5.6 | 54.5 | Cytoplasmic | TGACv1_194443_3AL: 22,846–28,150 |
| 55 | TRIAE_CS42_3AL_TGACv1_194677_AA0637610 | 475 | 1 | 5.5 | 51.5 | Cytoplasmic Chloroplast | TGACv1_194677_3AL: 53,009–55,235 |
| 56 | TRIAE_CS42_3AL_TGACv1_194875_AA0641170 | 466 | 1 | 5.7 | 50.6 | Cytoplasmic Chloroplast | TGACv1_194875_3AL: 63,326–65,525 |
| 57 | TRIAE_CS42_3AS_TGACv1_210937_AA0681620 | 414 | 1 | 5.3 | 44.4 | Chloroplast Cytoplasmic | TGACv1_210937_3AS: 119,816–121,716 |
| 58 | TRIAE_CS42_3AS_TGACv1_211248_AA0687180 | 551 | 1 | 5 | 59.3 | Cytoplasmic Chloroplast | TGACv1_211248_3AS: 47,048–49,241 |
| 59 | TRIAE_CS42_3AS_TGACv1_211655_AA0692640 | 472 | 1 | 5.3 | 50.6 | Cytoplasmic | TGACv1_211655_3AS: 41,556–44,305 |
| 60 | TRIAE_CS42_3AS_TGACv1_211823_AA0694680 | 511 | 1 | 5.5 | 56.9 | Cytoplasmic | TGACv1_211823_3AS: 30,616–32,748 |
| 61 | TRIAE_CS42_3AS_TGACv1_211823_AA0694700 | 492 | 1 | 5.4 | 54.7 | Cytoplasmic | TGACv1_211823_3AS: 44,976–46,896 |
| 62 | TRIAE_CS42_3B_TGACv1_220919_AA0723700 | 472 | 1 | 6.1 | 51.3 | Chloroplast | TGACv1_220919_3B: 29,856–31,633 |
| 63 | TRIAE_CS42_3B_TGACv1_220919_AA0723750 | 469 | 1 | 5.5 | 50.8 | Chloroplast PlasmaMembrane | TGACv1_220919_3B: 149,148–150,855 |
| 64 | TRIAE_CS42_3B_TGACv1_221277_AA0735990 | 473 | 1 | 5.1 | 51 | Cytoplasmic Chloroplast | TGACv1_221277_3B: 36,097–37,935 |
| 65 | TRIAE_CS42_3B_TGACv1_221877_AA0752320 | 496 | 1 | 5.4 | 54.8 | Cytoplasmic | TGACv1_221877_3B: 70,264–73,165 |
| 66 | TRIAE_CS42_3B_TGACv1_221924_AA0753300 | 468 | 1 | 5.4 | 50.8 | Cytoplasmic Chloroplast | TGACv1_221924_3B: 38,292–39,921 |
| 67 | TRIAE_CS42_3B_TGACv1_222356_AA0762980 | 464 | 1 | 5.3 | 50.9 | PlasmaMembrane Chloroplast Cytoplasmic | TGACv1_222356_3B: 55,147–57,245 |
| 68 | TRIAE_CS42_3B_TGACv1_223815_AA0787850 | 461 | 1 | 5.2 | 50 | Chloroplast Cytoplasmic | TGACv1_223815_3B: 24,267–25,985 |
| 69 | TRIAE_CS42_3B_TGACv1_224677_AA0799850 | 457 | 2 | 5.4 | 49.9 | Chloroplast Cytoplasmic Mitochondrial | TGACv1_224677_3B: 12,637–14,485 |
| 70 | TRIAE_CS42_3B_TGACv1_228792_AA0827590 | 403 | 1 | 5.2 | 44.8 | Cytoplasmic | TGACv1_228792_3B: 13,838–16,085 |
| 71 | TRIAE_CS42_3DL_TGACv1_249782_AA0856200 | 465 | 1 | 6 | 50.8 | Cytoplasmic | TGACv1_249782_3DL: 45,815–54,365 |
| 72 | TRIAE_CS42_3DL_TGACv1_249823_AA0856930 | 481 | 1 | 5.4 | 52.8 | Cytoplasmic | TGACv1_249823_3DL: 53,186–55,160 |
| 73 | TRIAE_CS42_3DL_TGACv1_251186_AA0878520 | 489 | 1 | 6.1 | 53.1 | Chloroplast Mitochondrial | TGACv1_251186_3DL: 6166–8082 |
| 74 | TRIAE_CS42_3DL_TGACv1_251733_AA0884380 | 472 | 1 | 5.8 | 51.1 | Chloroplast | TGACv1_251733_3DL: 18,147–19,817 |
| 75 | TRIAE_CS42_3DS_TGACv1_271859_AA0909590 | 560 | 1 | 5.4 | 51.4 | Chloroplast Cytoplasmic Mitochondrial | TGACv1_271859_3DS: 46,873–53,915 |
| 76 | TRIAE_CS42_3DS_TGACv1_272095_AA0914550 | 443 | 1 | 5.5 | 48.2 | Chloroplast Cytoplasmic | TGACv1_272095_3DS: 18,456–20,253 |
| 77 | TRIAE_CS42_3DS_TGACv1_272144_AA0915540 | 380 | 2 | 5.8 | 42.2 | Cytoplasmic | TGACv1_272144_3DS: 15,466–17,879 |
| 78 | TRIAE_CS42_3DS_TGACv1_272561_AA0922330 | 498 | 1 | 5.7 | 53.7 | Cytoplasmic Mitochondrial Chloroplast | TGACv1_272561_3DS: 42,311–44,165 |
| 79 | TRIAE_CS42_3DS_TGACv1_274000_AA0934260 | 484 | 1 | 5.3 | 51.8 | Cytoplasmic | TGACv1_274000_3DS: 16,535–18,425 |
| 80 | TRIAE_CS42_4AL_TGACv1_288576_AA0952450 | 503 | 2 | 5.4 | 56.2 | Chloroplast Mitochondrial Cytoplasmic | TGACv1_288576_4AL: 121,655–123,785 |
| 81 | TRIAE_CS42_4AL_TGACv1_291270_AA0993350 | 455 | 1 | 5.8 | 47 | Chloroplast | TGACv1_291270_4AL: 21,446–23,100 |
| 82 | TRIAE_CS42_4AL_TGACv1_291728_AA0996300 | 507 | 1 | 4.9 | 54.4 | Chloroplast Cytoplasmic | TGACv1_291728_4AL: 4996–7190 |
| 83 | TRIAE_CS42_4AL_TGACv1_292113_AA0997730 | 498 | 1 | 8.7 | 54.5 | Mitochondrial | TGACv1_292113_4AL: 17,011–18,815 |
| 84 | TRIAE_CS42_4AL_TGACv1_292676_AA0999440 | 506 | 1 | 5 | 54.5 | Chloroplast Cytoplasmic | TGACv1_292676_4AL: 10,676–12,740 |
| 85 | TRIAE_CS42_4AL_TGACv1_293019_AA1000030 | 452 | 1 | 6.6 | 49.7 | Mitochondrial Cytoplasmic | TGACv1_293019_4AL: 8872–10,875 |
| 86 | TRIAE_CS42_4BL_TGACv1_320707_AA1046800 | 359 | 1 | 5.5 | 39.7 | PlasmaMembrane Cytoplasmic | TGACv1_320707_4BL: 6020–7485 |
| 87 | TRIAE_CS42_4BS_TGACv1_327950_AA1079620 | 576 | 1 | 8.4 | 62.3 | PlasmaMembrane Mitochondrial | TGACv1_327950_4BS: 204,456–207,103 |
| 88 | TRIAE_CS42_4BS_TGACv1_329322_AA1100160 | 455 | 1 | 6.1 | 47.2 | Chloroplast | TGACv1_329322_4BS: 51,826–53,691 |
| 89 | TRIAE_CS42_4BS_TGACv1_329455_AA1101520 | 461 | 1 | 6.5 | 49.8 | Chloroplast Cytoplasmic | TGACv1_329455_4BS: 26,226–28,193 |
| 90 | TRIAE_CS42_4BS_TGACv1_329471_AA1101760 | 567 | 1 | 7.2 | 61.6 | PlasmaMembrane | TGACv1_329471_4BS: 21,537–26,265 |
| 91 | TRIAE_CS42_4BS_TGACv1_332581_AA1110480 | 461 | 1 | 5.8 | 49.5 | Chloroplast Cytoplasmic PlasmaMembrane | TGACv1_332581_4BS: 1227–3355 |
| 92 | TRIAE_CS42_4DL_TGACv1_343563_AA1136610 | 474 | 1 | 5.4 | 51.3 | Chloroplast | TGACv1_343563_4DL: 21,876–23,872 |
| 93 | TRIAE_CS42_4DL_TGACv1_344211_AA1144960 | 482 | 1 | 5.6 | 52.4 | Chloroplast | TGACv1_344211_4DL: 9685–11,555 |
| 94 | TRIAE_CS42_5AL_TGACv1_374728_AA1207660 | 491 | 1 | 6 | 53.4 | Cytoplasmic | TGACv1_374728_5AL: 108,276–110,700 |
| 95 | TRIAE_CS42_5AL_TGACv1_375188_AA1217460 | 429 | 1 | 5.9 | 46.3 | Cytoplasmic Chloroplast PlasmaMembrane | TGACv1_375188_5AL: 37,326–38,987 |
| 96 | TRIAE_CS42_5AL_TGACv1_375684_AA1225590 | 475 | 2 | 5.8 | 51.2 | Cytoplasmic Chloroplast | TGACv1_375684_5AL: 54,671–56,869 |
| 97 | TRIAE_CS42_5AL_TGACv1_375893_AA1228550 | 461 | 1 | 6.1 | 49.4 | Mitochondrial | TGACv1_375893_5AL: 47,896–49,580 |
| 98 | TRIAE_CS42_5AL_TGACv1_375929_AA1229020 | 476 | 1 | 5.6 | 51.7 | PlasmaMembrane | TGACv1_375929_5AL: 57,318–59,915 |
| 99 | TRIAE_CS42_5AL_TGACv1_376019_AA1230850 | 491 | 1 | 5.8 | 52.5 | Cytoplasmic Mitochondrial | TGACv1_376019_5AL: 40,796–42,980 |
| 100 | TRIAE_CS42_5AL_TGACv1_377811_AA1249610 | 472 | 1 | 5.8 | 51.9 | Chloroplast | TGACv1_377811_5AL: 10,736–13,180 |
| 101 | TRIAE_CS42_5BL_TGACv1_404184_AA1288910 | 490 | 1 | 5 | 53.3 | Chloroplast | TGACv1_404184_5BL: 196,689–198,409 |
| 102 | TRIAE_CS42_5BL_TGACv1_404184_AA1288920 | 490 | 1 | 5.5 | 53.3 | Chloroplast | TGACv1_404184_5BL: 293,989–296,149 |
| 103 | TRIAE_CS42_5BL_TGACv1_404233_AA1291500 | 506 | 1 | 5.3 | 54.9 | Cytoplasmic | TGACv1_404233_5BL: 154,317–156,325 |
| 104 | TRIAE_CS42_5BL_TGACv1_404244_AA1291960 | 470 | 1 | 5.6 | 50.6 | Cytoplasmic | TGACv1_404244_5BL: 82,335–84,305 |
| 105 | TRIAE_CS42_5BL_TGACv1_404293_AA1294180 | 497 | 1 | 5.7 | 53.7 | Cytoplasmic Chloroplast | TGACv1_404293_5BL: 93,246–95,160 |
| 106 | TRIAE_CS42_5BL_TGACv1_404294_AA1294310 | 477 | 1 | 5.9 | 50.3 | Chloroplast | TGACv1_404294_5BL: 185,737–187,835 |
| 107 | TRIAE_CS42_5BL_TGACv1_404418_AA1299240 | 471 | 1 | 5.6 | 50.8 | Chloroplast Cytoplasmic | TGACv1_404418_5BL: 207,022–208,895 |
| 108 | TRIAE_CS42_5BL_TGACv1_405759_AA1334850 | 464 | 1 | 5.8 | 50.4 | Mitochondrial PlasmaMembrane | TGACv1_405759_5BL: 73,581–75,127 |
| 109 | TRIAE_CS42_5BL_TGACv1_406257_AA1343160 | 473 | 1 | 6.1 | 51.2 | Mitochondrial | TGACv1_406257_5BL: 33,956–36,228 |
| 110 | TRIAE_CS42_5BL_TGACv1_406579_AA1347330 | 491 | 3 | 5.4 | 53.3 | Chloroplast Cytoplasmic | TGACv1_406579_5BL: 19,551–21,635 |
| 111 | TRIAE_CS42_5BL_TGACv1_406904_AA1351330 | 457 | 1 | 6.1 | 49.4 | Chloroplast | TGACv1_406904_5BL: 33,027–34,745 |
| 112 | TRIAE_CS42_5BL_TGACv1_408090_AA1361610 | 374 | 1 | 5.3 | 40.7 | Cytoplasmic | TGACv1_408090_5BL: 6001–9585 |
| 113 | TRIAE_CS42_5BS_TGACv1_424806_AA1391870 | 444 | 1 | 6.2 | 48.3 | PlasmaMembrane Chloroplast | TGACv1_424806_5BS: 5556–7050 |
| 114 | TRIAE_CS42_5DL_TGACv1_433291_AA1408500 | 490 | 1 | 5.1 | 52.4 | PlasmaMembrane Chloroplast | TGACv1_433291_5DL: 25,092–26,905 |
| 115 | TRIAE_CS42_5DL_TGACv1_434244_AA1432540 | 456 | 1 | 4.8 | 50.3 | Chloroplast Cytoplasmic | TGACv1_434244_5DL: 7506–11,405 |
| 116 | TRIAE_CS42_5DL_TGACv1_435855_AA1455600 | 491 | 3 | 5.4 | 53.5 | Chloroplast Cytoplasmic | TGACv1_435855_5DL: 4016–6117 |
| 117 | TRIAE_CS42_5DL_TGACv1_436083_AA1457870 | 455 | 2 | 5.6 | 50 | Cytoplasmic | TGACv1_436083_5DL:20522–22,605 |
| 118 | TRIAE_CS42_5DS_TGACv1_456986_AA1480690 | 506 | 3 | 5.1 | 54.6 | Chloroplast | TGACv1_456986_5DS: 56,363–58,465 |
| 119 | TRIAE_CS42_5DS_TGACv1_457896_AA1490570 | 454 | 1 | 6.5 | 49.3 | PlasmaMembrane Chloroplast | TGACv1_457896_5DS: 16,778–18,475 |
| 120 | TRIAE_CS42_6AL_TGACv1_471580_AA1511220 | 492 | 1 | 5.8 | 53.3 | Chloroplast Cytoplasmic | TGACv1_471580_6AL: 48,286–50,301 |
| 121 | TRIAE_CS42_6AL_TGACv1_472815_AA1526300 | 492 | 1 | 5.2 | 53.7 | Cytoplasmic | TGACv1_472815_6AL: 30,598–36,845 |
| 122 | TRIAE_CS42_6AL_TGACv1_473165_AA1529140 | 486 | 2 | 5.6 | 53.1 | Chloroplast | TGACv1_473165_6AL: 22,571–24,615 |
| 123 | TRIAE_CS42_6AS_TGACv1_486256_AA1558890 | 515 | 1 | 5.9 | 56.4 | Chloroplast | TGACv1_486256_6AS: 20,827–22,845 |
| 124 | TRIAE_CS42_6AS_TGACv1_486559_AA1562640 | 480 | 1 | 5.4 | 52.6 | Chloroplast | TGACv1_486559_6AS: 45,174–47,285 |
| 125 | TRIAE_CS42_6BL_TGACv1_499376_AA1580390 | 485 | 1 | 5.3 | 53.3 | Chloroplast Cytoplasmic | TGACv1_499376_6BL: 125,626–127,400 |
| 126 | TRIAE_CS42_6BL_TGACv1_499650_AA1588270 | 377 | 1 | 5.9 | 40.6 | Chloroplast | TGACv1_499650_6BL: 164,606–166,056 |
| 127 | TRIAE_CS42_6BL_TGACv1_499908_AA1594400 | 483 | 1 | 5.1 | 53.3 | Cytoplasmic | TGACv1_499908_6BL: 62,922–65,065 |
| 128 | TRIAE_CS42_6BL_TGACv1_500434_AA1604570 | 464 | 1 | 6.2 | 50.1 | Cytoplasmic | TGACv1_500434_6BL:47486–50,072 |
| 129 | TRIAE_CS42_6BL_TGACv1_500839_AA1610500 | 490 | 1 | 4.9 | 53.2 | Cytoplasmic | TGACv1_500839_6BL: 69,656–71,577 |
| 130 | TRIAE_CS42_6BL_TGACv1_502282_AA1624090 | 484 | 1 | 5.3 | 53.2 | Cytoplasmic | TGACv1_502282_6BL: 7757–9575 |
| 131 | TRIAE_CS42_6BS_TGACv1_513285_AA1637340 | 496 | 1 | 5.3 | 52.3 | Chloroplast | TGACv1_513285_6BS: 53,840–59,465 |
| 132 | TRIAE_CS42_6BS_TGACv1_513359_AA1638830 | 478 | 1 | 5 | 51.8 | Chloroplast Cytoplasmic | TGACv1_513359_6BS: 87,396–89,178 |
| 133 | TRIAE_CS42_6BS_TGACv1_513952_AA1652850 | 462 | 1 | 6.1 | 49.1 | Mitochondrial Chloroplast | TGACv1_513952_6BS: 89,206–91,232 |
| 134 | TRIAE_CS42_6BS_TGACv1_514318_AA1658270 | 493 | 1 | 4.8 | 52.3 | Cytoplasmic Chloroplast | TGACv1_514318_6BS: 26,417–28,435 |
| 135 | TRIAE_CS42_6DL_TGACv1_526838_AA1693090 | 511 | 1 | 10.3 | 57.2 | Nuclear | TGACv1_526838_6DL: 83,730–85,630 |
| 136 | TRIAE_CS42_6DL_TGACv1_526838_AA1693100 | 527 | 1 | 5.5 | 57.5 | Cytoplasmic | TGACv1_526838_6DL: 91,545–93,815 |
| 137 | TRIAE_CS42_6DL_TGACv1_527354_AA1702670 | 479 | 1 | 5.8 | 51.7 | Chloroplast PlasmaMembrane Cytoplasmic | TGACv1_527354_6DL: 31,226–34,990 |
| 138 | TRIAE_CS42_6DL_TGACv1_528544_AA1714910 | 459 | 1 | 5.8 | 49.6 | Cytoplasmic | TGACv1_528544_6DL: 22,658–24,474 |
| 139 | TRIAE_CS42_6DL_TGACv1_528747_AA1715930 | 388 | 1 | 5.2 | 43.7 | Cytoplasmic | TGACv1_528747_6DL: 19,746–21,729 |
| 140 | TRIAE_CS42_6DL_TGACv1_529217_AA1717790 | 537 | 2 | 6.7 | 59 | Mitochondrial | TGACv1_529217_6DL: 7806–10,055 |
| 141 | TRIAE_CS42_6DS_TGACv1_542680_AA1727420 | 511 | 1 | 7.3 | 55.4 | Mitochondrial | TGACv1_542680_6DS: 110,916–113,054 |
| 142 | TRIAE_CS42_6DS_TGACv1_542696_AA1728130 | 480 | 1 | 5.5 | 52.3 | Chloroplast Cytoplasmic | TGACv1_542696_6DS: 29,236–31,123 |
| 143 | TRIAE_CS42_6DS_TGACv1_543630_AA1742350 | 484 | 2 | 5.3 | 53 | Chloroplast Cytoplasmic | TGACv1_543630_6DS: 21,813–23,926 |
| 144 | TRIAE_CS42_6DS_TGACv1_543780_AA1744110 | 496 | 1 | 4.8 | 52.8 | Cytoplasmic Chloroplast | TGACv1_543780_6DS: 23,657–25,745 |
| 145 | TRIAE_CS42_7AL_TGACv1_556001_AA1752070 | 731 | 2 | 8.8 | 76.5 | PlasmaMembrane Mitochondrial | TGACv1_556001_7AL: 5064–14,615 |
| 146 | TRIAE_CS42_7AL_TGACv1_556001_AA1752080 | 460 | 2 | 5.5 | 50.7 | Chloroplast | TGACv1_556001_7AL: 63,295–65,765 |
| 147 | TRIAE_CS42_7AL_TGACv1_556054_AA1753810 | 488 | 1 | 5.7 | 53.3 | Cytoplasmic Chloroplast | IWGSC_CSS_7AL_4383366: 4–1333 |
| 148 | TRIAE_CS42_7AL_TGACv1_556712_AA1769470 | 419 | 1 | 6 | 45 | Chloroplast PlasmaMembrane Cytoplasmic | TGACv1_556712_7AL: 76,829–78,415 |
| 149 | TRIAE_CS42_7AL_TGACv1_558513_AA1793890 | 449 | 1 | 5.5 | 49.3 | PlasmaMembrane | TGACv1_558513_7AL: 9716–12,339 |
| 150 | TRIAE_CS42_7AL_TGACv1_559924_AA1801280 | 467 | 2 | 6.1 | 49.9 | Chloroplast PlasmaMembrane | TGACv1_559924_7AL: 15,613–17,418 |
| 151 | TRIAE_CS42_7AS_TGACv1_570575_AA1837870 | 507 | 1 | 5.5 | 54.7 | Cytoplasmic | TGACv1_570575_7AS: 49,636–52,320 |
| 152 | TRIAE_CS42_7AS_TGACv1_571539_AA1848450 | 469 | 1 | 5.5 | 49.9 | Chloroplast | TGACv1_571539_7AS: 11,854–13,474 |
| 153 | TRIAE_CS42_7AS_TGACv1_573368_AA1852750 | 442 | 1 | 5.6 | 47.6 | Chloroplast Mitochondrial | TGACv1_573368_7AS: 816–2486 |
| 154 | TRIAE_CS42_7BL_TGACv1_576822_AA1856120 | 402 | 1 | 6.9 | 44 | Chloroplast | TGACv1_576822_7BL: 170,238–172,395 |
| 155 | TRIAE_CS42_7BL_TGACv1_576994_AA1862270 | 463 | 1 | 5.4 | 50.9 | Cytoplasmic PlasmaMembrane Mitochondrial | TGACv1_576994_7BL: 67,842–69,505 |
| 156 | TRIAE_CS42_7BL_TGACv1_577254_AA1870230 | 252 | 1 | 4.9 | 26.9 | Cytoplasmic Chloroplast Extracellular | TGACv1_577254_7BL: 76,415–77,415 |
| 157 | TRIAE_CS42_7BL_TGACv1_577547_AA1878460 | 420 | 1 | 7.2 | 45.2 | PlasmaMembrane Chloroplast | TGACv1_577547_7BL: 29,086–30,601 |
| 158 | TRIAE_CS42_7BL_TGACv1_579457_AA1907470 | 484 | 1 | 5.2 | 52.7 | Chloroplast | TGACv1_579457_7BL: 41,356–43,187 |
| 159 | TRIAE_CS42_7BS_TGACv1_591871_AA1924040 | 397 | 1 | 5.1 | 29.3 | Cytoplasmic Chloroplast | TGACv1_591871_7BS: 76,246–80,992 |
| 160 | TRIAE_CS42_7BS_TGACv1_592186_AA1932820 | 529 | 1 | 5 | 56.5 | Chloroplast Cytoplasmic | TGACv1_592186_7BS: 90,491–92,505 |
| 161 | TRIAE_CS42_7BS_TGACv1_592546_AA1940110 | 482 | 1 | 6.1 | 52 | PlasmaMembrane Mitochondrial | TGACv1_592546_7BS: 65,246–67,190 |
| 162 | TRIAE_CS42_7BS_TGACv1_593204_AA1949410 | 497 | 1 | 5.3 | 53.4 | Chloroplast | TGACv1_593204_7BS: 13,157–15,085 |
| 163 | TRIAE_CS42_7BS_TGACv1_593321_AA1950440 | 465 | 1 | 5.8 | 50 | PlasmaMembrane | TGACv1_593321_7BS: 38,716–40,476 |
| 164 | TRIAE_CS42_7BS_TGACv1_593432_AA1951550 | 470 | 1 | 5.8 | 51.4 | Chloroplast | TGACv1_593432_7BS: 27,150–29,205 |
| 165 | TRIAE_CS42_7DL_TGACv1_603213_AA1978480 | 481 | 1 | 5.5 | 52.2 | Chloroplast | TGACv1_603213_7DL: 60,111–61,985 |
| 166 | TRIAE_CS42_7DL_TGACv1_603403_AA1982990 | 421 | 1 | 5.4 | 43.7 | Chloroplast PlasmaMembrane | TGACv1_603403_7DL: 64,856–66,500 |
| 167 | TRIAE_CS42_7DL_TGACv1_603951_AA1991550 | 458 | 1 | 5.3 | 49.8 | Chloroplast PlasmaMembrane | TGACv1_603951_7DL: 21,366–23,048 |
| 168 | TRIAE_CS42_7DL_TGACv1_603951_AA1991560 | 453 | 1 | 5.3 | 49.1 | Chloroplast PlasmaMembrane | TGACv1_603951_7DL: 27,012–28,816 |
| 169 | TRIAE_CS42_7DL_TGACv1_604766_AA2001560 | 438 | 1 | 5.6 | 47 | Mitochondrial Chloroplast | TGACv1_604766_7DL: 35,976–38,150 |
| 170 | TRIAE_CS42_7DS_TGACv1_621774_AA2025670 | 478 | 1 | 5.2 | 50.8 | Chloroplast | TGACv1_621774_7DS: 76,896–78,775 |
| 171 | TRIAE_CS42_7DS_TGACv1_622710_AA2044230 | 489 | 2 | 5.3 | 54.5 | Cytoplasmic | TGACv1_622710_7DS: 15,926–17,908 |
| 172 | TRIAE_CS42_7DS_TGACv1_623144_AA2050000 | 447 | 1 | 5.8 | 48.4 | Cytoplasmic Chloroplast | TGACv1_623144_7DS: 33,046–34,980 |
| 173 | TRIAE_CS42_7DS_TGACv1_624130_AA2059090 | 488 | 1 | 5.9 | 52.5 | Mitochondrial PlasmaMembrane | TGACv1_624130_7DS: 15,066–16,815 |
| 174 | TRIAE_CS42_7DS_TGACv1_626811_AA2066910 | 480 | 1 | 5.7 | 50.7 | PlasmaMembrane Chloroplast | TGACv1_626811_7DS: 3831–5558 |
| 175 | TRIAE_CS42_U_TGACv1_642463_AA2118110 | 489 | 1 | 6.2 | 52.4 | Chloroplast | TGACv1_642463_U: 55,580–57,595 |
| 176 | TRIAE_CS42_U_TGACv1_642555_AA2119560 | 296 | 1 | 5.3 | 31.8 | Chloroplast Cytoplasmic | TGACv1_642555_U: 31,767–32,735 |
| 177 | TRIAE_CS42_U_TGACv1_642847_AA2124040 | 479 | 1 | 5.9 | 51.5 | Chloroplast PlasmaMembrane | TGACv1_642847_U: 26,547–28,358 |
| 178 | TRIAE_CS42_U_TGACv1_644603_AA2140590 | 673 | 1 | 7.6 | 72.7 | Chloroplast | TGACv1_644603_U: 19,926–22,260 |
| 179 | TRIAE_CS42_U_TGACv1_658309_AA2151750 | 368 | 1 | 8.3 | 40.7 | Chloroplast | TGACv1_658309_U: 1–1355 |
Phylogenetic analysis of UGTs in wheat
The identified UGTs were subjected to phylogenetic analysis to see their grouping pattern and genetic relationships based on the 18 Arabidopsis UGTs sequences (Additional file 3: Table S2) [20, 22]. The wheat UGTs were clustered into 16 major phylogenetic groups, with a lack of Arabidopsis conserved phylogenetic group K (Fig. 1). The 14 UGT groups (A-N) described initially in Arabidopsis are considered as conserved groups, and all these groups except group K were found in this study [47]. The number of UGTs in each group varied, as group E, the largest of the groups, contained 37 UGT members, while group N, the smallest of the groups, had only one member. The three new groups identified in our study were O, P and Q containing 3, 13 and 36 UGT members, respectively.
Fig. 1.
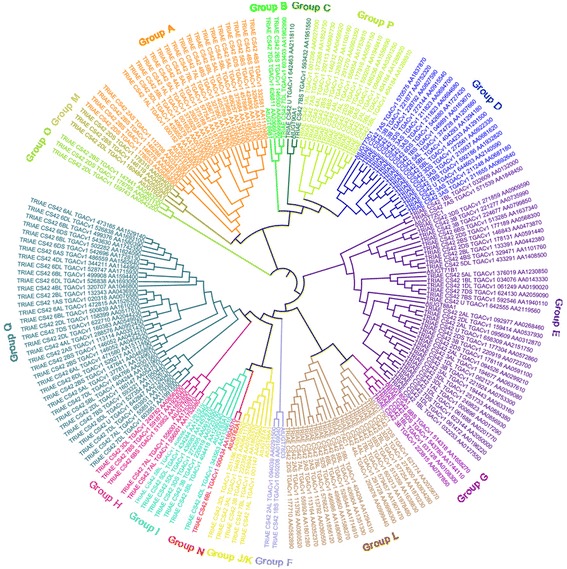
Phylogenetic analysis of bread wheat UGT family genes. The MUSCLE and MEGA 7 softwares were used for the sequence alignment and construction of the phylogenetic tree using the full length sequences of 179 wheat UGTs and 18 Arabidopsis UGTs
Genome distribution of wheat UGT genes
Based on the current wheat genome annotation information, the genetic mapping of UGT genes on wheat chromosomes was further investigated (Fig. 2). A total of 51, 67, and 61 UGT genes were non-randomly distributed in the A, B and D sub-genomes respectively (Table 1; Fig. 2). The number of UGTs varied from a minimum of 2 UGTs per chromosome to a maximum of 15 UGTs per chromosome among all the sub-genomes. Within the sub-genome A, chromosomes 6 and 2 had the minimum (5) and maximum (10) number of UGTs, respectively, and within sub-genome B, chromosomes 1 and 4 had the minimum (6) UGTs each, and its chromosome 5 had the maximum number (13) of UGTs.
Fig. 2.

Chromosome distribution of 179 wheat UGT genes. The wheat UGTs were distributed among seven chromosomes and each of the 3 sub-genomes A, B and D. The different colored bars represent a chromosome and the name of each chromosome along with its sub-genome is mentioned, on top of each bar
Structure of wheat UGT genes
The exon-intron structure is important to know the possibility of existence of alternative isoforms of a gene product that if so, can contribute to the complexity of cellular constitution and compartmentalization. The UGTs identified in this study were searched for intron existence, intron size and phases of introns (Additional file 4: Table S3). Among the 179 UGT genes identified in this study, 81 UGTs (44.5%) contained introns and among the intron containing UGTs 60, 17 and 4 had 1, 2 and 3 introns, respectively (Additional file 4: Table S3). After mapping the introns to the amino acid sequence alignment, at least 10 intron insertion events numbered I-1 to I-10, as per their position in the protein sequence, were observed (Fig. 3). The intron (I-4) was the most widespread intron found across 38 sequences of wheat UGTs spread across groups A, B, D, E, F, G, H, I, J and Q. The phylogenetic group Q sequences had the highest number (27) of intron insertions, but only 6 different types of introns were found in this group; on the other hand, group A and D shared the highest number (7) of different types of intron insertions (Additional file 4: Table S3). A variable number of intron phases were observed for the UGT protein sequences showing abundance of 0 and 1 phases and scarcity of introns in phase 2. The most abundant phase was 0 (48%), followed by phase 1 (42%) and only 15% were in phase 2 (Additional file 4: Table S3).
Fig. 3.
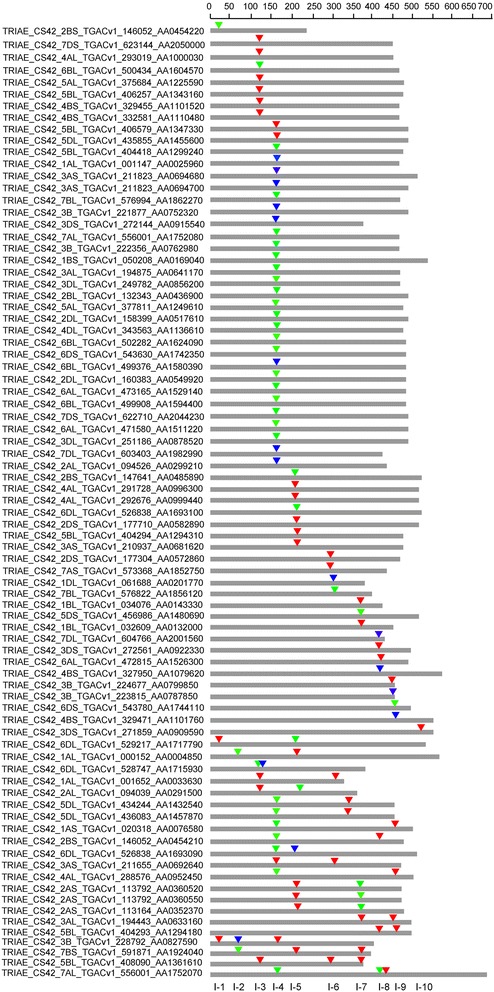
Distribution of introns among 81 wheat UGT genes. The map represents the intron positions (inverted triangles) and phases (different colors of the inverted triangles) on the amino acid (thick grey lines) residues encoded by the UGT genes. The red, green and blue colors represent the 0, 1 and 2 phases of introns, respectively. The scale on top represents the amino acid count of the UGT genes, and the numbers on the bottom represent the identity of each intron
Expression profiles of wheat UGT genes in various tissues at different developmental stages
To study the expression profiles of UGT genes during the life cycle of the wheat plant, the relative expression of UGT genes in the root, shoot, leaf, spike and grains each at three developmental stages were analyzed as per the Zadoks scale [44]. Using the online high-throughput RNA sequences data, the expression profiles of probes representing 109 wheat UGT genes were found and were further depicted as a heat map (Fig. 4; Additional file 5: Table S4). The specific expression profile at different developmental stages revealed that most of the genes were expressed at a specific time in each tissue. Among all only nine genes showed extensive expression in almost all of the tissues but not in all the developmental stages and two of these genes TRIAE_CS42_1BL_TGACv1_032609_AA0132000 and TRIAE_CS42_4AL_TGACv1_288576_AA0952450 showed the highest expression level in most of the tissues. The expression of most UGT genes varied in each organ at different developmental time course, like in grain, leaf, spike and stem the highest expression occurred at the Z85, Z71, Z39 and Z65 stages, respectively (Fig. 4). It was also noted that the highest number of genes were expressed in roots followed by leaves, stem, grains and spikes. None of the genes, except one in spikes, two in stem and three in roots, showed the highest expression in all three developmental stages of these organs. Over all approximately 57% UGTs were showing relatively high expression in the life cycle of the wheat plant based on this data (Fig. 4).
Fig. 4.
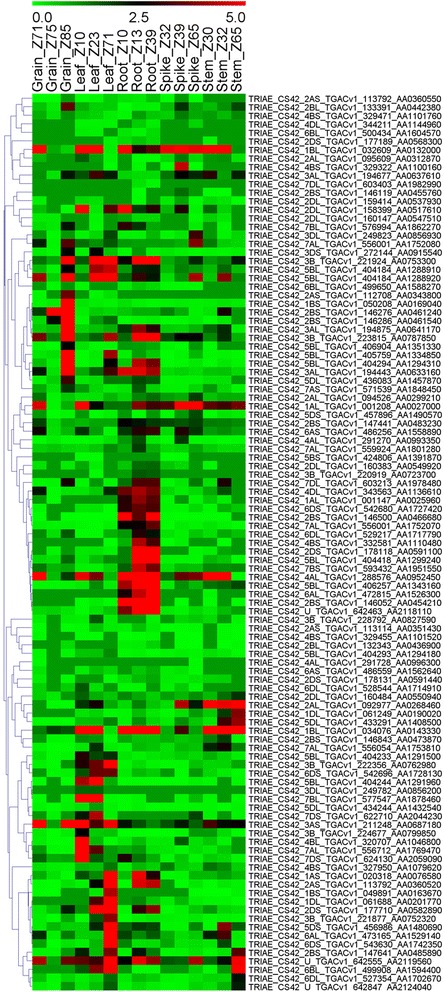
Expression profiles of wheat UGT genes in five different tissues at three different developmental stages. The different colors represent the abundance of the transcripts. The developmental stages are denoted using the Zadoks scale
Expression profiles of wheat UGT genes under Fusarium graminearum treatment
In the present study, expression patterns of the UGT genes in response to F. graminearum strains producing DON or not after 2 and 4 days after inoculation were investigated using the online Affymetrix wheat array data (GSE54554) to study the roles of UGT genes in response to FHB resistance. The expression profile of UGT genes at 2 and 4 days after infection (DAI) compared to the control plants showed a differential expression pattern under infected conditions (Fig. 5; Additional file 6: Table S5). One of the most remarkable observations was that the number of genes showing extensive expression during F. graminearum stress producing DON was almost double that of the number of genes expressed during F. graminearum stress without DON at both 2 DAI and 4 DAI. Among all only 10 genes showed relative higher up-regulation at all circumstances of 2 and 4 DAI except for the control plants, while on the other hand 5 genes were clearly down regulated at all circumstances after F. graminearum inoculation (Fig. 5).
Fig. 5.

Relative expression profiles of wheat UGT genes during Fg-DON and Fg + DON treatment. The wheat spikes were inoculated with the F. graminearum strain that did not produce DON (Fg-DON) as well as with the F. graminearum strain that produced DON (Fg + DON), with water as the control. Relative expression potential of UGT genes is represented by the scale of different colors. The red or green colors represent the higher or lower relative abundance, respectively, of each transcript in each sample
Validation of the expression of UGT genes by RT-qPCR
We employed RT-qPCR to validate the expression profile of the UGT genes in different tissues as well as during F. graminearum inoculation of spikes at different time intervals in wheat. A total of 6 UGT transcript sequences were selected to be used for expression profiling in the root, stem, spike and grains and were further employed for expression profiling of the UGT genes in F. graminearum inoculated spikes. The 6 UGT genes were TRIAE_CS42_4DL_TGACv1_343563_AA1136610, TRIAE_CS42_3B_TGACv1_228792_AA0827590, TRIAE_CS42_1AL_TGACv1_000696_AA0017290, TRIAE_CS42_3DS_TGACv1_274000_AA0934260, TRIAE_CS42_3DL_TGACv1_251733_AA0884380 and TRIAE_CS42_6BL_TGACv1_499376_AA1580390. The leaf tissues relative to the root and stem showed high expression of the 6 selected genes, in addition to a variable expression of the same genes in the leaf tissues (Fig. 6a). The spikelets at three different developmental stages did not show any noticeable expression of the tested genes (Fig. 6a). The transcript accumulation increased in grains with the development of grain maturity and highest expression was noted at the most mature stage (Fig. 6a). When the spikelets were inoculated with F. graminearum at two different time intervals, the results clearly indicated the extensive expression of the selected genes in F. graminearum inoculated spikes compared to the control plants (Fig. 6b-g). The gene TRIAE_CS42_TGACv1_228792_AA0827590 gave the highest relative expression at both time intervals in the F. graminearum inoculated spikes compared to the rest of the genes tested (Fig. 6f).
Fig. 6.
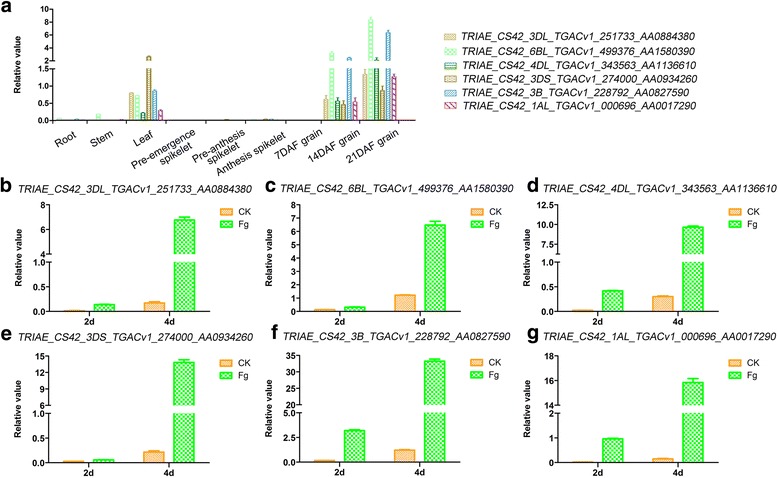
Validation of the expression level of UGTs by qRT-PCR analysis. Expression confirmation assay of the six selected UGT genes were performed in various wheat tissues at different time intervals (a) and under F. graminearum treatment (b-g)
Discussion
The advent of genome sequencing and the availability of global genomic databases have made it possible to examine complex genomes such as wheat in much greater detail. The identification and validation of FHB resistance genes in wheat is one of the major focuses in the current era of molecular investigations, pertaining to high FHB related economic losses and grain contamination due to DON accumulation. Glycosylation is one of the most important modification and detoxification phenomenon of plant secondary metabolites [15, 48]. Glycosylation, mediated by plants’ indigenous UGTs, in addition to various cellular process and maintenance of cellular homeostasis, also plays a potential role in DON detoxification and FHB resistance. UGTs have been identified and analyzed in a few plant species such as Arabidopsis, flax, maize and cotton; however, they have not been identified on a large scale in wheat except in a few individual reports [14, 15, 20, 22].
In the present study we identified 179 putative family-1 UGT genes in wheat based on the Chinese Spring (CS42) reference sequence [40]. The exact number of family-1 UGT genes may be alterable in different wheat cultivars as substantial sequence differences such as nucleotides presence/absence are prevalent among cultivars including wheat. The 179 UGT protein sequences were further subjected to multiple sequence alignment and phylogenetic analysis. The multiple sequence alignment of wheat UGTs clearly showed high sequence divergence, especially at the N-terminus, revealing the diverse roles that UGTs play in the life of plants [15]. In this study, the phylogenetic analysis resulted in 16 different (A-Q) phylogenetic groups with one exception. The conserved group K previously described in other studies was absent in our findings, similarly in another study conserved group C was also not found in Gossypium hirsutum [15]. The loss of a phylogenetic group during evolution suggests either the loss of function or replacement by other factors [15]. In our study group E contained the highest number (37) of UGT genes leading to 21% of the total UGT genes identified in wheat. In Arabidopsis, flax and maize group E had 17, 22 and 35 UGT members, respectively, showing the expansion of group E in different plant species [21, 22]. The new groups O, P and Q were found in this investigation. Group Q, first discovered in maize having only 7 members, while in cotton this group was not found; on contrary, our study showed that group Q was not only found but was the 2nd largest group of UGTs in wheat consisting of 36 members [15, 22].
The UGTs distribution among the chromosomes showed a dispersion of UGTs across all the chromosomes of all the three wheat genomes. A similar pattern of UGTs dispersion was also observed in Arabidopsis and among the three species of cotton [15, 47]. Quantitative trait loci (QTLs) for the resistance to Fusarium head blight have also been found on all wheat chromosomes, and the most stable QTLs related to FHB resistance are supposed to be located on chromosome 3B, 5A and 6B [49], and here we have shown that these chromosomes have as many as 9, 7 and 10 family-1 UGTs, respectively, but the relationship with these QTLs and the exact role of these UGTs in resistance to FHB needs to be further studied. Introns, although do not contribute to protein sequences but their position and phases do affect the protein diversity and overall cellular functioning. Introns relative positions can predict certain clues like how genes and their corresponding proteins evolve and further contribute to the diversification of gene families [22, 50]. A total of 10 different intron insertions were identified in this study, while in other crops such as flax and maize 7 and 9 different introns were found, respectively [20, 22]. Among the 179 identified wheat UGTs, 55% lacked introns which is in accordance with previous reports on Arabidopsis, flax and maize of which 58%, 55% and 60% lack introns, respectively [20, 22, 47]. In our study, intron 5, found across phylogenetic groups A, B, D, E, F, H, I, J and Q, is considered as the most widespread and oldest intron. Similarly, intron 2 in Arabidopsis found in groups F-K, intron 3 and 4 in flax found in groups F-K, and intron 5 in maize found in groups F-J and N are considered the oldest and most widespread introns [20, 22, 47]. Consistent with other findings, we also observed the abundance of phase 0 and 1 introns compared to phase 2 introns [22]. The existence of different UGTs has been shown in various sub-cellular locations such as cytoplasm, vacuoles, endoplasmic reticulum as well as the membrane [51–54]. DON accumulates in the cytoplasm, plasma membrane and chloroplasts of plant cells [55], and the UGT protein sequences identified in our study also have divergent sub-cellular localization and might lower DON toxicity if confronted in these organelles.
To better understand the roles of the wheat UGTs during the life cycle of wheat, we performed an expression analysis of online universal microarray data in certain tissues at different developmental stages. The microarray results have revealed probes that specifically match 61% of the identified wheat UGTs, and most of these genes have been expressed at least in a certain tissue during the life cycle of the wheat plant. Similarly, in other crops such as maize and flax it has been shown that 82% and 73% of the corresponding genes showed expression [20, 22]. The genes analyzed in different tissues, as per the microarray results, showed that 13%, 29%, 35%, 9% and 15% of the UGT genes displayed extensive overexpression in grains, leaf, root, spikes and stem, respectively, during all the various stages studied. Using selected UGT gene sequences, RT-qPCR also revealed a differential expression profile in most of the growth stages in certain wheat tissues, suggesting that the UGTs are opting for preferential expression in particular organs during the life cycle of the wheat plant.
FHB is a menace for agriculture crops, especially for wheat growing in the humid regions of the world, and current focus has been placed on understanding the molecular mechanisms behind FHB resistance and the development of germplasms resistant to FHB. It is important to outline the role of the UGTs identified in this study, if any, during the F. graminearum incidence that could further be utilized for the development of resistance against F. graminearum stress. As many other investigators have previously shown the involvement UGTs in host resistance against FHB both in wheat as well as in barley [33, 37]. In our study, the F. graminearum stress responsive genes analyzed using online microarray data revealed some interesting results that were further validated by expression analysis of selected UGT genes using RT-qPCR. The wheat spikes were inoculated with a mutated F. graminearum strain that does not produce DON (Fg-DON) as well as with an F. graminearum strain that produces DON (Fg + DON), with water as the control. An average of 27 and 59% of the UGT genes were up regulated after Fg-DON and Fg + DON inoculation, respectively, compared with the control at 2 DAI. On the other hand, an average of 32 and 69% of the UGT genes displayed up-regulation in the Fg-DON and Fg + DON inoculated plants, respectively, at 4 DAI compared to the control plants. The up-regulation of a high number of UGTs during Fg + DON inoculation is an indication of the wheat indigenous UGTs based DON responsive defense mechanism against FHB. The data also clearly show an extensive up-regulation of a high number of genes on the 4th day after Fg + DON inoculation, showing an increase in response as DON accumulation increases. These results were further confirmed through RT-qPCR amplification of 6 selected UGT genes, where the highest expression was evident at 4 DAI. These genes and validation of the microarray data using a resistant genotype such as Sumai 3 will be the subject of our ongoing research to further dissect the wheat indigenous defense mechanisms and to identify the resistance source underlying F. graminearum infection and DON detoxification.
Conclusions
This study gave a useful insight into the phylogenetic structure, distribution, and expression patterns of family-1 UDP glycosyltransferases of wheat. The results also offer a foundation for future work aimed at elucidating the molecular mechanisms underlying F. graminearum resistance and DON detoxification in one of the world’s most important cereal crops.
Additional files
Table S1. List of the selected UGT genes and their primers sequences used for the RT-qPCR expression assay. (XLSX 9 kb)
Figure S1. The abundance of wheat UGT genes as per their amino acid sequence sizes. (JPG 38 kb)
Table S2. List of the Arabidopsis UGT genes used in this study for the identification of the phylogenetic groups. (XLSX 9 kb)
Table S3. The intron information of the wheat UGT genes. (XLSX 35 kb)
Table S4. Expression data of UGT genes in five different tissues at different developmental stages. (XLSX 20 kb)
Table S5. Expression data of UGT genes after F. graminearum inoculation. (XLSX 35 kb)
Acknowledgments
Funding
This work was partially supported by the National Key Project for the Research and Development of China (2016YFE0112900, 2016YFD0100500), China Agricultural Research System Program (CARS-03), National Natural Science Foundation of China (31561143004), Natural Science Foundation of Jiangsu province, China (BK20170605) and European Union Horizon 2020 Mycokey project (EU678781).
Availability of data and materials
The datasets supporting the conclusions of this article are included within the article and its Additional files.
Abbreviations
- DAI
Days after infection
- DON
Deoxynivalenol
- Fg
Fusarium graminearum
- FHB
Fusarium head blight
- GT
Glycosyltransferase enzymes
- PSPG
Plant secondary product glycosyltransferase
- QTL
Quantitative trait loci
- UGT
UDP glycosyltransferases
Authors’ contributions
HM and YH designed the experiments. YH and DA carried out most of the experiments and analyzed the data. XZ, YZ, LW and PJ assisted in analyzing the data. DA, YH and HM wrote the article. All authors read and approved the final manuscript.
Competing interests
The authors declare that they have no competing interests.
Publisher’s Note
Springer Nature remains neutral with regard to jurisdictional claims in published maps and institutional affiliations.
Footnotes
Electronic supplementary material
The online version of this article (10.1186/s12870-018-1286-5) contains supplementary material, which is available to authorized users.
Contributor Information
Yi He, Email: heyi_yihe@163.com.
Dawood Ahmad, Email: dawood@aup.edu.pk.
Xu Zhang, Email: xuzhang@jaas.ac.cn.
Yu Zhang, Email: zhangyu2005.8@163.com.
Lei Wu, Email: wulei686@sina.com.
Peng Jiang, Email: hmjp2005@163.com.
Hongxiang Ma, Email: hongxiangma@163.com.
References
- 1.Kosaka A, Manickavelu A, Kajihara D, Nakagawa H, Ban T. Altered gene expression profiles of wheat genotypes against Fusarium head blight. Toxins. 2015;7(2):604. doi: 10.3390/toxins7020604. [DOI] [PMC free article] [PubMed] [Google Scholar]
- 2.Boutigny AL, Richardforget F, Barreau C. Natural mechanisms for cereal resistance to the accumulation of Fusarium trichothecenes. Eur J Plant Pathol. 2008;121(4):411–423. doi: 10.1007/s10658-007-9266-x. [DOI] [Google Scholar]
- 3.Pestka JJ, Zhou HR, Moon Y, Chung YJ. Cellular and molecular mechanisms for immune modulation by deoxynivalenol and other trichothecenes: unraveling a paradox. Toxicol Lett. 2004;153(1):61–73. doi: 10.1016/j.toxlet.2004.04.023. [DOI] [PubMed] [Google Scholar]
- 4.Bai GH, Desjardins AE, Plattner RD. Deoxynivalenol-nonproducing fusarium graminearum causes initial infection, but does not cause disease spread in wheat spikes. Mycopathologia. 2002;153(2):91–98. doi: 10.1023/A:1014419323550. [DOI] [PubMed] [Google Scholar]
- 5.Ovando-Martinez M, Ozsisli B, Anderson J, Whitney K, Ohm JB, Simsek S. Analysis of deoxynivalenol and deoxynivalenol-3-glucoside in hard red spring wheat inoculated with Fusarium graminearum. Toxins. 2013;5(12):2522–2532. doi: 10.3390/toxins5122522. [DOI] [PMC free article] [PubMed] [Google Scholar]
- 6.Poppenberger B, Berthiller F, Lucyshyn D, Sieberer T, Schuhmacher R, Krska R, Kuchler K, Glossl J, Luschnig C, Adam G. Detoxification of the Fusarium mycotoxin deoxynivalenol by a UDP-glucosyltransferase from Arabidopsis thaliana. J Biol Chem. 2003;278(48):47905–47914. doi: 10.1074/jbc.M307552200. [DOI] [PubMed] [Google Scholar]
- 7.Lemmens M, Scholz U, Berthiller F, Dall'Asta C, Koutnik A, Schuhmacher R, Adam G, Buerstmayr H, Mesterhazy A, Krska R, et al. The ability to detoxify the mycotoxin deoxynivalenol colocalizes with a major quantitative trait locus for Fusarium head blight resistance in wheat. Mol Plant-Microbe Interact. 2005;18(12):1318–1324. doi: 10.1094/MPMI-18-1318. [DOI] [PubMed] [Google Scholar]
- 8.Karlovsky P. Biological detoxification of the mycotoxin deoxynivalenol and its use in genetically engineered crops and feed additives. Appl Microbiol Biotechnol. 2011;91(3):491–504. doi: 10.1007/s00253-011-3401-5. [DOI] [PMC free article] [PubMed] [Google Scholar]
- 9.Vogt T, Jones P. Glycosyltransferases in plant natural product synthesis: characterization of a supergene family. Trends Plant Sci. 2000;5(9):380–386. doi: 10.1016/S1360-1385(00)01720-9. [DOI] [PubMed] [Google Scholar]
- 10.Muir T. Posttranslational modification of proteins: expanding nature's inventory. Angew Chem Int Edit. 2006;7:1623–1624. [Google Scholar]
- 11.Mackenzie PI, Owens IS, Burchell B, Bock KW, Bairoch A, Belanger A, Fournel-Gigleux S, Green M, Hum DW, Iyanagi T, et al. The UDP glycosyltransferase gene superfamily: recommended nomenclature update based on evolutionary divergence. Pharmacogenetics. 1997;7(4):255–269. doi: 10.1097/00008571-199708000-00001. [DOI] [PubMed] [Google Scholar]
- 12.Pasquet JC, Changenet V, Macadre C, Boex-Fontvieille E, Soulhat C, Bouchabke-Coussa O, Dalmais M, Atanasova-Penichon V, Bendahmane A, Saindrenan P, et al. A Brachypodium UDP-glycosyltransferase confers root tolerance to deoxynivalenol and resistance to Fusarium infection. Plant Physiol. 2016;172(1):559–574. doi: 10.1104/pp.16.00371. [DOI] [PMC free article] [PubMed] [Google Scholar]
- 13.Lairson LL, Henrissat B, Davies GJ, Withers SG. Glycosyltransferases: structures, functions, and mechanisms. Annu Rev Biochem. 2008;77:521–555. doi: 10.1146/annurev.biochem.76.061005.092322. [DOI] [PubMed] [Google Scholar]
- 14.Yonekura-Sakakibara K, Hanada K. An evolutionary view of functional diversity in family 1 glycosyltransferases. Plant J. 2011;66(1):182–193. doi: 10.1111/j.1365-313X.2011.04493.x. [DOI] [PubMed] [Google Scholar]
- 15.Huang J, Pang CY, Fan SL, Song MZ, Yu JW, Wei HL, Ma QF, Li LB, Zhang C, Yu SX. Genome-wide analysis of the family 1 glycosyltransferases in cotton. Mol Gen Genomics. 2015;290(5):1805–1818. doi: 10.1007/s00438-015-1040-8. [DOI] [PubMed] [Google Scholar]
- 16.Paquette SM, Jensen K, Bak S. A web-based resource for the Arabidopsis P450, cytochromes b5, NADPH-cytochrome P450 reductases, and family 1 glycosyltransferases. Phytochemistry. 2009;70(17–18):1940–1947. doi: 10.1016/j.phytochem.2009.08.024. [DOI] [PubMed] [Google Scholar]
- 17.Wu BP, Gao LX, Gao J, Xu YY, Liu HR, Cao XM, Zhang B, Chen KS. Genome-wide identification, expression patterns, and functional analysis of UDP glycosyltransferase family in peach (Prunus persica L. Batsch) Front Plant Sci. 2017;8:389. doi: 10.3389/fpls.2017.00389. [DOI] [PMC free article] [PubMed] [Google Scholar]
- 18.Yu J, Fan H, Dossa K, Wang Z, Tao K. Genome-wide analysis of UDP-glycosyltransferase super family in Brassica rapa and Brassica oleracea reveals its evolutionary history and functional characterization. BMC Genomics. 2017;18(1):474. doi: 10.1186/s12864-017-3844-x. [DOI] [PMC free article] [PubMed] [Google Scholar]
- 19.Schweiger W, Pasquet JC, Nussbaumer T, Paris MP, Wiesenberger G, Macadré C, Ametz C, Berthiller F, Lemmens M, Saindrenan P. Functional characterization of two clusters of Brachypodium distachyon UDP-glycosyltransferases encoding putative deoxynivalenol detoxification genes. Mol Plant Microbe In. 2013;26(7):781. doi: 10.1094/MPMI-08-12-0205-R. [DOI] [PubMed] [Google Scholar]
- 20.Barvkar VT, Pardeshi VC, Kale SM, Kadoo NY, Gupta VS. Phylogenomic analysis of UDP glycosyltransferase 1 multigene family in Linum usitatissimum identified genes with varied expression patterns. BMC Genomics. 2012;13:175. doi: 10.1186/1471-2164-13-175. [DOI] [PMC free article] [PubMed] [Google Scholar]
- 21.Caputi L, Malnoy M, Goremykin V, Nikiforova S, Martens S. A genome-wide phylogenetic reconstruction of family 1 UDP-glycosyltransferases revealed the expansion of the family during the adaptation of plants to life on land. Plant J. 2012;69(6):1030. doi: 10.1111/j.1365-313X.2011.04853.x. [DOI] [PubMed] [Google Scholar]
- 22.Li YJ, Li P, Wang Y, Dong RR, Yu HM, Hou BK. Genome-wide identification and phylogenetic analysis of Family-1 UDP glycosyltransferases in maize (Zea mays) Planta. 2014;239(6):1265–1279. doi: 10.1007/s00425-014-2050-1. [DOI] [PubMed] [Google Scholar]
- 23.Lim EK, Baldauf S, Li Y, Elias L, Worrall D, Spencer SP, Jackson RG, Taguchi G, Ross J, Bowles DJ. Evolution of substrate recognition across a multigene family of glycosyltransferases in Arabidopsis. Glycobiology. 2003;13(3):139–145. doi: 10.1093/glycob/cwg017. [DOI] [PubMed] [Google Scholar]
- 24.Taguchi G, Imura H, Maeda Y, Kodaira R, Hayashida N, Shimosaka M, Okazaki M. Purification and characterization of UDP-glucose: hydroxycoumarin 7-O-glucosyltransferase, with broad substrate specificity from tobacco cultured cells. Plant Sci. 2000;157(1):105–112. doi: 10.1016/S0168-9452(00)00270-3. [DOI] [PubMed] [Google Scholar]
- 25.Yonekura-Sakakibara K, Fukushima A, Nakabayashi R, Hanada K, Matsuda F, Sugawara S, Inoue E, Kuromori T, Ito T, Shinozaki K, et al. Two glycosyltransferases involved in anthocyanin modification delineated by transcriptome independent component analysis in Arabidopsis thaliana. Plant J. 2012;69(1):154–167. doi: 10.1111/j.1365-313X.2011.04779.x. [DOI] [PMC free article] [PubMed] [Google Scholar]
- 26.Song C, Zhao S, Hong X, Liu J, Schulenburg K, Schwab W. A UDP-glucosyltransferase functions in both acylphloroglucinol glucoside and anthocyanin biosynthesis in strawberry (Fragaria x ananassa) Plant J. 2016;85(6):730. doi: 10.1111/tpj.13140. [DOI] [PubMed] [Google Scholar]
- 27.Cheng J, Wei GC, Zhou H, Gu C, Vimolmangkang S, Liao L, Han YP. Unraveling the mechanism underlying the glycosylation and methylation of anthocyanins in peach. Plant Physiol. 2014;166(2):1044–1058. doi: 10.1104/pp.114.246876. [DOI] [PMC free article] [PubMed] [Google Scholar]
- 28.Montefiori M, Espley RV, Stevenson D, Cooney J, Datson PM, Saiz A, Atkinson RG, Hellens RP, Allan AC. Identification and characterisation of F3GT1 and F3GGT1, two glycosyltransferases responsible for anthocyanin biosynthesis in red-fleshed kiwifruit (Actinidia chinensis) Plant J. 2011;65(1):106–118. doi: 10.1111/j.1365-313X.2010.04409.x. [DOI] [PubMed] [Google Scholar]
- 29.Schweiger W, Boddu J, Shin S, Poppenberger B, Berthiller F, Lemmens M, Muehlbauer GJ, Adam G. Validation of a candidate deoxynivalenol-inactivating UDP-glucosyltransferase from barley by heterologous expression in yeast. Mol Plant Microbe In. 2010;23(7):977–986. doi: 10.1094/MPMI-23-7-0977. [DOI] [PubMed] [Google Scholar]
- 30.Gardiner SA, Boddu J, Berthiller F, Hametner C, Stupar RM, Adam G, Muehlbauer GJ. Transcriptome analysis of the barley-deoxynivalenol interaction: evidence for a role of glutathione in deoxynivalenol detoxification. Mol Plant Microbe Interact. 2010;23(7):962–976. doi: 10.1094/MPMI-23-7-0962. [DOI] [PubMed] [Google Scholar]
- 31.Shin S, Torres-Acosta JA, Heinen SJ, McCormick S, Lemmens M, Paris MPK, Berthiller F, Adam G, Muehlbauer GJ. Transgenic Arabidopsis thaliana expressing a barley UDP-glucosyltransferase exhibit resistance to the mycotoxin deoxynivalenol. J Exp Bot. 2012;63(13):4731–4740. doi: 10.1093/jxb/ers141. [DOI] [PMC free article] [PubMed] [Google Scholar]
- 32.Li X, Shin S, Heinen S, Dill-Macky R, Berthiller F, Nersesian N, Clemente T, McCormick S, Muehlbauer GJ. Transgenic wheat expressing a barley UDP-glucosyltransferase detoxifies deoxynivalenol and provides high levels of resistance to Fusarium graminearum. Mol Plant Microbe Interact. 2015;28(11):1237–1246. doi: 10.1094/MPMI-03-15-0062-R. [DOI] [PubMed] [Google Scholar]
- 33.Li X, Michlmayr H, Schweiger W, Malachova A, Shin S, Huang YD, Dong YH, Wiesenberger G, McCormick S, Lemmens M, et al. A barley UDP-glucosyltransferase inactivates nivalenol and provides Fusarium head blight resistance in transgenic wheat. J Exp Bot. 2017;68(9):2187–2197. doi: 10.1093/jxb/erx109. [DOI] [PMC free article] [PubMed] [Google Scholar]
- 34.Xing LP, He LQ, Xiao J, Chen QG, Li MH, Shang Y, Zhu YF, Chen PD, Cao AZ, Wang XE. An UDP-glucosyltransferase gene from barley confers disease resistance to Fusarium head blight. Plant Mol Biol Rep. 2017;35(2):224–236. doi: 10.1007/s11105-016-1014-y. [DOI] [Google Scholar]
- 35.Ma X, Du XY, Liu GJ, Yang ZD, Hou WQ, Wang HW, Feng DS, Li AF, Kong LR. Cloning and characterization of a novel UDP-glycosyltransferase gene induced by DON from wheat. J Integr Agr. 2015;14(5):830–838. doi: 10.1016/S2095-3119(14)60857-1. [DOI] [Google Scholar]
- 36.Lin FY, Lu QX, Xu JH, Shi JR. Cloning and expression analysis of two salt and Fusarium graminearum stress associated UDP-glucosyltransferases genes in wheat. Hereditas. 2008;30(12):1608–1614. doi: 10.3724/SP.J.1005.2008.01608. [DOI] [PubMed] [Google Scholar]
- 37.Ma LL, Shang Y, Cao AZ, Qi ZJ, Xing LP, Chen PD, Liu DJ, Wang XE. Molecular cloning and characterization of an up-regulated UDP-glucosyltransferase gene induced by DON from Triticum aestivum L. cv. Wangshuibai. Mol Biol Rep. 2010;37(2):785–795. doi: 10.1007/s11033-009-9606-3. [DOI] [PubMed] [Google Scholar]
- 38.Zhou XH, Wang K, Du LP, Liu YW, Lin ZS, Ye XG. Effects of the wheat UDP-glucosyltransferase gene TaUGT-B2 on agrobacterium-mediated plant transformation. Acta Physiol Plant. 2017;39(1). https://doi.org/10.1007/s11738-016-2317-1.
- 39.Schweiger W, Steiner B, Ametz C, Siegwart G, Wiesenberger G, Berthiller F, Lemmens M, Jia HY, Adam G, Muehlbauer GJ, et al. Transcriptomic characterization of two major Fusarium resistance quantitative trait loci (QTLs), Fhb1 and Qfhs.Ifa-5A, identifies novel candidate genes. Mol Plant Pathol. 2013;14(8):772–785. doi: 10.1111/mpp.12048. [DOI] [PMC free article] [PubMed] [Google Scholar]
- 40.Clavijo BJ, Venturini L, Schudoma C, Accinelli GG, Kaithakottil G, Wright J, Borrill P, Kettleborough G, Heavens D, Chapman H, et al. An improved assembly and annotation of the allohexaploid wheat genome identifies complete families of agronomic genes and provides genomic evidence for chromosomal translocations. Genome Res. 2017;27(5):885–896. doi: 10.1101/gr.217117.116. [DOI] [PMC free article] [PubMed] [Google Scholar]
- 41.Artimo P, Jonnalagedda M, Arnold K, Baratin D, Csardi G, de Castro E, Duvaud S, Flegel V, Fortier A, Gasteiger E, et al. ExPASy: SIB bioinformatics resource portal. Nucleic Acids Res. 2012;40:W597–W603. doi: 10.1093/nar/gks400. [DOI] [PMC free article] [PubMed] [Google Scholar]
- 42.Yu CS, Chen YC, Lu CH, Hwang JK. Prediction of protein subcellular localization. Proteins. 2006;64(3):643–651. doi: 10.1002/prot.21018. [DOI] [PubMed] [Google Scholar]
- 43.Kumar S, Stecher G, Tamura K. MEGA7: molecular evolutionary genetics analysis version 7.0 for bigger datasets. Mol Biol Evol. 2016;33(7):1870–1874. doi: 10.1093/molbev/msw054. [DOI] [PMC free article] [PubMed] [Google Scholar]
- 44.Pingault L, Choulet F, Alberti A, Glover N, Wincker P, Feuillet C, Paux E. Deep transcriptome sequencing provides new insights into the structural and functional organization of the wheat genome. Genome Biol. 2015;16:29. doi: 10.1186/s13059-015-0601-9. [DOI] [PMC free article] [PubMed] [Google Scholar]
- 45.Zhang X, Zhou M, Ren L, Bai G, Ma H, Scholten OE, Guo P, Lu W. Molecular characterization of Fusarium head blight resistance from wheat variety Wangshuibai. Euphytica. 2004;139(1):59–64. doi: 10.1007/s10681-004-2298-9. [DOI] [Google Scholar]
- 46.Livak KJ, Schmittgen TD. Analysis of relative gene expression data using real-time quantitative PCR and the 2(−Delta Delta C(T)) method. Methods. 2012;25(4):402–408. doi: 10.1006/meth.2001.1262. [DOI] [PubMed] [Google Scholar]
- 47.Li Y, Baldauf S, Lim EK, Bowles DJ. Phylogenetic analysis of the UDP-glycosyltransferase multigene family of Arabidopsis thaliana. J Biol Chem. 2001;276(6):4338–4343. doi: 10.1074/jbc.M007447200. [DOI] [PubMed] [Google Scholar]
- 48.Wang J, Hou B. Glycosyltransferases:key players involved in the modification of plant secondary metabolites. Front Biol China. 2009;4(1):39–46. doi: 10.1007/s11515-008-0111-1. [DOI] [Google Scholar]
- 49.Buerstmayr H, Ban T, Anderson JA. QTL mapping and marker-assisted selection for Fusarium head blight resistance in wheat: a review. Plant Breed. 2009;128(1):1–26. doi: 10.1111/j.1439-0523.2008.01550.x. [DOI] [Google Scholar]
- 50.Rogozin IB, Lyons-Weiler J, Koonin EV. Intron sliding in conserved gene families. Trends Genet. 2000;16(10):430–432. doi: 10.1016/S0168-9525(00)02096-5. [DOI] [PubMed] [Google Scholar]
- 51.Latchinian-Sadek L, Ibrahim RK. Flavonol ring B-specific O-glucosyltransferases: purification, production of polyclonal antibodies, and immunolocalization. Arch Biochem Biophys. 1991;289(2):230–236. doi: 10.1016/0003-9861(91)90466-V. [DOI] [PubMed] [Google Scholar]
- 52.Leah JM, Worrall TL, Cobb AH. Isolation and characterisation of two glucosyltransferases from Glycine max associated with bentazone metabolism. Pestic Sci. 1992;34:81–87. doi: 10.1002/ps.2780340112. [DOI] [Google Scholar]
- 53.Yazaki K, Inushima K, Kataoka M, Tabata M. Intracellular-localization of udpg-p-hydroxybenzoate glucosyltransferase and its reaction-product in Lithospermum cell-cultures. Phytochemistry. 1995;38(5):1127–1130. doi: 10.1016/0031-9422(94)00821-A. [DOI] [Google Scholar]
- 54.Anhalt S, Weissenbock G. Subcellular-localization of luteolin glucuronides and related enzymes in rye mesophyll. Planta. 1992;187(1):83–88. doi: 10.1007/BF00201627. [DOI] [PubMed] [Google Scholar]
- 55.Kang Z, Buchenauer H. Immunocytochemical localization of Fusarium toxins in infected wheat spikes by Fusarium culmorum. Physiol Mol Plant P. 1999;55(5):275–288. doi: 10.1006/pmpp.1999.0233. [DOI] [Google Scholar]
Associated Data
This section collects any data citations, data availability statements, or supplementary materials included in this article.
Supplementary Materials
Table S1. List of the selected UGT genes and their primers sequences used for the RT-qPCR expression assay. (XLSX 9 kb)
Figure S1. The abundance of wheat UGT genes as per their amino acid sequence sizes. (JPG 38 kb)
Table S2. List of the Arabidopsis UGT genes used in this study for the identification of the phylogenetic groups. (XLSX 9 kb)
Table S3. The intron information of the wheat UGT genes. (XLSX 35 kb)
Table S4. Expression data of UGT genes in five different tissues at different developmental stages. (XLSX 20 kb)
Table S5. Expression data of UGT genes after F. graminearum inoculation. (XLSX 35 kb)
Data Availability Statement
The datasets supporting the conclusions of this article are included within the article and its Additional files.