Abstract
Background:
Melissa officinalis L. is a well-known medicinal plant from the family Lamiaceae, which is distributed throughout Eastern Mediterranean region and Western Asia.
Objective:
In this study, response surface methodology (RSM) was utilized to optimize the extraction conditions for bioactive compounds from the leaves of M. officinalis L.
Materials and Methods:
A Box–Behnken design (BBD) was utilized to evaluate the effects of three independent variables, namely extraction temperature (°C), methanol concentration (%), and solvent-to-material ratio (mL/g) on the responses of the contents of caffeic acid and rosmarinic acid.
Results:
Regression analysis showed a good fit of the experimental data. The optimal condition was obtained at extraction temperature 80.53°C, methanol concentration 29.89%, and solvent-to-material ratio 30 mL/g.
Conclusion:
These results indicate the suitability of the model employed and the successful application of RSM in optimizing the extraction conditions. This study may be useful for standardizing production quality, including improving the efficiency of large-scale extraction systems.
SUMMARY
The optimum conditions for the extraction of major phenolic acids from the leaves of Melissa officinalis L. were determined using response surface methodology
Box–Behnken design was utilized to evaluate the effects of three independent variables
Quadratic polynomial model provided a satisfactory description of the experimental data
The optimized condition for simultaneous maximum contents of caffeic acid and rosmarinic acid was determined.
Abbreviations used: RSM: Response surface methodology, BBD: Box–Behnken design, CA: Caffeic acid, RA: Rosmarinic acid, HPLC: High-performance liquid chromatography.
Keywords: Box–Behnken design, caffeic acid, Melissa officinalis L., response surface methodology, rosmarinic acid
INTRODUCTION
Melissa officinalis L. (lemon balm) is a perennial herb that belongs to the family Lamiaceae and is found throughout the Eastern Mediterranean region and Western Asia.[1,2] Therapeutic properties of M. officinalis L. are anti-inflammatory,[3] hepatoprotective,[4,5] antioxidant,[6,7,8,9] sedative,[10] anxiolytic,[11] antifungal, anti-bacterial,[12,13] antiviral,[14] antilipidemic, antihistaminic,[15] and antispasmolytic[16] activities, mainly due to the content of essential oils and phenolic acids.[17] In particular, leaves of M. officinalis L. have been used as a medicinal plant for the treatment of headaches, rheumatism, and gastrointestinal disease.[18] In the leaves of M. officinalis L., caffeic acid (CA) and rosmarinic acid (RA) are the representative phenolic acids.[19] CA has antitumor[20,21] and antifungal activities,[22] while RA has antioxidant,[23,24] anti-allergic, and immunosuppressive effects.[25,26] Therefore, the biological activities of phenolic acids from M. officinalis L. have recently been the subject of many studies.[27,28,29]
Extraction is the first important step to recover bioactive compounds from plants for natural product research.[30] Many factors such as extraction temperature,[31] solvent-to-material ratio,[32] extraction time, solvent composition, and extraction pressure,[33] among others, may significantly influence the extraction efficacy. In general, optimization of a process can be determined by an empirical or statistical method. However, empirical methods have the limitations in perfect optimization.[34] Response surface methodology (RSM) is a powerful tool for improving and optimizing extraction process variables.[34,35,36]
MATERIALS AND METHODS
Plant materials
The dried leaves of M. officinalis L. were kindly supplied by Richwood Pharmaceutical Co. Inc. (Seoul, Korea) that also provided a certificate of identity and quality. A voucher specimen (YIPS-MO-160518) was deposited at the Herbarium of College of Pharmacy, Yonsei Institute of Pharmaceutical Sciences, Yonsei University, Incheon, Korea.
Reagents and apparatus
All organic solvents, such as hexane, chloroform, ethyl acetate, methanol, and n-butanol, used for extraction and chromatography were of analytical grade and were purchased from Daesan Chemical (Gyeonggi, Korea). Thin layer chromatography was performed on a precoated silica gel 60 F254 (Merck, NJ, USA). high-performance liquid chromatography (HPLC) was carried out using an Agilent 1260 HPLC system.
High-performance liquid chromatography analysis
Chromatographic separation was carried out on an YMC hydrosphere C18 column (250 mm × 4.6 mm, 5 μm) equipped with a C18 guard column. The mobile phase consisted of acetonitrile (A) and 0.1% phosphoric acid (v/v) (B) at a flow rate of 0.1 mL/min. Analysis was performed using a linear gradient program at the following conditions: 0 min, 10% A and 90% B and 25 min, 90% A and 10% B. Then, the column was reconditioned with 90% B for 5 min. The column temperature was set at 40°C, and the analysis was monitored at 320 nm. Aliquots of 10 μL were injected into the HPLC. Standard working solutions were prepared by serial dilutions of 1.0, 0.5, 0.25, 0.125, and 0.0625 mg/mL and used for calibration curve. Good linearity of calibration curve for CA and RA was achieved with correlation coefficient of 0.999. The powdered leaves of M. officinalis L. (1.00 g) were precisely weighed and extracted with methanol solvent as indicated. Each sample solution was filtered through 0.2 mm membrane filter before being subject to HPLC analysis.
Experimental design
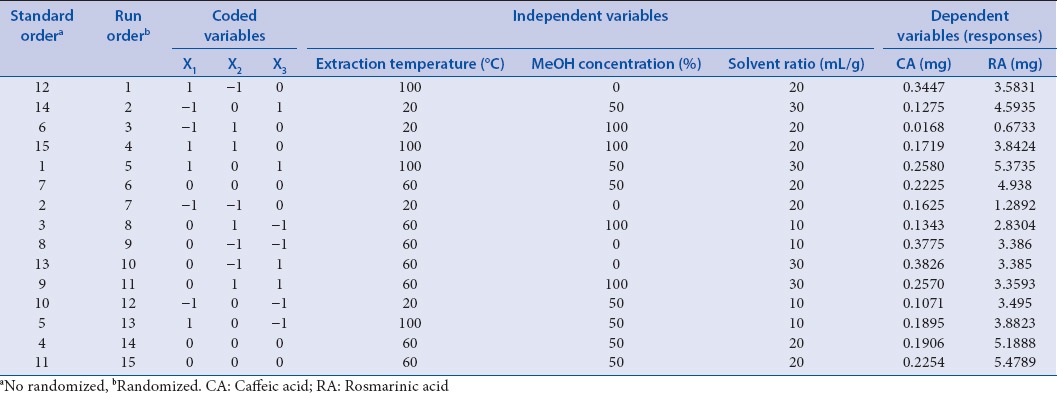
An optimization of extraction conditions for the extraction of CA and RA from the leaves of M. officinalis L. was conducted using RSM. Before conducting the RSM, the levels of RSM-independent variables for phenolic acid extraction were determined based on the preliminary experiments. In brief, 15 experimental runs were conducted with three independent variables, and three levels were developed according to the Box–Behnken design (BBD) as shown in Table 1. BBD has been widely used to experiment with the designing that evaluates nonlinear relationships between response values and factors. Compared with other designs, it has the advantage of reducing the number of experiments.[37] The independent variables were extraction temperature (X1, °C), methanol concentration (X2, %, v/v, methanol/water), and solvent-to-material ratio (X3, mL/g), while the response variable was the amount of phenolic acids from the leaves of M. officinalis L.
Table 1.
Experimental design and responses of the dependent variables to extraction conditions
Statistical analysis
Data were analyzed using the Design Expert 7.0 (Stat-Ease Inc., MN, USA) statistical software. The experimental data were applied to the quadratic polynomial model through which the regression coefficients were obtained. The generalized quadratic polynomial model used for the response surface analysis is shown by the following equation (1):

where Xi and Xj values are independent variables which influence the responses Y; β0, βi, βii, and βij values are the coefficients of regression model for intercept, linear, quadratic, and interaction terms, respectively; and k is the number of variables.
Verification of model
To verify the predictive value of the model, the optimum conditions with the maximum yield for phenolic acid were determined and used in the extraction test. The precision of the fitted model was verified by comparing the predicted value of the experimental value obtained from the three replicates.
RESULTS AND DISCUSSION
Model fitting
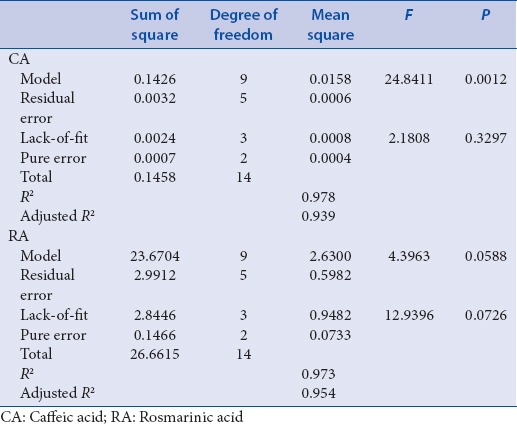
Optimization of the extraction condition was performed by BBD. According to the BBD design, 15 experiments were performed. Extraction temperature (°C), methanol concentration (%), and solvent-to-material ratio (mL/g) were selected as three variables that could potentially affect the contents of CA and RA. Quantitation of CA and RA was performed by HPLC analysis [Figure 1]. As shown in Table 1, the CA and RA contents were varied notably depending on extraction condition [Figure S1]. The analysis of variance (ANOVA) was statistically significant (P < 0.05) and suggested that the variables in the model can explain the experimental variation of CA and RA contents. Coefficient of determination (R2), adjusted R2 (adj R2), and lack-of-fit values are shown in Table 2. The results suggested that the model was suitable for the experimental data.
Figure 1.
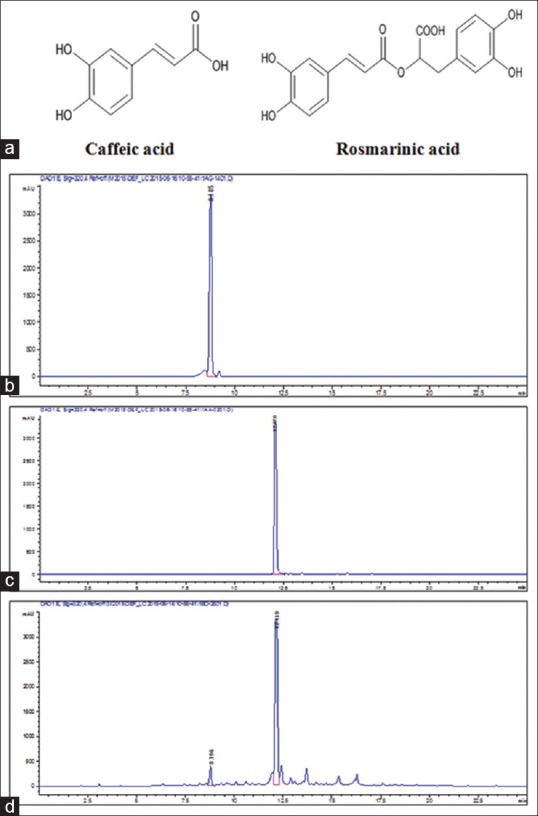
Chemical structures and high-performance liquid chromatography profiles. (a) Chemical structures of caffeic acid and rosmarinic acid, (b) high-performance liquid chromatogram of caffeic acid, (c) high-performance liquid chromatogram of rosmarinic acid, and (d) high-performance liquid chromatograms of Melissa officinalis L. extracts at the optimum conditions
Table 2.
Analysis of variance for the response surface quadratic models
Effect of extraction parameters on the yield of caffeic acid
The relationship between the CA contents and the extraction parameters is explained in the mathematical equation (2) as follows:

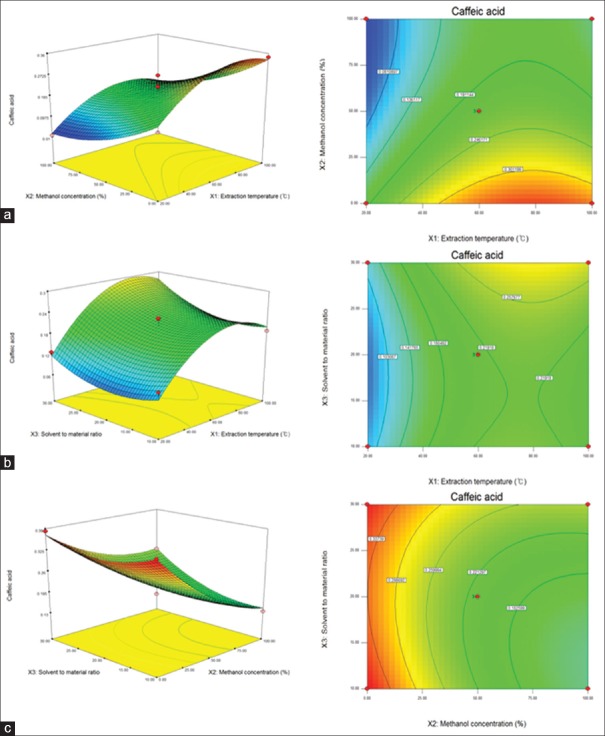
In the models, the linear term of methanol concentration (X2) had the most significant effect (P < 0.01) on CA Contents, followed by the linear term of extraction temperature (X1) [Table 3]. The linear term of solvent-to-material ratio (X3) and quadratic term of X12 and X32 also showed a significant effect (P < 0.05) whereas interaction terms of X1X2, X1X3, and X2X3 were not significant. Table 2 shows the ANOVA of the fitted quadratic polynomial model for CA contents. The fitness of the predicted model for CA contents was verified by f-value of 24.8411 and P = 0.0012. In this response, the R2 was 0.978 and the adj. R2 was 0.939, indicating a high correlation between the observed and predicted values. In addition, P value for lack-of-fit was 0.3297, which is not significant relative to the pure errors. In general, lack-of-fit test for the model is used to verify the adequacy of the model.[38] If the model does not fit well with the data, the lack-of-fit value will be significant, and the incorrect response surface values can be induced.[39] In this study, statistical analysis demonstrated the suitability of predictive and experimental values and the usefulness of a quadratic polynomial model for optimization. To visualize the relationship between the CA contents, which are dependent variables, and the extraction conditions, which are independent variables, we applied a quadratic polynomial model equation to construct three-dimensional (3D) surface plots [Figure 2]. As shown in Figure 2a, when solvent-to-material ratio was fixed at center point (20 mL/g), CA contents was increased slightly by decreasing methanol concentration from 75% to 0% and reached the maximum value at the fixed extraction temperature of 80°C. Figure 2b shows the correlation between the extraction temperature and the solvent-to-material ratio to the CA content at a fixed center point (50%) of the methanol concentration. Maximum CA contents were obtained at the highest solvent-to-material ratio (30 mL/g) and then increased slightly by increasing extraction temperature to 80°C. Figure 2c shows the correlation between methanol concentration and solvent-to-material ratio on the CA contents at a fixed extraction temperature of 60°C. Maximum CA contents were obtained at the lowest methanol concentration at a fixed solvent-to-material ratio of 10 mL/g. As a result, the response surface analysis and statistical analysis showed that the CA contents were significantly increased when the methanol concentration decreased.
Table 3.
Regression coefficients and their significances in the quadratic polynomial regression equations for caffeic acid and rosmarinic acid contents
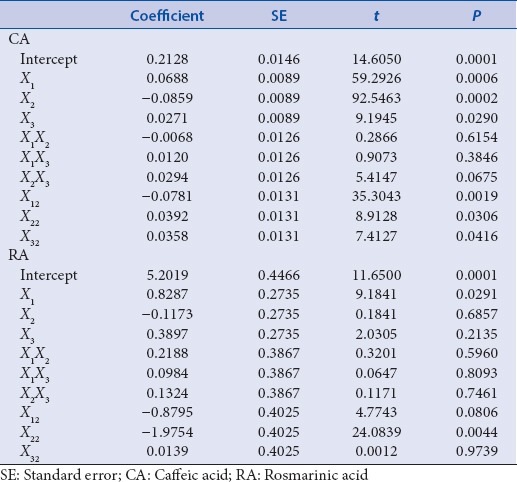
Figure 2.
Response surface plot for the effects of extraction conditions for caffeic acid from the leaves of Melissa officinalis L., (a) extraction temperature and methanol concentration, (b) extraction temperature and solvent-to-material ratio, (c) methanol concentration and solvent-to-material ratio
Effect of extraction parameters on the yield of rosmarinic acid
The relationship between the RA contents and the extraction parameters is explained in mathematical equation (3) as follows:

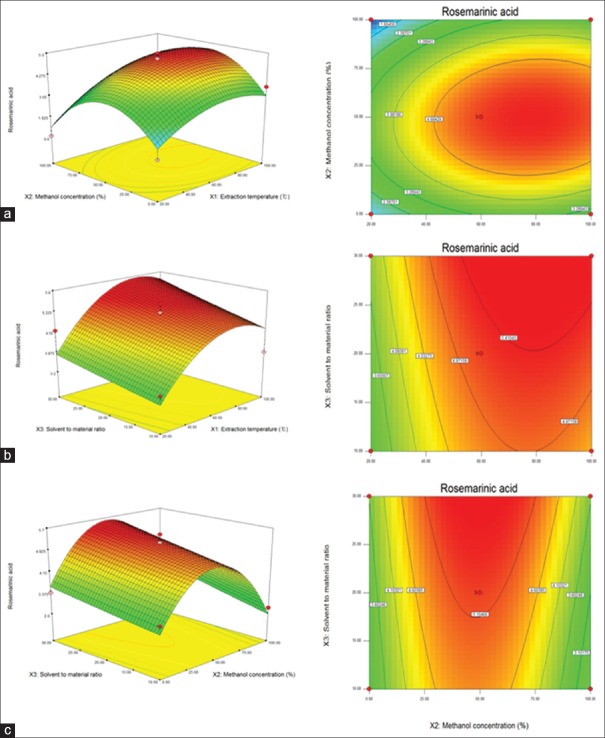
In the models, the quadratic term of methanol concentration (X22) had the most significant effect (P < 0.05) on RA content [Table 3]. The linear term of extraction temperature (X1) also showed a significant effect (P < 0.05). However, the interaction terms X1X2, X1X3, and X2X3 with the other linear terms X2 and X3 and the quadratic terms X12 and X32 did not show a significant effect on RA contents. The fitness of the predicted model for RA contents was verified by f-value of 4.3963 and a P value of 0.0588. In this response, the R2 and the adj. R2 were 0.973 and 0.954, respectively, and P value for lack-of-fit was 0.0726 [Table 2]. These values represent a good match between the experimental and predicted values. To visualize the relationship between the RA contents, which are dependent variables, and the extraction conditions, which are independent variables, we applied a quadratic polynomial model equation to construct 3D surface plots [Figure 3]. As shown in Figure 3a, when solvent-to-material ratio was fixed at the center point (20 mL/g), RA contents were increased by increasing the extracted temperature from 20°C to 78°C and reached the maximum value by increasing methanol concentration from 0% to 49%. Figure 3b shows the correlation between extraction temperature and solvent-to-material ratio on the RA contents at a fixed methanol concentration of 50%. RA contents increased steadily when extraction temperature increased from 20°C to 87°C; however, the RA contents decreased when temperature exceeded 90°C. RA contents also increased when solvent-to-material ratio increased from 10 to 30 mL/g. Figure 3c shows the correlation between methanol concentration and solvent-to-material ratio on the RA contents at a fixed extraction temperature of 60°C. The maximum RA content was obtained at a methanol concentration of 25%–75% and a solvent-to-material ratio of 29.52 mL/g. As a result, the response surface analysis and statistical analysis showed that the RA contents were significantly affected by the methanol concentration, extraction temperature, and solvent-to-material ratio.
Figure 3.
Response surface plot for the effects of extraction conditions for rosmarinic acid from the leaves of Melissa officinalis L., (a) extraction temperature and methanol concentration, (b) extraction temperature and solvent-to-material ratio, (c) methanol concentration and solvent-to-material ratio
Experimental validation of the optimum conditions
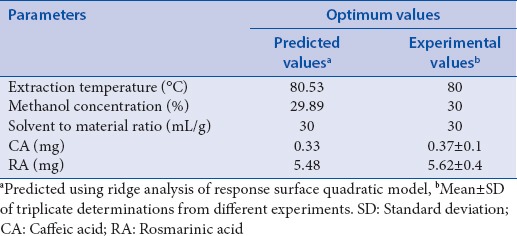
Verification experiments were performed using the recommended optimal conditions derived from RSM [Table 4]. The optimal conditions for both the maximum CA and RA contents were determined at a temperature of 80.53°C, methanol concentration of 29.89%, and solvent-to-material ratio of 30 mL/g. This predicted an extraction of 0.33 mg of CA content and 5.48 mg of RA content. Under the temperature of 80°C, methanol concentration of 30%, and solvent-to-material ratio of 30 mL/g, the observed values were 0.37 ± 0.2 mg of CA content and 5.62 ± 0.4 mg of RA content. These results show that the actual experimental values are in good agreement with the predicted values in the regression model. Hence, the response surface modeling can be applied effectively to the prediction of extraction of major phenolic acids from M. officinalis L. leaves.
Table 4.
Predicted and experimental values of response variables under optimal conditions
CONCLUSION
In this study, RSM was successfully employed to optimize the major phenolic acids extraction from M. officinalis L. leaves. The quadratic polynomial model provided a satisfactory description of the experimental data. These results showed that the optimized conditions with the simultaneous maximum content of CA and RA were determined, and methanol concentration was the most important factor for phenolic acid extraction from M. officinalis L. This study may be useful for standardizing production quality, including improving the efficiency of large-scale extraction systems.
Financial support and sponsorship
Nil.
Conflicts of interest
There are no conflicts of interest.
Acknowledgement
This research was supported by the Ministry of Food and Drug Safety (15172MFDS191), the Republic of Korea.
REFERENCES
- 1.Canadanović-Brunet J, Cetković G, Djilas S, Tumbas V, Bogdanović G, Mandić A, et al. Radical scavenging, antibacterial, and antiproliferative activities of Melissa officinalis L. Extracts. J Med Food. 2008;11:133–43. doi: 10.1089/jmf.2007.580. [DOI] [PubMed] [Google Scholar]
- 2.Kazemi M, Esmaili F. Volatile constituents of essential oils isolated from flowers and leaves of M. officinalis L. J Biol Environ Sci. 2014;823:111–3. [Google Scholar]
- 3.Patora J, Klimek B. Flavonoids from lemon balm (Melissa officinalis L. Lamiaceae) Acta Pol Pharm. 2002;59:139–43. [PubMed] [Google Scholar]
- 4.Bolkent S, Yanardag R, Karabulut-Bulan O, Yesilyaprak B. Protective role of Melissa officinalis L. Extract on liver of hyperlipidemic rats: A morphological and biochemical study. J Ethnopharmacol. 2005;99:391–8. doi: 10.1016/j.jep.2005.02.038. [DOI] [PubMed] [Google Scholar]
- 5.Encalada MA, Hoyos KM, Rehecho S, Berasategi I, de Ciriano MG, Ansorena D, et al. Anti-proliferative effect of Melissa officinalis on human colon cancer cell line. Plant Foods Hum Nutr. 2011;66:328–34. doi: 10.1007/s11130-011-0256-y. [DOI] [PubMed] [Google Scholar]
- 6.Dastmalchi K, Dorman HD, Oinonen PP, Darwis Y, Laakso I, Hiltunen R. Chemical composition and in vitro antioxidative activity of a lemon balm (Melissa officinalis L.) extract. Food Sci Technol. 2008;413:391–400. [Google Scholar]
- 7.Pereira RP, Fachinetto R, de Souza Prestes A, Puntel RL, Santos da Silva GN, Heinzmann BM, et al. Antioxidant effects of different extracts from Melissa officinalis, Matricaria recutita and Cymbopogon citratus. Neurochem Res. 2009;34:973–83. doi: 10.1007/s11064-008-9861-z. [DOI] [PubMed] [Google Scholar]
- 8.Ribeiro M, Bernardo-Gil M, Esquıvel M. Melissa officinalis, L.: Study of antioxidant activity in supercritical residues. J Supercrit. 2001;211:51–60. [Google Scholar]
- 9.Kamdem JP, Adeniran A, Boligon AA, Klimaczewski CV, Elekofehinti OO, Hassan W, et al. Antioxidant activity, genotoxicity and cytotoxicity evaluation of lemon balm (Melissa officinalis L.) ethanolic extract: Its potential role in neuroprotection. Ind Crops Prod. 2013;51:26–34. [Google Scholar]
- 10.Cases J, Ibarra A, Feuillère N, Roller M, Sukkar SG. Pilot trial of Melissa officinalis L. Leaf extract in the treatment of volunteers suffering from mild-to-moderate anxiety disorders and sleep disturbances. Med J Nutrition Metab. 2011;4:211–8. doi: 10.1007/s12349-010-0045-4. [DOI] [PMC free article] [PubMed] [Google Scholar]
- 11.Kennedy DO, Little W, Haskell CF, Scholey AB. Anxiolytic effects of a combination of Melissa officinalis and Valeriana officinalis during laboratory induced stress. Phytother Res. 2006;20:96–102. doi: 10.1002/ptr.1787. [DOI] [PubMed] [Google Scholar]
- 12.Mimica-Dukic N, Bozin B, Sokovic M, Simin N. Antimicrobial and antioxidant activities of Melissa officinalis L. (Lamiaceae) essential oil. J Agric Food Chem. 2004;52:2485–9. doi: 10.1021/jf030698a. [DOI] [PubMed] [Google Scholar]
- 13.Stanojevic D, Comic L, Stefanovic O, Sukdolak SS. In vitro synergistic antibacterial activity of Melissa officinalis L. and some preservatives. Span J Agic Res. 2010;81:109–15. [Google Scholar]
- 14.Allahverdiyev A, Duran N, Ozguven M, Koltas S. Antiviral activity of the volatile oils of Melissa officinalis L. against herpes simplex virus type-2. Phytomedicine. 2004;11:657–61. doi: 10.1016/j.phymed.2003.07.014. [DOI] [PubMed] [Google Scholar]
- 15.Birdane Y, Buyukokuroglu M, Birdane F, Cemek M, Yavuz H. Anti-inflammatory and antinociceptive effects of Melissa officinalis L. in rodents. Rev Med Vet. 2007;15802:75–81. [Google Scholar]
- 16.Kennedy DO, Scholey AB, Wesnes KA. Dose-dependent changes in mood and cognitive performance following single doses of lemon balm (Melissa officinalis) to healthy young adults. FACT. 2002;71:109–10. [Google Scholar]
- 17.Petersen M, Simmonds MS. Rosmarinic acid. Phytochemistry. 2003;62:121–5. doi: 10.1016/s0031-9422(02)00513-7. [DOI] [PubMed] [Google Scholar]
- 18.Smith MA, Perry G, Pryor WA. Causes and consequences of oxidative stress in Alzheimer's disease 1, 2. Free Radic Biol Med. 2002;3211:1049. doi: 10.1016/s0891-5849(02)00793-1. [DOI] [PubMed] [Google Scholar]
- 19.Scarpati M. Isolation and constitution of rosmarinic acid from Rosmarinus officinalis. Ric Sci. 1958;28:2329–33. [Google Scholar]
- 20.Chlabicz J, Paszkiewicz Gadek A, Grochowska K, Galasinksi W. Substances of plant origin with anticipated cytostatic and oncostatic activity inhibit protein biosynthesis. Herb Hung. 1991;303:61–71. [Google Scholar]
- 21.Herodež ŠS, Hadolin M, Škerget M, Knez Ž. Solvent extraction study of antioxidants from Balm (Melissa officinalis L.) leaves. Food Chem. 2003;802:275–82. [Google Scholar]
- 22.Ravn H, Andary C, Kovács G, Mølgaard P. Caffeic acid esters as in vitro inhibitors of plant pathogenic bacteria and fungi. Biochem Syst Ecol. 1989;173:175–84. [Google Scholar]
- 23.Erkan N, Ayranci G, Ayranci E. Antioxidant activities of rosemary (Rosmarinus officinalis L.) extract, blackseed (Nigella sativa L.) essential oil, carnosic acid, rosmarinic acid and sesamol. Food Chem. 2008;110:76–82. doi: 10.1016/j.foodchem.2008.01.058. [DOI] [PubMed] [Google Scholar]
- 24.Tepe B, Eminagaoglu O, Akpulat HA, Aydin E. Antioxidant potentials and rosmarinic acid levels of the methanolic extracts of Salvia verticillata (L.) subsp. verticillata and S. verticillata (L) subsp amasiaca (Freyn and Bornm.) Bornm Food Chem. 2007;1003:985–9. [Google Scholar]
- 25.Yun SY, Hur YG, Kang MA, Lee J, Ahn C, Won J, et al. Synergistic immunosuppressive effects of rosmarinic acid and rapamycin in vitro and in vivo. Transplantation. 2003;75:1758–60. doi: 10.1097/01.TP.0000063933.12440.50. [DOI] [PubMed] [Google Scholar]
- 26.Tanaka T, Kojima T, Suzui M, Mori H. Chemoprevention of colon carcinogenesis by the natural product of a simple phenolic compound protocatechuic acid: Suppressing effects on tumor development and biomarkers expression of colon tumorigenesis. Cancer Res. 1993;53:3908–13. [PubMed] [Google Scholar]
- 27.Capecka E, Mareczek A, Leja M. Antioxidant activity of fresh and dry herbs of some Lamiaceae species. Food Chem. 2005;932:223–6. [Google Scholar]
- 28.Triantaphyllou K, Blekas G, Boskou D. Antioxidative properties of water extracts obtained from herbs of the species Lamiaceae. Int J Food Sci Nutr. 2001;52:313–7. doi: 10.1080/09637480120057512. [DOI] [PubMed] [Google Scholar]
- 29.Kim S, Yun EJ, Bak JS, Lee H, Lee SJ, Kim CT, et al. Response surface optimised extraction and chromatographic purification of rosmarinic acid from Melissa officinalis leaves. Food Chem. 2010;1212:521–6. [Google Scholar]
- 30.Mahugo Santana C, Sosa Ferrera Z, Esther Torres Padrón M, Juan Santana Rodríguez J. Methodologies for the extraction of phenolic compounds from environmental samples: New approaches. Molecules. 2009;14:298–320. doi: 10.3390/molecules14010298. [DOI] [PMC free article] [PubMed] [Google Scholar]
- 31.Wettasinghe M, Shahidi F. Evening primrose meal: A source of natural antioxidants and scavenger of hydrogen peroxide and oxygen-derived free radicals. J Agric Food Chem. 1999;47:1801–12. doi: 10.1021/jf9810416. [DOI] [PubMed] [Google Scholar]
- 32.Cacace J, Mazza G. Optimization of extraction of anthocyanins from black currants with aqueous ethanol. J Food Sci. 2003;681:240–8. [Google Scholar]
- 33.Cacace J, Mazza G. Extraction of anthocyanins and other phenolics from black currants with sulfured water. J Agric Food Chem. 2002;5021:5939–46. doi: 10.1021/jf025614x. [DOI] [PubMed] [Google Scholar]
- 34.Liyana-Pathirana C, Shahidi F. Optimization of extraction of phenolic compounds from wheat using response surface methodology. Food Chem. 2005;931:47–56. [Google Scholar]
- 35.Youssef El H, Nicolas L, Catherine N, Richard GM. Low cost process for phenolic compounds extraction from cabernet sauvignon grapes (Vitis vinifera L. cv. Cabernet Sauvignon). Optimization by response surface methodology. Food Nutr Sci. 2012;3:89–103. [Google Scholar]
- 36.Zhao LC, Liang J, Li W, Cheng KM, Xia X, Deng X, et al. The use of response surface methodology to optimize the ultrasound-assisted extraction of five anthraquinones from Rheum palmatum L. Molecules. 2011;16:5928–37. doi: 10.3390/molecules16075928. [DOI] [PMC free article] [PubMed] [Google Scholar]
- 37.Bayat Y, Ebrahimi H, Fotouhi-Far F. Optimization of reductive debenzylation of hexabenzylhexaazaisowurtzitane (the key step for synthesis of HNIW) using response surface methodology. Org Process Res Dev. 2012;1611:1733–8. [Google Scholar]
- 38.Umesh Kumar P, Chand K. Application of response surface method as an experimental design to optimize clarification process parameters for sugarcane juice. J Food Process Technol. 2015;6:422. [Google Scholar]
- 39.Lee LS, Lee N, Kim YH, Lee CH, Hong SP, Jeon YW, et al. Optimization of ultrasonic extraction of phenolic antioxidants from green tea using response surface methodology. Molecules. 2013;18:13530–45. doi: 10.3390/molecules181113530. [DOI] [PMC free article] [PubMed] [Google Scholar]


