Abstract
Background
We analysed the haemodynamics of indocyanine green (ICG) in mouse organs and tumours and evaluated responses to anti-angiogenic agents in an allograft tumour mouse model by photoacoustic imaging.
Methods
Thirty-six male mice (aged 10–14 weeks; body weight 20–25 g) were used. Real-time photoacoustic imaging of organs and tumours after intravenous injection of ICG was conducted in mice until 10 min after ICG injection. ICG distribution in tumour tissues was assessed by immunohistochemical staining and observation of ICG-derived fluorescence. Vascular permeability changes induced by the vascular endothelial growth factor (VEGF)-blocking agent VEGF-trap on tumour photoacoustic signals were studied.
Results
The photoacoustic signals in salivary glands and tumours after intravenous injection of iCG (0.604 ± 0.011 and 0.994 ± 0.175 [mean ± standard deviation], respectively) were significantly increased compared with those in the liver, kidney, and great vessel (0.234 ± 0.043, 0.204 ± 0.058 and 0.127 ± 0.040, respectively; p < 0.010). In tumours, the photoacoustic signal increased within 30 s after ICG injection in a dose-dependent manner (r2 = 0.899) and then decreased gradually. ICG was found to extravasate in tumour tissues. In VEGF-trap-treated mice, the photoacoustic signal in the tumour decreased at the early phase before inhibition of tumour growth was detected (0.297 ± 0.052 vs 1.011 ± 0.170 in the control; p < 0.001).
Conclusions
Photoacoustic imaging with ICG administration demonstrated extravasation of ICG in mouse organs and tumours, indicating the potential for early detection of changes in vascular permeability during cancer therapy.
Keywords: Photoacoustic imaging, Indocyanine green, Vascular permeability, Anti-angionenic treatment
Key points
The photoacoustic signal of indocyanine green was increased in tumours
Indocyanine green was found to extravasate in tumour tissues
The photoacoustic signal was derived from extravasated indocyanine green
In VEGF-trap-treated mice, photoacoustic signals decreased before tumour shrinkage
Background
Photoacoustic imaging is an emerging non-invasive optical technology that proved to have potential for cellular and molecular specific visualisation at clinically relevant depths of various organs [1]. As apparatuses for photoacoustic imaging are commercially available only for animal experiments or preclinical studies, a few clinical trials have been undertaken based on the promising results obtained in the former [2]. Some endogenous chromophores present in the body, such as melanin and haemoglobin serve as target optical absorbers for photoacoustic imaging [3]. Moreover, exogenous molecular imaging agents which can be used as contrast agents for various imaging technologies (e.g. metallic nanostructures, carbon nanotubes, and fluorescence dyes) have been found to be applicable to photoacoustic imaging [4].
Indocyanine green (ICG) is a fluorescent cyanine dye used as a medical diagnostic agent for monitoring cardiac and liver function [5, 6]. ICG has also been used as a near-infrared (NIR) chromophore to visualise the target structures of organs during intraoperative microscopy coupled with a charge-coupled device camera, enabling real-time NIR imaging in vivo [7–9]. However, NIR imaging combined with ICG is clinically limited during open or endoscopic surgery due to the limited penetration depth of NIR (3–5 mm) [10]. Although bioluminescence imaging is a non-invasive modality with considerable potential for visualisation in deeper tissues and is widely used in the field of preclinical animal research, those studies have been limited by difficulties in non-invasively monitoring early disease progression in real time with high spatial resolution [11].
In this study, the potential of ICG-enhanced photoacoustic imaging was evaluated using organs and tumour allografts from mice. Moreover, the applicability of photoacoustic imaging coupled with ICG for evaluating changes in tumour vascular permeability associated with anti-angiogenic therapy was examined. The purpose of this study was to analyse the haemodynamics of ICG in mouse organs and tumours and evaluate the tumour response to anti-angiogenic agents by photoacoustic imaging.
Methods
Ethical considerations
All procedures were conducted in accordance with the Fundamental Guidelines for Proper Conduct of Animal Experiment and Related Activities in Academic Research Institutions under the jurisdiction of the of the Ministry of Education, Culture, Sports, Science and Technology of Japan and approved by the Committee on Animal Experimentation of Kanazawa University.
Photoacoustic imaging system
Photoacoustic imaging was carried out with a Vevo LAZR small-animal ultrasound and photoacoustic imaging system (Visualsonics, Toronto, ON, Canada). This machine was composed of an ultrasound system equipped with a laser pulse system and animal measurement box (Fig. 1). To acquire photoacoustic images, a LZ-550 linear-array transducer (256 elements, 40-MHz centre frequency, 27-MHz bandwidth) was used. The transducer was connected to both the ultrasound and laser system, with a pulsed laser beam illuminating the tissue from the probe tip. The tuneable laser in this system supplied 10–20 mJ/pulse across its 680–970-nm wavelength range, with a pulse repetition frequency of 10 Hz. All acquired images were stored on a dedicated purpose computer, a region of interest was placed on the target organ or tumour, and the photoacoustic signals of the region of interest were recorded.
Fig. 1.
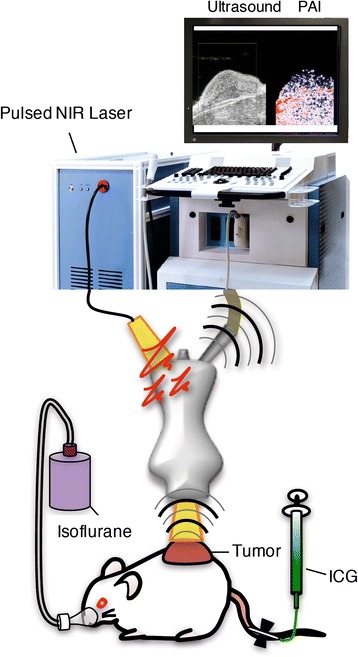
Schematic diagram of the photoacoustic imaging system. Mice were under inhalational anaesthesia (isoflurane, 2% in room air); ICG was injected via the tail vein. The pressure transients produced from chromophores in tissues were scanned by an ultrasound transducer when the tissue was exposed to a pulsed NIR laser
In vitro experiments
To investigate the reliability and quantitative capacity of photoacoustic imaging, in vitro experiments were performed. Three different concentrations of ICG (1, 2.5 and 5 mg/ml Diagnogreen; Daiichi Sankyo, Tokyo, Japan) and saline as a control were imaged on cotton buds and measured using the photoacoustic imaging system.
In vivo animal experiments
For in vivo experiments, C57BL6/J and B6N-Tyrc-Brd/BrdCrCrl albino (SLC, Japan) male mice (aged 10–14 weeks; body weight, 20–25 g) were used. Hair at the examination site was removed with hair removal cream one day before the photoacoustic imaging procedure.
A Lewis lung carcinoma (LLC) cell allograft model was used. Briefly, LLC cells were cultured in minimum essential medium supplemented with 10% foetal bovine serum. At 70–80% confluence, the tumour cells were trypsinised and 1.0 × 10⁷ cells suspended in 100 μL were injected subcutaneously into the backs of the mice under general anaesthesia with pentobarbital (30 mg/kg, intraperitoneally). Subcutaneous tumours were imaged with a photoacoustic imaging system ten days after tumour implantation, when the tumours had reached about 1 cm in maximum diameter.
For anti-vascular endothelial growth factor (VEGF) antibody treatment, mice were injected intraperitoneally with VEGF-trap (Regeneron, Tarrytown, NY, USA and Bayer Health Care, Berlin, Germany) at a concentration of 5 mg/kg ten days after tumour implantation. Photoacoustic imaging was performed three days after VEGF-trap injection. Tumour volumes were monitored every two days after tumour implantation for 20 days (Fig. 2). Tumour size was measured by callipers (length and width) every two days. The tumour volume (V = 1/2 length × width2) was also calculated.
Fig. 2.

Experimental design in a tumour mouse model with anti-VEGF therapy. Each mouse was given one intraperitoneal injection of VEGF-trap ten days after implantation of LLC into the subcutaneous tissue. Photoacoustic imaging was performed after three days and we evaluated the tumour volume 20 days later
Photoacoustic imaging acquisition in mice
For photoacoustic imaging, mice were anesthetised with isoflurane (2.0%) and fixed on a platform. Each target organ was observed by B-mode ultrasound and a favourable position at maximum area coverage was chosen. Before injection of ICG, pre-contrast photoacoustic imaging was performed for 1 min. Next, ICG was injected via the tail vein using a 27-G butterfly needle attached to a disposable microsyringe at an initial rate of 0.02 ml/s using an automatic injector (Fusion Touch, ISIS, Osaka, Japan). Signals of photoacoustic imaging were obtained under the following conditions: 780 nm excitation light; 42-dB photoacoustic gain; 22-dB two-dimensional gain and 5 frames/s. To reduce the effects of respiratory motion, we used a respiratory gate. Photoacoustic signals in the liver, kidney, salivary gland, inferior vena cava and LLC implanted in the skin of mice were collected during the 10-min period after intravenous ICG injection (5 mg/ml) and peak photoacoustic signals were calculated. For semi-quantitative analysis of tumours after ICG injection, three different concentrations of ICG (1, 2.5 and 5 mg/ml) were administered and photoacoustic signals were acquired. For experiments involving VEGF-trap treatment, 5 mg/ml ICG was administered and peak photoacoustic signals were calculated. Photoacoustic signals were acquired during the 10-min period until the signal reached a plateau.
Histology
To visualise the extravasation of ICG in tumour tissues, ICG was injected via the tail vein; 30 s later, vessels were washed with saline under cardiac puncture and drained from the superior vena cava. Tumour tissues were embedded in Optical Cutting Temperature compound (Tissue-Tek, Sakura Finetek). Cryosections (10 μm) were stained with anti-CD31 antibodies (1:400; cat. no. 550274; BD) overnight at 4 °C and incubated with Alexa Fluor 488-conjugated secondary antibodies (A11034; Molecular Probes, Eugene, OR, USA) for 1 h at room temperature. Cell nuclei were counterstained with 4′,6-diamidino-2-phenylindole (cat. no. D1306; Molecular Probes). Samples were imaged using an inverted microscope (model IX70; Olympus, Tokyo, Japan) equipped with an ORCA-Flash4.0 digital CMOS camera (Hamamatsu Photonics), configured with a ICG-filter set (ICG-B-U02; Semrock) or with confocal laser microscopy, as previously described [12].
Statistical analysis
Statistical analysis and graphical display of data were performed using GraphPad software (version 7.00 for Mac; GraphPad Software, San Diego, CA, USA). All values are reported as mean ± standard deviation (SD). One-way analysis of variance with post-hoc Tukey test was used to compare photoacoustic signals among groups. Correlation analysis between photoacoustic signals and ICG concentrations in vitro experiments and between photoacoustic signals in tumours and ICG concentrations in the animal experiment was performed using Pearson’s correlation analysis. Two-tailed unpaired t-tests were used to compare photoacoustic signals and tumour volumes between the control and anti-VEGF therapy groups. Results with p values < 0.050 were considered as statistically significant.
Results
In vitro experiment
Cotton swabs presoaked with three different concentrations of ICG provided dose-dependent increases in photoacoustic signals (Fig. 3a), demonstrating a linear relationship between the ICG dose and the photoacoustic signal intensity (r2 = 0.970; Fig. 3b, Table 1).
Fig. 3.
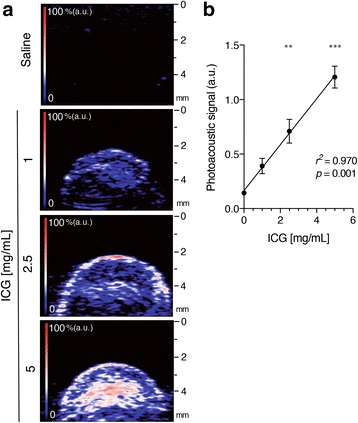
In vitro photoacoustic imaging of ICG. a Representative images showing a map of optical absorption from ICG in cotton swabs soaked with the indicated concentrations of ICG (0, 1, 2.5 and 5 mg/ml). Brighter signals in the photoacoustic imaging map corresponded to higher optical absorption of ICG chromophores. The colour map has red graduation that fades into blue (n = 4). b Graph showing the linear relationship between the mean peak photoacoustic signal (mean ± SD) and ICG dose. The regression line shows a significant correlation with an r2 value of 0.970 (n = 4)
Table 1.
ICG-derived photoacoustic on different concentration
| ICG concentration (mg/ml) | Photoacoustic signal (a.u.) |
|---|---|
| 0.0 | 0.143 ± 0.014 |
| 1.0 | 0.391 ± 0.070 |
| 2.5 | 0.710 ± 0.109a |
| 5.0 | 1.206 ± 0.101b |
Data are means ± SD. a.u. = arbitrary units
aSignificant difference compared to ICG concentration 1.0 mg/ml (p < 0.010)
bSignificant difference compared to ICG concentration 1.0 and 2.5 mg/ml (p < 0.001)
ICG-photoacoustic imaging in mice
In all examined organs photoacoustic signals rapidly increased after ICG injection and peaked within approximately 30 s, followed by gradual decay (Fig. 4a). The quantification of the peak photoacoustic signals demonstrated that the photoacoustic signal in tumours was significantly higher than those in the salivary gland, liver and kidney in ICG-injected mice (Fig. 4b, Table 2). The photoacoustic signal in the blood-filled inferior vena cava was weaker than that in other organs, whereas tumours exhibited the highest photoacoustic signals (Fig. 4b).
Fig. 4.
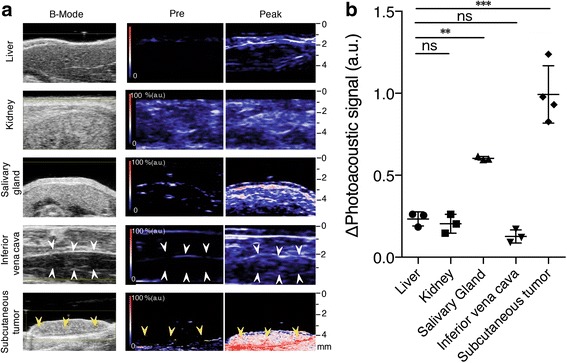
Photoacoustic imaging with various organs and allograft tumours in mouse skin. a Representative co-registered ultrasound B-mode and photoacoustic imaging of various organs (liver, kidney, salivary gland and inferior vena cava) and subcutaneous Lewis lung carcinoma (LLC) allograft tumour in mice 30 s after intravenous injection of ICG (5 mg/ml). White arrow-head: blood vessel, yellow arrow head: subcutaneous LLC tumour burden with strong photoacoustic signal. b Graph showing the maximum photoacoustic signal (mean and SD) of organs and subcutaneous LLC tumours in mice after intravenous injection of ICG (5 mg/ml; n = 3 or 4). ns not significant. **Significant difference compared with the liver, kidney and inferior vena cava. ***Significant difference compared with the liver, kidney, inferior vena cava and salivary gland
Table 2.
ICG-enhanced photoacoustic signals in organs and tumours
| Signal increase (a.u.) | |
|---|---|
| Liver | 0.234 ± 0.043 |
| Kidney | 0.204 ± 0.058 |
| Salivary gland | 0.604 ± 0.011a |
| Inferior vena cava | 0.127 ± 0.040 |
| Tumour | 0.994 ± 0.175b |
Data are means ± SD. a.u. = arbitrary units
aSignificant difference compared with liver, kidney and inferior vena cava (p < 0.010 [to liver and kidney], p < 0.001 [to IVC])
bSignificant difference compared to liver, kidney, salivary gland and inferior vena cava (p < 0.010 [to salivary gland], p < 0.001 [to liver, kidney and inferior vena cava])
Enhanced ICG-injection-induced photoacoustic signals in tumours
B-mode photoacoustic imaging showed increases in photoacoustic signals diffusely within tumours after ICG injection (Fig. 5a). The photoacoustic signals in tumours appeared to be inhomogeneous and granular. Quantitatively, the photoacoustic signal immediately rose just after ICG injection, reaching a peak by 30 s, and then showed a gradual decline (Fig. 5b and c). The increase in photoacoustic signal after ICG injection was clearly dependent on the amount of ICG injected (r2 = 0.899; Fig. 5b and c, Table 3).
Fig. 5.
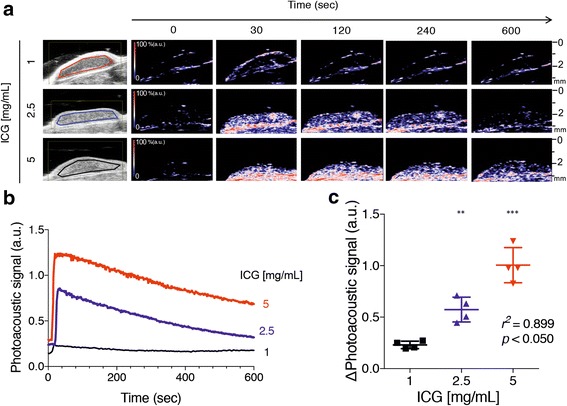
Photoacoustic imaging of ICG dynamics in subcutaneous mouse tumours. a Representative images of co-registered ultrasound B-mode and photoacoustic imaging showing the LLC tumour at different times after intravenous injection of the indicated ICG dose (1, 2.5 and 5 mg/ml). b Trace graph showing serial measurements of photoacoustic imaging in subcutaneous LLC tumours after intravenous injection of different ICG doses (1, 2.5 and 5 mg/ml; n = 4). c Graph showing the maximum photoacoustic signals (mean and SD) of subcutaneous LLC tumours in mice (n = 4). **p < 0.010, ***p < 0.001
Table 3.
ICG-enhanced photoacoustic signals of tumours at different concentrations
| ICG concentration (mg/ml) | Signal increase (a.u.) |
|---|---|
| 1.0 | 0.231 ± 0.036 |
| 2.5 | 0.574 ± 0.120a |
| 5.0 | 1.005 ± 0.171b |
Data are means ± SD. a.u.= arbitrary units
aSignificant difference compared with ICG concentration 1.0 mg/ml (p < 0.010)
bSignificant difference compared with ICG concentration 1.0 and 2.5 mg/ml (p < 0.001 [to 1.0], p < 0.010 [to 2.5])
On histopathological examination, extravascular leakage of ICG was observed in the interstitial space outside the vascular lumen lined by CD31-positive vascular endothelium in tumours (Fig. 6a). Extravascular ICG was greater in mice injected with a high dose of ICG compared with that in mice injected with low and medium doses of ICG (Fig. 6a). Moreover, the cells in the extravascular space, most likely tumour cells, appeared to take up and accumulate ICG within cells, as observed with a confocal laser microscope (Fig. 6b).
Fig. 6.
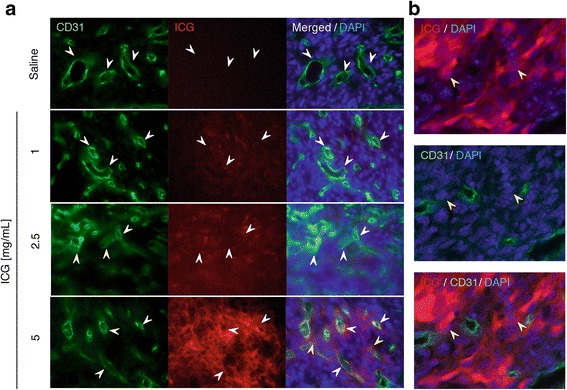
Extravasation of ICG into the interstitial space surrounding tumour vasculature. a Immunofluorescence staining (original magnification, 40×) of LLC tumour sections demonstrating ICG accumulation at different doses (1, 2.5 and 5 mg/ml; pseudo-red colour) surrounding CD31+ tumour capillaries (green, white arrowheads) of LLC tumours 30 s after intravenous administration. Nuclei were counterstained with 4′,6-diamidino-2-phenylindole (blue). Scale bar: 20 μm. b Confocal fluorescence imaging of LLC tumour sections (original magnification, 60×). Note that ICG (5 mg/ml) was distributed extensively in the tumour cells, but not in CD31+ tumour capillaries (yellow arrowheads)
Normalisation of ICG-photoacoustic signals in tumours by a VEGF-blocking agent
A single administration of VEGF-trap dramatically decreased ICG-photoacoustic signals on day 13 compared with saline administration (Fig. 7a and 7b, Table 4), although VEGF-trap did not alter tumour volumes at that time point (Fig. 7c). Administration of VEGF-trap caused a decrease in the tumour volume from day 16 (six days after VEGF-trap administration) and induced an approximate 80% reduction in tumour volume on day 20 compared with saline administration (Fig. 7c, Table 4), confirming the anti-tumour effects of VEGF-trap.
Fig. 7.
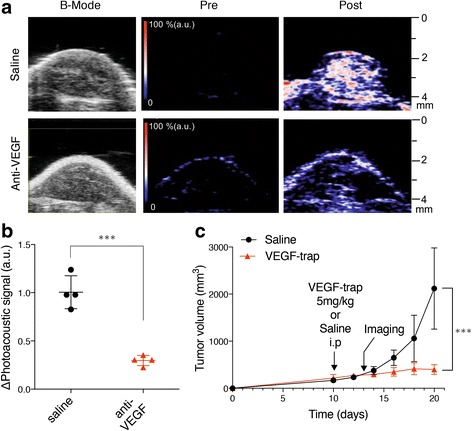
Normalisation of ICG-photoacoustic signals in tumours with a VEGF-blocking agent. a Representative photoacoustic imaging with B-mode images show prevention of ICG vascular leakage in subcutaneous LLC tumours with anti-VEGF therapy. The colour map has red gradation that fades into blue (n = 4, ICG: 5 mg/ml). b Graph showing maximum photoacoustic signal values of subcutaneous LLC tumours with or without anti-VEGF therapy (p < 0.001; n = 4, ICG: 5 mg/ml). c Growth curves of subcutaneous LLC tumours in mice treated with control saline (black circle) and VEGF-trap (red triangle, 5 mg/kg). Data shown are means ± SD. Treatment and imaging schedules are indicated with arrows (n = 4, ICG 5 mg/ml). ***p < 0.001
Table 4.
ICG-enhanced photoacoustic signals of tumours and changes in tumour volumes with anti-VEGF therapy
| Signal increase (a.u.) | Tumour volume on day 20 (mm3) | |
|---|---|---|
| Saline | 1.011 ± 0.170 | 2117.680 ± 864.375 |
| Anti-VEGF | 0.297 ± 0.052a | 397.753 ± 102.773a |
Data are means ± SD. a.u.= arbitrary units
aSignificant difference compared to control (p < 0.001)
Discussion
This study showed that photoacoustic imaging with ICG administration could be used to evaluate ICG extravasation in tumours and facilitate the early detection of changes in vascular permeability during cancer therapy. The use of the photoacoustic imaging system enabled safe and real-time image acquisition to convey underlying pathologic information for the target tissue without radiation exposure.
Some experimental studies and preclinical studies using photoacoustic imaging have been reported, including non-invasive imaging of the breast, sentinel lymph nodes and skin [13–16]. However, photoacoustic imaging is still limited by its inability to non-invasively characterise tumour development in the preclinical and clinical settings. To date, ICG is thought to be a suitable exogenous molecular imaging agent for photoacoustic imaging. ICG accumulation in sentinel lymph nodes, breast cancer and liver tumours, such as hepatocellular carcinoma, cholangiocarcinoma and metastatic liver tumours, has previously been visualised by photoacoustic imaging [17]. However, most studies have relied on static measurements, thus lacking dynamic information. Non-invasive dynamic photoacoustic imaging of acute changes in ICG signals after intravenous injection has not been extensively investigated.
In our study, we clarified that ICG can be used as a contrast agent for non-invasive dynamic photoacoustic imaging in a mouse model. Importantly, transient ICG signals in photoacoustic imaging are thought to originate from the extravascular space. Of the various organs tested in this study, photoacoustic signals from tumours and salivary glands showed the strongest peak just after injection. In contrast, the inferior vena cava, including the large intravascular space with flowing blood, did not show any clear increase in ICG signals. This suggested that the ICG signal observed during the early phase after administration was mainly derived from the extravascular space, not the intravascular space with our photoacoustic settings. This observation was supported by data showing that salivary glands containing hyperpermeable fenestrated capillaries revealed a higher photoacoustic signal intensity than other normal organs [18].
ICG diffuses into the systemic vasculature and the ICG bound to albumin is then exclusively metabolised and cleared by the liver at a half-life of about 5 min [19]. However, the dynamics of ICG in the acute phase of photoacoustic have not been elucidated. In this study, in the vascular space, the target agent may shuffle and pass quickly out through the observation window, making it difficult to obtain the signal. The photoacoustic signal of ICG was higher in tumours than in other organs, such as the liver and kidney. ICG rapidly binds to albumin (molecular weight ~ 60 kDa) in plasma [20]. Such macromolecules with a molecular weight > 20 kDa are not able to permeate the endothelium of normal organs. In contrast, tumour microvessels with discontinuous endothelium enable larger molecules (> 50 kDa) to extravasate into the interstitial space [21, 22]. The photoacoustic signal of ICG reflects extravasation of ICG-bound albumin accumulation into the extravascular space, followed by vascular hyperpermeability in tumours. To directly confirm ICG extravasation into the interstitial space, we performed immunohistochemical analysis of tumour sections. Immunofluorescence staining of tumour microvessels with anti-CD31 antibodies revealed that ICG accumulated not only in the interstitial space but also in tumour cells. Consistent with our observations, Onda et al. [23] recently demonstrated that intravenously administered ICG was passively internalised by the endocytic activity of tumour cells and entrapped in the membrane trafficking system, resulting in its slow turnover and prolonged retention by tumours.
The objective tumour response has been used as an important endpoint for assessment of the therapeutic effects of cancer therapy. With molecular targeted drugs, including VEGF inhibitors, tumour shrinkage is delayed and tumour cells may disappear without any reduction in the tumour volume. When using molecular targeted drugs, downregulation of VEGF, normalisation of the tumour vasculature, pruning of excess vessels and reduction of interstitial fluid pressure and vessel permeability occur in the tumour consecutively [24–29]. In this study, photoacoustic imaging coupled with ICG revealed that VEGF-trap effects could be predicted in terms of tumour permeability before tumour shrinkage by VEGF-trap therapy.
In conclusion, we found that photoacoustic imaging with ICG administration demonstrated extravasation of ICG in mouse organs and tumours, indicating the potential for early detection of changes in vascular permeability during cancer therapy.
Acknowledgements
The authors thank the staff of Institute for Experimental Animals at Kanazawa University for their technical assistance for performing our studies.
Funding
This work was supported by JSPS KAKENHI Grant Number JP16K19812.
Availability of data and materials
Not applicable.
Abbreviations
- ICG
Indocyanine green
- LLC
Lewis lung carcinoma
- NIR
Near-infrared
- VEGF
Vascular endothelial growth factor
Authors’ contributions
Study concept: KO, KY, KY, AS, SK, YT, TG; data acquisition: KO, KY, KY, AS, TO, TM, WK; statistical analysis: KO, YN, DI, AK, SK; manuscript preparation: KO, KY, KY, AS, KK, YT, TG. All authors read and approved the final manuscript.
Ethics approval
This animal experimental study was performed with protocols approved by Institutional Animal Care and Use Committee of Kanazawa University.
Consent for publication
Not applicable.
Competing interests
The authors declare that they have no competing interests.
Publisher’s Note
Springer Nature remains neutral with regard to jurisdictional claims in published maps and institutional affiliations.
References
- 1.Zackrisson S, van de Ven SM, Gambhir SS. Light in and sound out: emerging translational strategies for photoacoustic imaging. Cancer Res. 2014;74:979–1004. doi: 10.1158/0008-5472.CAN-13-2387. [DOI] [PMC free article] [PubMed] [Google Scholar]
- 2.Valluru KS, Wilson KE, Willmann JK. Photoacoustic imaging in oncology: translational preclinical and early clinical experience. Radiology. 2016;280:332–349. doi: 10.1148/radiol.16151414. [DOI] [PMC free article] [PubMed] [Google Scholar]
- 3.Bell AG. On the production and reproduction of sound by light. Am J Sci. 1880;20:305–324. doi: 10.2475/ajs.s3-20.118.305. [DOI] [Google Scholar]
- 4.Zhang HF, Maslov K, Stoica G, Wang LV. Functional photoacoustic microscopy for high-resolution and noninvasive in vivo imaging. Nat Biotechnol. 2006;24:848–851. doi: 10.1038/nbt1220. [DOI] [PubMed] [Google Scholar]
- 5.Fox IJ, Brooker LG, Heseltine DW, Essex HE, Wood EH. A tricarbocyanine dye for continuous recording of dilution curves in whole blood independent of variations in blood oxygen saturation. Proc Staff Meet Mayo Clin. 1957;32:478–484. [PubMed] [Google Scholar]
- 6.Caesar J, Shaldon S, Chiandussi L, Guevara L, Sherlock S. The use of indocyanine green in the measurement of hepatic blood flow and as a test of hepatic function. Clin Sci. 1961;21:43–57. [PubMed] [Google Scholar]
- 7.Ishizawa T, Fukushima N, Shibahara J, Masuda K, Tamura S, Aoki T, et al. Real-time identification of liver cancers by using indocyanine green fluorescent imaging. Cancer. 2009;115:2491–2504. doi: 10.1002/cncr.24291. [DOI] [PubMed] [Google Scholar]
- 8.Martirosyan NL, Cavalcanti DD, Eschbacher JM, Delany PM, Scheck AC, Abdelwahab MG, et al. Use of in vivo near-infrared laser confocal endomicroscopy with indocyanine green to detect the boundary of infiltrative tumor. J Neurosurg. 2011;115:1131–1138. doi: 10.3171/2011.8.JNS11559. [DOI] [PubMed] [Google Scholar]
- 9.Tummers QR, Hoogstins CE, Peters AA, de Kroon CD, Trimbos JB, van de Velde CJ, et al. The value of intraoperative near-infrared fluorescence imaging based on enhanced permeability and retention of indocyanine green: feasibility and false-positives in ovarian cancer. PLoS One. 2015;10:e0129766. doi: 10.1371/journal.pone.0129766. [DOI] [PMC free article] [PubMed] [Google Scholar]
- 10.Alander JT, Kaartinen I, Laakso A, Patila T, Spillmann T, Tuchin VV, et al. A review of indocyanine green fluorescent imaging in surgery. Int J Biomed Imaging. 2012;2012:940585. doi: 10.1155/2012/940585. [DOI] [PMC free article] [PubMed] [Google Scholar]
- 11.Close DM, Xu T, Sayler GS, Ripp S. In vivo bioluminescent imaging (BLI): noninvasive visualization and interrogation of biological processes in living animals. Sensors (Basel) 2011;11:180–206. doi: 10.3390/s110100180. [DOI] [PMC free article] [PubMed] [Google Scholar]
- 12.Yoshioka K, Yoshida K, Cui H, Wakayama T, Takuwa N, Okamoto Y, et al. Endothelial PI3K-C2alpha, a class II PI3K, has an essential role in angiogenesis and vascular barrier function. Nat Med. 2012;18:1560–1569. doi: 10.1038/nm.2928. [DOI] [PubMed] [Google Scholar]
- 13.Heijblom M, Piras D, Brinkhuis M, van Hespen JC, van den Engh FM, van der Schaaf M, et al. Photoacoustic image patterns of breast carcinoma and comparisons with magnetic resonance imaging and vascular stained histopathology. Sci Rep. 2015;5:11778. doi: 10.1038/srep11778. [DOI] [PMC free article] [PubMed] [Google Scholar]
- 14.Mehrmohammadi M, Yoon SJ, Yeager D, Emelianov SY. Photoacoustic imaging for cancer detection and staging. Curr Mol Imaging. 2013;2:89–105. doi: 10.2174/2211555211302010010. [DOI] [PMC free article] [PubMed] [Google Scholar]
- 15.Erpelding TN, Kim C, Pramanik M, Jankovic L, Maslov K, Guo Z, et al. Sentinel lymph nodes in the rat: noninvasive photoacoustic and US imaging with a clinical US system. Radiology. 2010;256:102–110. doi: 10.1148/radiol.10091772. [DOI] [PMC free article] [PubMed] [Google Scholar]
- 16.Kim C, Song KH, Gao F, Wang LV. Sentinel lymph nodes and lymphatic vessels: noninvasive dual-modality in vivo mapping by using indocyanine green in rats--volumetric spectroscopic photoacoustic imaging and planar fluorescence imaging. Radiology. 2010;255:442–450. doi: 10.1148/radiol.10090281. [DOI] [PMC free article] [PubMed] [Google Scholar]
- 17.Miyata A, Ishizawa T, Kamiya M, Shimizu A, Kaneko J, Ijichi H, et al. Photoacoustic tomography of human hepatic malignancies using intraoperative indocyanine green fluorescence imaging. PLoS One. 2014;9:e112667. doi: 10.1371/journal.pone.0112667. [DOI] [PMC free article] [PubMed] [Google Scholar]
- 18.Mann GE, Smaje LH, Yudilevich DL. Permeability of the fenestrated capillaries in the cat submandibular gland to lipid-insoluble molecules. J Physiol. 1979;297:335–354. doi: 10.1113/jphysiol.1979.sp013043. [DOI] [PMC free article] [PubMed] [Google Scholar]
- 19.Cherrick GR, Stein SW, Leevy CM, Davidson CS. Indocyanine green: observations on its physical properties, plasma decay, and hepatic extraction. J Clin Invest. 1960;39:592–600. doi: 10.1172/JCI104072. [DOI] [PMC free article] [PubMed] [Google Scholar]
- 20.Jacob M, Conzen P, Finsterer U, Krafft A, Becker BF, Rehm M. Technical and physiological background of plasma volume measurement with indocyanine green: a clarification of misunderstandings. J Appl Physiol (1985) 2007;102:1235–1242. doi: 10.1152/japplphysiol.00740.2006. [DOI] [PubMed] [Google Scholar]
- 21.Dreher MR, Liu W, Michelich CR, Dewhirst MW, Yuan F, Chilkoti A. Tumor vascular permeability, accumulation, and penetration of macromolecular drug carriers. J Natl Cancer Inst. 2006;98:335–344. doi: 10.1093/jnci/djj070. [DOI] [PubMed] [Google Scholar]
- 22.Reitan NK, Thuen M, Goa PE, de Lange DC. Characterization of tumor microvascular structure and permeability: comparison between magnetic resonance imaging and intravital confocal imaging. J Biomed Opt. 2010;15:036004. doi: 10.1117/1.3431095. [DOI] [PMC free article] [PubMed] [Google Scholar]
- 23.Onda N, Kimura M, Yoshida T, Shibutani M. Preferential tumor cellular uptake and retention of indocyanine green for in vivo tumor imaging. Int J Cancer. 2016;139:673–682. doi: 10.1002/ijc.30102. [DOI] [PubMed] [Google Scholar]
- 24.Cesca M, Bizzaro F, Zucchetti M, Giavazzi R. Tumor delivery of chemotherapy combined with inhibitors of angiogenesis and vascular targeting agents. Front Oncol. 2013;3:259. doi: 10.3389/fonc.2013.00259. [DOI] [PMC free article] [PubMed] [Google Scholar]
- 25.Gazit Y, Baish JW, Safabakhsh N, Leunig M, Baxter LT, Jain RK. Fractal characteristics of tumor vascular architecture during tumor growth and regression. Microcirculation. 1997;4:395–402. doi: 10.3109/10739689709146803. [DOI] [PubMed] [Google Scholar]
- 26.Hobbs SK, Monsky WL, Yuan F, Roberts WG, Griffith L, Torchilin VP, et al. Regulation of transport pathways in tumor vessels: role of tumor type and microenvironment. Proc Natl Acad Sci U S A. 1998;95:4607–4612. doi: 10.1073/pnas.95.8.4607. [DOI] [PMC free article] [PubMed] [Google Scholar]
- 27.Inai T, Mancuso M, Hashizume H, Baffert F, Haskell A, Baluk P, et al. Inhibition of vascular endothelial growth factor (VEGF) signaling in cancer causes loss of endothelial fenestrations, regression of tumor vessels, and appearance of basement membrane ghosts. Am J Pathol. 2004;165:35–52. doi: 10.1016/S0002-9440(10)63273-7. [DOI] [PMC free article] [PubMed] [Google Scholar]
- 28.Tong RT, Boucher Y, Kozin SV, Winkler F, Hicklin DJ, Jain RK (2004) Vascular normalization by vascular endothelial growth factor receptor 2 blockade induces a pressure gradient across the vasculature and improves drug penetration in tumors. Cancer Res 64:3731–3736 [DOI] [PubMed]
- 29.Yuan F, Chen Y, Dellian M, Safabakhsh N, Ferrara N, Jain RK. Time-dependent vascular regression and permeability changes in established human tumor xenografts induced by an anti-vascular endothelial growth factor/vascular permeability factor antibody. Proc Natl Acad Sci U S A. 1996;93:14765–14770. doi: 10.1073/pnas.93.25.14765. [DOI] [PMC free article] [PubMed] [Google Scholar]
Associated Data
This section collects any data citations, data availability statements, or supplementary materials included in this article.
Data Availability Statement
Not applicable.


