Abstract
Background
Research has shown the value of conducting a macroeconomic analysis of the impact of influenza pandemics. However, previous modelling applications focus on high‐income countries, and there is a lack of evidence concerning the potential impact of an influenza pandemic on lower‐ and middle‐income countries.
Objectives
To estimate the macroeconomic impact of pandemic influenza in Thailand, South Africa and Uganda with particular reference to pandemic (H1N1) 2009.
Methods
A single‐country whole‐economy Computable General Equilibrium (CGE) model was set up for each of the three countries in question and used to estimate the economic impact of declines in labour attributable to morbidity, mortality and school closure.
Results
Overall GDP impacts were less than 1% of GDP for all countries and scenarios. Uganda's losses were proportionally larger than those of Thailand and South Africa. Labour‐intensive sectors suffer the largest losses.
Conclusion
The economic cost of unavoidable absence in the event of an influenza pandemic could be proportionally larger for low‐income countries. The cost of mild pandemics, such as pandemic (H1N1) 2009, appears to be small, but could increase for more severe pandemics and/or pandemics with greater behavioural change and avoidable absence.
Keywords: Influenza, macroeconomic modelling, South Africa, Thailand, Uganda
Introduction
In April 2009, a new strain of influenza A H1N1 caused outbreaks in Mexico and the United States. This new strain of the virus rapidly spread across the world, which prompted the World Health Organization (WHO) to declare it a Public Health Emergency of International Concern on the 25th of April 2009 and a Pandemic on the 11th of June. By the time WHO declared the end of the pandemic on the 10th of August 2010, worldwide more than 214 countries and overseas territories or communities had reported laboratory‐confirmed cases of pandemic influenza H1N1 2009, including 18 449 deaths.1
The costs of the pandemic were not only human, with many sectors of the economy being affected. This was due to work absenteeism, people's reluctance to travel to certain countries, people avoiding public spaces, etc. To fully account for the cross‐sectoral costs of the H1N1 pandemic, it is important to estimate macroeconomic costs, and this article focuses on the macroeconomic costs attributable to lost labour supply.
There are two ways in which to estimate the macroeconomic effects: observational or modelling. Observational assessment would follow the method as used, for example, for the SARS epidemic of 2003 and reported previously by Keogh‐Brown and Smith.2 However, that study was conducted a couple of years after the SARS outbreak was over, where more data were available and attribution of economic changes to SARS more directly made (notwithstanding the second Gulf War). For the recent influenza pandemic, the situation is more difficult. This is principally because the recent nature of the pandemic means that data are unavailable for many of the indicators and countries that may be of interest; and for those indicators and sectors for which the available data are up‐to‐date, the data will usually be yearly or quarterly, which make it extremely difficult to infer whether it would be the global recession or the H1N1 (2009) pandemic that was responsible for any effect (this would have been easier if there had been monthly data, as then it would have been easier to see whether the changes on the indicators and sectors coincided with the pandemic). Where there are indicators and sectors for which data are available, they will inevitably show a decrease in the year 2009, as this was the year in which the impact of the global economic recession was the most severe.
In this context, then, the second method offers more promise; a mathematical model of the economy pre‐recession, which includes all the relevant sectors, that can be ‘shocked’ by the pandemic, allowing for the effect of the pandemic to be estimated controlling for other variables.
In this article, we outline the application of a Computable General Equilibrium (CGE) model to assess the likely impact of pandemic influenza H1N1 (2009), and some associated policies, in Thailand, South Africa and Uganda. Countries were selected based on data availability and to provide a spread of income groups. According to the World Bank World Development indicators, GNI per capita in 2009 was US$5,730 for South Africa, US$3,720 for Thailand and US$470 for Uganda. The goal of the analysis was to assess the likely macroeconomic impact of pandemic H1N1 (2009) reporting the impact on overall macroeconomic indicators (such as GDP) and for specific economic sectors and to evaluate mitigation policies related to these countries and scenarios.
In this article, we briefly outline the model and data used for the analysis. We then provide details of the scenario assumptions used in the model before presenting results for GDP, sectoral, household consumption and imports/export impacts. Finally, we draw conclusions from these results.
Methods
The model and methodology adopted are that previously applied to the UK and reported in detail by Smith et al.3 This section provides a brief synopsis of this approach and indicates where the model applied here differed from the previous study.
The model is a comparative static single‐country open‐economy CGE model. In addition to its previous application3, a description of the model used is included in the appendix and full documentation, including all model equations and underlying theory, is fully described elsewhere.4 Further details on CGE modelling can be found in Dervis et al.5
As with the Smith et al. (2009) model, the general method for assessing the impact of the pandemic 2009 is to apply exogenous shocks to the labour supply of a given country; these shocks representing temporary absence due to illness or school closure resulting from the pandemic, and the permanent (1 year) removal of labour to represent deaths resulting from the pandemic (note that death only results in ‘permanent’ removal for a year, as in the short term, the labour force can be augmented from external immigration, in the medium term from changes in the skill mix of the labour force and in the long term by increased birth rates).
Each country economy is specified in terms of several agents, including households, producers and government, and based on data (in the form of a social accounting matrix, which represents income and expenditure in the economy by sector) for 2004 taken from the Global Trade Analysis Project database6 and national statistics. To produce a model that can be adjusted and solved for multiple scenarios, it is necessary to aggregate the data into a manageable number of sectors. The aggregated sectors agreed upon with WHO to be used in this application are
Grains and crops
Meat livestock and farming
Mining and extraction
Processed food
Textiles, paper, forest and fish
Light manufacturing
Heavy manufacturing
Utilities and construction
Trade, transport and communication (including tourism)
Public administration and health
Other services
Scenario assumptions
The parameter estimates, which were provided or approved by WHO and used to inform these model shocks, together with their sources, are provided online as supplementary material (Table S1). A brief outline of the main assumptions is provided below.
Many of the parameter estimates used are described in terms of low, moderate or high severity. It should be noted that these terms are relative to the 2009 pandemic, and therefore, ‘high’ severity parameter estimates for pandemic (H1N1) 2009 are much milder than estimates used elsewhere based on 20th century pandemics.3, 7, 8
We assume three different clinical attack rates (CARs): low (7%), moderate (20%) and high (38%). The CAR determines the percentage of the population that becomes infected. Some of those who are infected will die, and this rate is known as the case fatality rate (CFR), for which three possibilities are considered: low (0·001%), moderate (0·01%) and high (0·1%). It should be noted that the overall mortality rate in the population for the disease in question is obtained by multiplying the CAR by the CFR. The duration of absence due to influenza, like the previous parameters, has three possibilities: low (4 days), moderate (5 days), high (6 days), and absence does not allow for weekends but assumes all days lost are working days. A 264‐day working year is/was assumed (resulting from a 6‐day working week) which differs from the 5‐day working week assumed for the UK in the previous studies.3, 7, 8 This proxies the greater importance of the grey/informal labour sector in developing countries.
Antivirals and vaccines are also modelled. Antivirals are assumed to reduce infectiousness and deaths by 60% with 66% coverage while a matched vaccine (single dose) is assumed to have an efficacy of 75%. Vaccine coverage is assumed to be 0%, 60% (as for the UK in Smith et al.3) and 100%. Vaccine cost is not modelled. School closure duration is assumed to be 1 week which is broadly in‐line with the closure periods in the countries being modelled. Mitigation effect of school closure on the clinical attack rate is assumed to be 5% and is calculated after vaccine effect (where necessary). Finally, 32% of the labour force is assumed to be responsible for dependent children; no allowance is made for informal care.
Results
GDP impacts
The main results are provided in Table 1 which shows the percentage GDP and cost impacts (in US dollars per capita) of the various scenarios modelled. Scenario descriptions are provided in the first column of the table and are self‐explanatory, although it may be beneficial to state explicitly that ‘disease only’ and ‘school closure’ scenarios incorporate no vaccine or antiviral mitigation and are therefore equivalent to a 0% vaccine coverage scenario. Figure 1 also illustrates the relative impact on GDP across each country for all scenarios.
Table 1.
Impact on GDP for each scenario modelled
| Cost (US$ per capita) | Cost (US$ per capita) | Cost (US$ per capita) | |
|---|---|---|---|
| Disease‐only scenarios Low CAR and low CFR | −1·22 | −0·27 | −3·04 |
| Disease‐only scenarios Mod CAR low CFR | −3·49 | −0·76 | −8·75 |
| Disease‐only scenarios High CAR and Low CFR | −6·64 | −1·46 | −16·66 |
| Disease‐only scenarios Low CAR and Mod CFR | −1·53 | −0·34 | −3·83 |
| Disease‐only scenarios Mod CAR and Mod CFR | −4·38 | −0·96 | −11·00 |
| Disease‐only scenarios High CAR and ModCFR | −8·35 | −1·83 | −20·92 |
| Disease‐only scenarios Low CAR and High CFR | −1·91 | −0·42 | −4·79 |
| Disease‐only scenarios Mod CAR and High CFR | −5·46 | −1·20 | −13·72 |
| Disease‐only scenarios High CAR and High CFR | −10·40 | −2·28 | −26·09 |
| School Closure 1 week Low CAR and low CFR | −8·15 | −1·79 | −20·44 |
| School Closure 1 week Med CAR low CFR | −10·32 | −2·26 | −25·89 |
| School Closure 1 week High CAR and Low CFR | −13·34 | −2·92 | −33·42 |
| School Closure 1 week Low CAR and Moderate CFR | −8·45 | −1·85 | −21·20 |
| School Closure 1 week Med CAR and Moderate CFR | −11·18 | −2·45 | −28·02 |
| School Closure 1 week High CAR and Moderate CFR | −14·97 | −3·27 | −37·50 |
| School Closure 1 week Low CAR and High CFR | −8·81 | −1·93 | −22·11 |
| School Closure 1 week Med CAR and High CFR | −12·21 | −2·67 | −30·60 |
| School Closure 1 week High CAR and High CFR | −16·94 | −3·71 | −42·42 |
| AVs Low CAR and low CFR | −8·15 | −1·79 | −20·44 |
| AVs Mod CAR low CFR | −10·32 | −2·26 | −25·89 |
| AVs High CAR and Low CFR | −13·34 | −2·92 | −33·42 |
| AVs Low CAR and Mod CFR | −8·45 | −1·85 | −21·20 |
| AVs Mod CAR and Mod CFR | −11·17 | −2·45 | −28·02 |
| AVs High CAR and Mod CFR | −14·95 | −3·27 | −37·45 |
| AVs Low CAR and High CFR | −8·78 | −1·92 | −22·03 |
| AVs Mod CAR and High CFR | −12·13 | −2·65 | −30·40 |
| AVs High CAR and High CFR | −16·77 | −3·67 | −42·01 |
| Matched 75%, 60% coverage Low CAR and low CFR | −7·10 | −1·56 | −17·83 |
| Matched 75%, 60% coverage Mod CAR low CFR | −7·32 | −1·60 | −18·36 |
| Matched 75%, 60% coverage High CAR and Low CFR | −7·62 | −1·67 | −19·12 |
| Matched 75%, 60% coverage Low CAR and Mod CFR | −7·13 | −1·56 | −17·90 |
| Matched 75%, 60% coverage Mod CAR and Mod CFR | −7·40 | −1·62 | −18·56 |
| Matched 75%, 60% coverage High CAR and Mod CFR | −7·78 | −1·70 | −19·50 |
| Matched 75%, 60% coverage Low CAR and High CFR | −7·16 | −1·57 | −17·95 |
| Matched 75%, 60% coverage Mod CAR and High CFR | −7·49 | −1·64 | −18·79 |
| Matched 75%, 60% coverage High CAR and High CFR | −7·94 | −1·74 | −19·90 |
| Matched 75%, 100% coverage Low CAR and low CFR | −6·40 | −1·40 | −16·08 |
| Matched 75%, 100% coverage Mod CAR low CFR | −5·32 | −1·17 | −13·36 |
| Matched 75%, 100% coverage High CAR and Low CFR | −3·83 | −0·84 | −9·61 |
| Matched 75%, 100% coverage Low CAR and Mod CFR | −6·26 | −1·37 | −15·70 |
| Matched 75%, 100% coverage Mod CAR and Mod CFR | −4·91 | −1·08 | −12·32 |
| Matched 75%, 100% coverage High CAR and Mod CFR | −3·05 | −0·67 | −7·66 |
| Matched 75%, 100% coverage Low CAR and High CFR | −6·13 | −1·34 | −15·39 |
| Matched 75%, 100% coverage Mod CAR and High CFR | −4·55 | −1·00 | −11·41 |
| Matched 75%, 100% coverage High CAR and High CFR | −2·36 | −0·52 | −5·91 |
Figure 1.
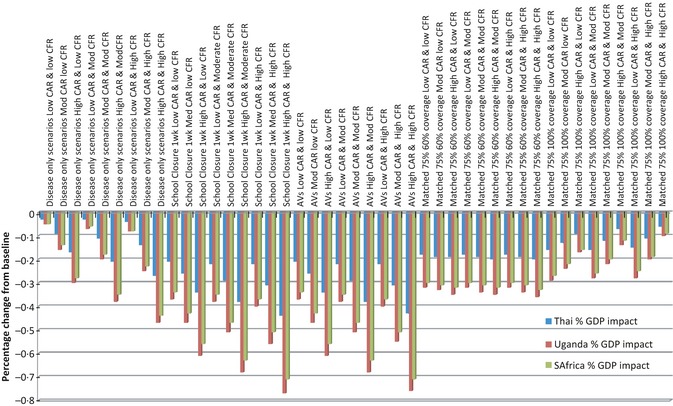
Overall percentage GDP impact by country. Disease only and school closure scenarios equate to 0% vaccine coverage.
Table 1 and Figure 1 show overall GDP losses for all countries for all scenarios. Not surprisingly, these results show that case fatality ratio is more influential than clinical attack rate in determining the magnitude of effect. School closure approximately doubles the impact of the disease‐only scenarios, even at just 1‐week closure.
Overall, the estimated impacts are relatively small, constituting an overall GDP loss of less than 1% for all scenarios across all countries. Of course, the relative wealth of a country means that this impact will likely be more pronounced in low‐income settings and does not differentiate the distribution of this impact within countries; sectoral disaggregation gives some indication of this below. This small effect results from a combination of several factors. The disease scenarios modelled here are mild in comparison with many of the pandemic scenarios modelled elsewhere. The reason for this is the preference to use actual figures derived from the pandemic H1N1 (2009) instead of hypothetical figures. The maximum CAR of 38% used is approximately equivalent to the standard estimate for future pandemics in planning documents and much lower than anticipated for severe scenarios. The CFR is also very low, similar to that observed during the pandemic 2009. The duration of school closure used is also quite short, just 1 week, which is roughly equivalent to the shortest school closure durations modelled elsewhere (although a relatively high mitigation effect of 5% is still assumed to result).
No prophylactic absence has been assumed. In Smith et al.3, it was assumed that prophylactic absence occurred when sufficient fear of death was provoked in the population and that this level of fear would be realized when one death had occurred in every person's social network of 300 people. However, the mildness of the pandemic scenarios modelled, as mentioned previously, is such that the ‘transition point’ theory postulated in Smith et al. (2009) would not result in prophylactic absence in any of the scenarios modelled here, unless the estimated social network size was increased beyond 300, and as illustrated elsewhere, it is the invocation of behavioural change which yields the largest economic effects for pandemic influenza.6, 7
Comparing the impacts across different countries, we see that the smallest impacts occur to the Thai economy, followed by South Africa and then Uganda experiencing the largest impacts. The larger Ugandan impacts illustrate the impact on a low‐income economy, but the Thai and South African economies are not dissimilar in size.
Sectoral impacts
The sectoral impacts for each country, split by the sectors outlined in Section 2, are presented in Figure 2.
Figure 2.
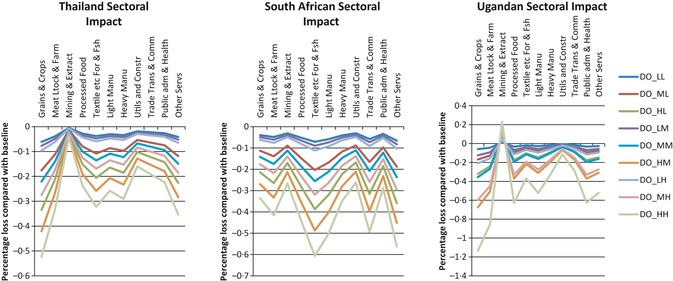
Sectoral impact by country. DO_ represents ‘disease only’ scenario, the last two letters represent low, moderate or high CAR and CFR respectively (i.e. MH indicates moderate CAR and high CFR).
The pattern of impacts across sectors remains similar for all scenarios, although the absolute magnitudes differ. The disease‐only scenarios show the greatest distinction between variations in CAR and CFR and so are used for illustration.
Compared to the UK (Smith et al., 2009), grains and crops exhibit a larger impact, particularly for Thailand and Uganda. This is a result of those countries' proportionately greater use of labour in grains and crop production and less use of capital, but also because the elasticities are larger for all three countries than for the UK, making the economy more able to substitute alternative goods and less dependent on maintaining that sector's productivity.
In general, capital intensive sectors, such as mining and extraction (which in Thailand spends over 85% of its factor consumption on capital, land and natural resources), suffer the smallest losses from the imposed labour shocks and labour‐intensive sectors (such as services or processed food) suffer the largest losses.
The general pattern of sectoral results for Uganda are similar to those of Thailand, with the notable addition of gains (rather than losses) for the mining and extraction sector. This gain occurs for all Ugandan scenarios and is attributable to the very small impact of labour shocks on production (nearly 92% of Ugandan mining and extraction factor use is either capital, land or natural resources) combined with an increase in valuable exports.
The South African decline in textiles, paper, forestry and fishing is primarily due to the very high ratio of labour to other factors used in production compared with the other countries. Indications are that imports for this sector would be maintained during an influenza pandemic but intermediate demand and export demand would fall. Household demand (shown later) would also fall but to a lesser degree than the overall sectoral loss.
Household consumption
Household consumption patterns are also similar across all countries, as indicated in Figure 3.
Figure 3.
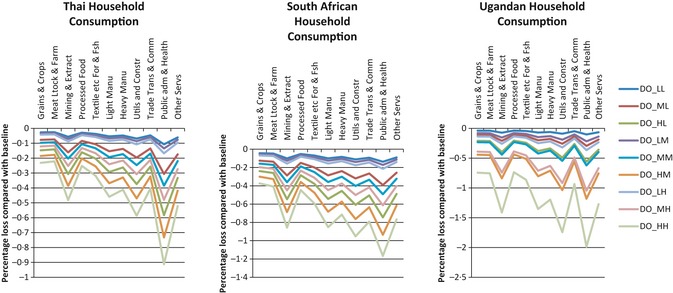
Household consumption. DO_ represents ‘disease only’ scenario, the last two letters represent low, moderate or high CAR and CFR respectively (i.e. MH indicates moderate CAR and high CFR).
The smallest declines occur to grains and crops, meat livestock and farming and processed food sectors, which is not surprising based on the necessary subsistence consumption for these sectors. As might be expected, spending on mining and extraction products declines, reflecting the non‐essential nature of these items, and many other sectors associated with luxury items also decline. The large change in the public administration, education and health sector appears in several of the indicators. Consumption of this sector's goods is predominantly made by the government, and for this reason, percentage changes in home consumption and (later) import and exports can appear slightly larger. However, the values of these changes are very small compared with smaller percentage changes in the other sectors. Also, the public administration and health sector are a very labour‐intensive sector which also explains the larger impacts here and below. Overall reductions in household consumption are inversely related to the wealth of the country with Ugandan impacts being largest and Thailand impacts being smallest.
Imports and exports
As indicated in Figure 4, import patterns appear slightly different between countries. With the exception of Ugandan textile losses, import effects for the first seven sectors are small. The Ugandan gains to grain and crop imports are necessary to maintain the domestic demand for these products in the face of large losses to that sector. Losses to imports in the trade and transport sectors in all countries are not surprising. Losses to the textile, forestry and fishing sector are slightly larger in Uganda, and the gains to Ugandan imports of utilities and construction are larger. Also, Thailand sees larger gains to its public administration and health sector imports than the other nations. The positive impacts for the public administration and health sector are related to the export impacts described below and have been partially explained in the household consumption results presented perviously.
Figure 4.
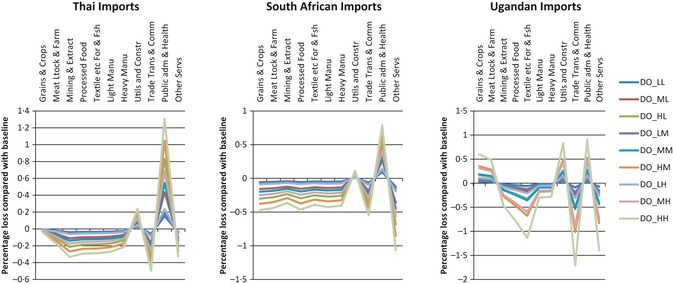
Import impacts. (DO_ represents ‘disease only’ scenario, the last two letters represent low, moderate or high CAR and CFR respectively (i.e. MH indicates moderate CAR and high CFR).
As indicated in Figure 5, many of the export impacts are broadly in‐line with the subsistence, domestic impacts and import changes already outlined. The Ugandan export loss to grains and crops is in response to the necessary subsistence consumption and inelastic demand for these products in the face of substantial losses in response to lost labour supply in a sector which, in contrast to wealthier countries, is labour intensive in Uganda. There is a Ugandan gain in textiles forestry and fishing, but this is one of the smallest sectors in the Ugandan economy and so fractional percentage gains are easily obtained with the adjustments in the economy due to the shock.
Figure 5.
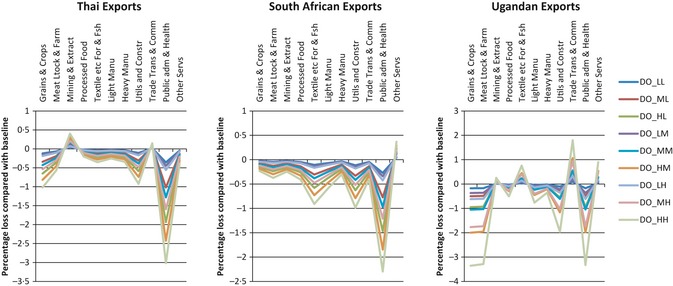
Export impacts. DO_ represents ‘disease only’ scenario, the last two letters represent low, moderate or high CAR and CFR respectively (i.e. MH indicates moderate CAR and high CFR).
The public administration and health sector exports a very small proportion of its goods, particularly in Thailand. Government demand for the products of this sector is maintained during economic losses and so declines in household consumption and exports occur in response to the lost productivity resulting from the labour supply shock.
Discussion
It is clear that any major pandemic will have wide economic as well as health repercussions. Planning for pandemic preparedness, to include decisions on investment in pro‐active and re‐active measures associated with reducing the health and economic impact, requires information on the scale and distribution of the economic impact. However, the mild nature of the pandemic influenza H1N1 (2009), as well as occurring in the depths of a global financial crisis, means that observational estimates are hard to establish. Further, even if they were, they provide no counterfactual of what would have been the impact if the specific measures enacted at the time had not occurred and thus do not assist in establishing the relative efficiency of pro‐active and re‐active measures. In this case, a modelling approach adds considerable value.
The scenarios presented here are based on existing evidence from a recent mild pandemic, and therefore, only mild diseases together with very short periods of school closure have been considered. Other studies based on models of developed countries3, 6, 7 have illustrated that relatively mild pandemics can have notable economic effects and that the drivers of economic effects appear to be school closures (of 4‐week duration and longer), prophylactic absence and behavioural change, none of which have been modelled in this study.
One factor that may influence the differential effect sizes between countries is the ratio of labour to capital in the economies. Thailand spends approximately half as much on labour inputs than it does on capital for production of goods, whereas for South Africa, the labour and capital are used in broadly equal measure, and for Uganda, approximately 50% more of production costs are spent on labour than on capital inputs. This may influence the sensitivity of impacts to a decline in the labour supply resulting from a pandemic.
More broadly, the sectoral breakdown indicates the contrast between the more macro‐focused economic analysis, as presented here, and the more micro‐focused analysis more usually undertaken in health economics. More traditional economic evaluation (cost‐effectiveness, utility or benefit analysis) works within a partial equilibrium framework.9 This works under the premise that changes within a sector can be isolated from other sectors and thus analysis consequently circumscribed. The analysis presented here indicates the importance of the ‘ripple effect’ of events through sectors. However, more micro‐based studies have greater sectoral specificity and sensitivity, and so complement the forms of analysis as presented here. The lesson for micro‐economic analysis is that there is a clear need for (pandemic) influenza economic evaluations to account for behavioural changes and capacity problems when outbreaks occur.
Overall, our results suggest that the effect of pandemic influenza in developing countries could potentially be larger than the effect in more developed countries. This conclusion applies when the thrust of the economic effect comes from morbidity and mortality. However, in richer countries, consumption of luxury goods is far more common, and it is these purchases that can be most easily forgone during a pandemic. Also, as workers in poorer nations do not, in general, receive income when they are absent from work, prophylactic absence may be less likely in those situations. It is therefore possible that, while the disease effects are larger in poor nations, as shown by our results, they may not suffer the larger losses from behavioural change that developed countries will.
This article illustrates the value of considering the impacts that different disease and policy measures may have, and especially how these may vary across different countries at high‐, middle‐ and low‐income status. There are of course caveats to the results presented here. Most critical perhaps is that consumption effects from avoidance of public places, entertainment events, changes in shopping patterns, etc., were not taken into account Also, as usual, the strength of the findings depends on the underlying assumptions.
Conclusion
CGE modelling based on pandemic (H1N1) 2009 disease parameters suggests that the economic impact of such a pandemic was small. However, there is some evidence to suggest that the unavoidable absence from work caused by morbidity and mortality could have a more damaging impact to low‐income countries like Uganda compared with more developed countries like South Africa and Thailand. Many aspects of potential behavioural change and avoidable worker absence have not been modelled, but could greatly increase the overall economic costs.
Supporting information
Table S1. Parameter estimates and sources of information used for modelling the economic impact of the pandemic.
Acknowledgement
This research was supported by a grant from the World Health Organization (WHO). The findings, interpretations and conclusions expressed in this article are entirely those of the authors and should not be attributed in any manner whatsoever to WHO.
Conflict of interest
The authors have no potential conflicts of interest to declare.
Smith and Keogh‐Brown (2013). Macroeconomic impact of pandemic influenza and associated policies in Thailand, South Africa and Uganda. Influenza and Other Respiratory Viruses 7(Suppl. 2), 64–71.
References
- 1. WHO . Pandemic (H1N1) 2009. update 112, 6th August 2010. Available at http://www.who.int/csr/don/2010_08_06/en/ (Accessed 9th January 2013)
- 2. Keogh‐Brown MR, Smith RD. The economic impact of SARS: how does the reality match the predictions? Health Policy 2008; 88:110–120. [DOI] [PMC free article] [PubMed] [Google Scholar]
- 3. Smith RD, Keogh‐Brown MR, Barnett T, Tait J. The economy‐wide impact of pandemic influenza on the UK: a computable general equilibrium modelling experiment. BMJ 2009; 339:b4571. [DOI] [PMC free article] [PubMed] [Google Scholar]
- 4. Löfgren H, Harris RL, Robinson S. A standard computable general equilibrium (CGE) model in GAMS. TMD discussion papers 75. 2001. International Food Policy Research Institute (IFPRI)
- 5. Dervis K, De Melo J, Robinson S. General Equilibrium Models for Development Policy. Cambridge: Cambridge University Press, 1982. [Google Scholar]
- 6. Narayanan B, Walmsley TL. Global Trade, Assistance, and Production: The GTAP 7 Data Base. West Lafayette: Center for Global Trade Analysis, Purdue University, 2008. [Google Scholar]
- 7. Keogh‐Brown MR, Smith RD, Edmunds JW,Beutels P. The macroeconomic impact of pandemic influenza: estimates from models of the UK, France, Belgium and the Netherlands. Eur J Health Econ 2010; 11:543–554. [DOI] [PubMed] [Google Scholar]
- 8. Keogh‐Brown MR, Wren‐Lewis S,Edmunds JW,Beutels P, Smith RD. The possible macroeconomic impact on the UK of an influenza pandemic. Health Econ 2010; 19:1345–1360. [DOI] [PubMed] [Google Scholar]
- 9. Beutels P, Edmunds W, Smith R. Partially wrong? Partial equilibrium and the economic analysis of public health emergencies of international concern. Health Econ 2008; 17:1317–1322. [DOI] [PubMed] [Google Scholar]
Associated Data
This section collects any data citations, data availability statements, or supplementary materials included in this article.
Supplementary Materials
Table S1. Parameter estimates and sources of information used for modelling the economic impact of the pandemic.


