

Abstract
PRDM9 contributes to hybrid sterility and species evolution. However, its role is to be confirmed in cattle, a major domesticated livestock species. We previously found an association near PRDM9 with cattle recombination features, but the causative variants are still unknown. Using millions of genotyped cattle with pedigree information, we characterized five PRDM9 alleles and generated allele-specific recombination maps. By examining allele-specific recombination patterns, we observed the impact of PRDM9 on global distribution of recombination, especially in the two ends of chromosomes. We also showed strong associations between recombination hotspot regions and functional mutations within PRDM9 zinc finger domain. More importantly, we found one allele of PRDM9 to be very different from others in both protein composition and recombination landscape, indicating the causative role of this allele on the association between PRDM9 and cattle recombination. When comparing recombination maps from sperm and pedigree data, we observed similar genome-wide recombination patterns, validating the quality of pedigree-based results. Collectively, these evidence supported PRDM9 alleles as causal variants for the reported association with cattle recombination. Our study comprehensively surveyed the bovine PRDM9 alleles, generated allele-specific recombination maps, and expanded our understanding of the role of PRDM9 on genome distribution of recombination.
Keywords: PRDM9, recombination, cattle, allele, single sperm genomics
1. Introduction
Meiotic recombination promotes population diversity by reshuffling parental genetic variants into the next generation and providing novel combinations of genes for selection and evolution.1–5 Meiotic recombination is also important in determining proper chromosomal segregation.4 Recombination hotspots are usually clustered into narrow genomic regions that are specified by the PR domain-containing 9 (PRDM9) gene in human and mouse.6–9 The high polymorphism level (number and type) in the tandem-repeat zinc finger (ZnF) regions of PRDM9 has drawn wide interest and attention.10–12 In mammals, the number of PRDM9 ZnF varies from 6 to 19 with highly diverse ZnF components between and within species, likely evolving under strong positive selection.4,10,13–15 Some species, like canids, carry inert versions of PRDM9 genes with multiple disruptive mutations.16,17 Although the polymorphism level of PRDM9 is dramatically higher than other genes in many mammalian species, the diversity of PRDM9 has only recently been documented in cattle (Bos taurus),18,19 which has been domesticated since the Neolithic period20 and whose effective population size continued to shrink from tens of thousands prior to domestication to hundreds at present.21
Considerable variation in recombination rate between individuals has been documented in mammals and other species.22–26 A recent study reported different locations of double-strand breaks between PRDM9 alleles in humans, indicating a critical role of PRDM9 in individual-level variations of recombination.27PRDM9 has also been shown to drive evolutionary erosion of hotspots in Mus musculus through haplotype-specific initiation of meiotic recombination.28 In a further study of Mus musculus PRDM9, Smagulova et al. found hotspot erosion governed the preferential usage of PRDM9 alleles and increased sequence diversity at hotspots that become active in the hybrids.28 Because crossovers were disfavored at such hotspots, it was assumed that sequence divergence generated by hotspot turnover may create an impediment for recombination in hybrids, potentially leading to reduced fertility and, eventually, speciation. Through these mechanisms, PRDM9 has been considered as an important player in speciation.29 Moreover, re-engineering the ZnFs of PRDM9 with human alleles reversed hybrid sterility in mouse.30 Despite the important role of PRDM9 on recombination, a genome-wide evaluation of the recombination patterns of different PRDM9 alleles has been lacking in mammals, mainly due to the limited pedigree data in mammalian species.
Large-scale pedigree data are crucial for reconstructing fine-scale recombination maps and for studying patterns of recombination. Genomic evaluations in the cattle industry have accumulated tons of genotype data with pedigree information. The USDA-ARS Animal Genomics and Improvement Laboratory (AGIL) maintains a large database that includes millions of genotyped cattle, a unique resource for studying meiotic recombination with unprecedented power. In a large-scale study of cattle pedigree, recently, we have reported strikingly different recombination patterns between males and females, and identified several loci associated with recombination rate and hotspot usage in both sexes, including the PRDM9 gene on chromosome 1.31 Additionally, in contrast to human and mouse studies that reported a male to female ratio of 0.6:0.9 in genome-wide recombination rate,22,32,33 a much higher ratio of 1.1:1.2 was found in cattle,31,34 suggesting marked divergence in the sex-specific recombination rate in these placental mammals. However, it remains unclear what the causative mutations are for the cattle PRDM9 association and how PRDM9 alleles impact recombination features.
While pedigree-based studies have been widely applied, there are two other methods for measuring recombination based on either linkage disequilibrium (LD) patterns or sperm typing. Sperm typing and single-sperm genomics evaluate recombination at either a regional scale or genome-wide level.35,36 Although global recombination maps obtained by these methods are more or less consistent with one another,37 measurable local differences that attributed to different genetic features cannot be ruled out. Using single sperm genomics approach, Wang et al. reported an average of 22.8 recombination events, 5 to 15 gene conversion events, and 25 to 36 de novo mutations in human sperm cells.36 Using the same method, another study reported aneuploidy in 4% of the cells and 26 recombination events per single-sperm cell in humans.38 These studies affirmed the robustness of single sperm genomics as alternative to pedigree-based approaches in recombination research.
Using large-scale pedigree analysis and genome-wide single sperm genomics, the objective of this study was to (1) Characterize PRDM9 ZnF sequence variations in two cattle breeds; (2) Correlate different PRDM9 alleles with recombination features and generate PRDM9 allele-specific recombination maps in two sexes of cattle; and (3) Assess the reliability of pedigree and single sperm-typing based approaches and compare recombination patterns between sperms and live-born offspring.
2. Materials and methods
2.1. Validation of bovine PRDM9 gene structure
The Ensembl database has two coding sequences for the Zinc finger (ZnF) repeat of the bovine PRDM9 gene, located respectively at Chr1: 45, 034, 069-45, 034, 571 (ZnF1) and Chr1: 45, 078, 067-45, 078, 685 (ZnF2).39 Using evidence from multiple sources, we confirmed ZnF1 as the correct ZnF coding sequence for PRDM9. First, we separately amplified the two ZnF repeat regions using genomic DNA of eight bulls from two cattle breeds (Holstein and Hereford). Due to the high diversity in the ZnF regions of PRDM9 in other species, we expected to observe polymorphisms in the ZnF region of bovine PRDM9. However, we found nucleotide variation in only the ZnF1 region; no polymorphisms were observed in the ZnF2 region. To further validate the two ZnF sequences for PRDM9, we attempted to amplify them from the cDNA of bovine testis tissue using two specifically designed primers. Only ZnF1 was successfully amplified (Supplementary Fig. S1). The reverse primer for ZnF1 is located in a non-coding region, suggesting that ZnF1 and ZnF2 are disconnected in the mRNA level. These results were used to confirm the gene structure of bovine PRDM9, and we used the ZnF1 region of PRDM9 in all following analyses.
2.2. Amplification and sequencing of cattle PRDM9 ZnF repeats
Cattle testis tissues were collected as per the ethical guidelines of USDA-ARS animal use and care protocol. The testis was snap-frozen in liquid nitrogen immediately after excision and kept at −80 °C until further use. Total RNA was isolated and reverse-transcribed to cDNA. Frozen semen and somatic tissue of animal HOUSA000072190767 (Supplementary Table S2), together with its parent somatic tissues were donated by Selected Sires, Inc (Plain City, OH, USA). Other Holstein and Jersey cattle DNA samples were obtained from the Cooperative Dairy DNA Repository (CDDR) at USDA-ARS. The PCR and sequencing primers were designed using Primer-BLAST,40 and the PRDM9 gene in the cattle reference genome (UMD 3.1.1) was used as template.41 We confirmed the specificity of primers by comparing with the newest version of the cattle genome (Btau_5.0.1, GCA_000003205.6). The primer pairs for PCR amplification using cDNA as the template were designed by crossing two or more exons to avoid potential DNA contamination. The primer pairs for PRDM9 ZnF repeat amplification were designed with 579 bp (5′ end) and 157 bp (3′ end) of unique, non-repetitive flanking sequences around the ZnF repeat. All the primers used in the present study are listed in Supplementary Table S1.
The PCR amplification was performed with 50 μL reaction volume according to Taq DNA polymerase manufacturer’s protocol (Taq PCR Master Mix Kit, Qiagen, Hilden, Germany), and the genomic DNA was amplified on a bioRad MyIQ thermocycler. The PCR cycle for PRDM9 ZnF repeat amplification was as follows: initial denaturation at 95 °C for 5 min; followed by 40 cycles of 95 °C for 45 s, annealing at 63 °C for 40 s; primer extension at 72 °C for 1 min 20 s; and final extension at 72 °C for 10 min. All the amplified products were run in 1.5% agarose gel, the bands were cut, and DNA was purified with the MinElute Gel Extraction Kit provided by the Qiagen (Hilden, Germany). Purified PCR products were ligated to the pGEM-T Easy vector using the pGEM-T Vector System I (Promega, Madison, WI, USA) and transformed into DH5α (subcloning efficiency) competent cells (Invitrogen/Life Technologies, Carlsbad, CA, USA). Examples of Agarose gel electrophoresis of PCR products are shown in Supplementary Fig. S2. At least 10 single colonies for each PCR product were randomly picked. Plasmid was extracted using Plasmid Miniprep System (Promega, Madison, WI, USA) and sequenced using the T7 and SP6 primers at two companies, GENEWIZ (South Plainfield, NJ, USA) and Macrogene (Rockville, MD, USA).
To account for the short tandem repetitive nature of ZnF repeats, only forward and reverse sequences with sufficient overlap (at least 168 nt sequences covering two ZnF repeats) were used to prepare the contig and the consensus sequence for each clone was obtained. We used at least three clones with identical sequence to support a valid consensus sequence. To get both alleles with the same length from an individual, we generated at least six assembled sequences for each PCR product and used more clones for those individuals whose two alleles showed an unbalanced ratio. The detailed clone number and allele information for all animals were listed in Supplementary Tables S2 and S3.
2.3. Estimation of recombination rate in cattle pedigree
We used similar approaches as describe before.42 In brief, we extracted three-generation families from Holstein and Jersey pedigree. Within a family, we require that the offspring, at least one parent, and at least one grandparent were genotyped by single nucleotide polymophism (SNP) arrays. In a three-generation family, we phased the two haplotypes of an animal (second and third generations) based on the parental genotypes, and crossover locations were identified by comparing either a paternal or maternal haplotype of an offspring (third generation) to its corresponding parent’s two haplotypes (second generation). Based on the location of a crossover, a recombination event was assigned to an interval flanked by two SNPs that are informative (phased heterozygote in the second generation). To construct recombination maps of SNPs, we estimated recombination rate between consecutive SNPs based on the identified crossover events by assigning a recombination event as equal probabilities to all consecutive SNP intervals between the two informative SNPs. When constructing recombination maps, we only included high-quality data where all members of a three-generation family were genotyped by at least 50 K SNP chips. For quality control purposes, we also removed animals (<1%) that have more than 45 crossover events genome-wide, based on the distribution of crossover events in all data. The sex chromosomes were excluded from all analyses due to the poor quality of the genome assembly.
2.4. Global and local comparisons of recombination maps
To show the global distribution of recombination rates along the chromosomes, we adopted a smooth spline model of recombination rates against relative physical locations on chromosomes using the smooth spline function implemented in R 3.2.4.42,43 We divided the recombination data into subgroups based on the PRDM9 genotype and sex and generated global recombination maps for each of the PRDM9 alleles in both males and females.
To identify PRDM9 dependent hotspot regions, we compared recombination rate locally in a SNP interval between three PRDM9 genotypes of allele 5 (allele 5 homozygote, allele 5 heterozygote and non-allele 5 genotypes). Given a SNP interval and a pair of groups, we generated a 2 × 2 table of recombination data (number of meioses w/o recombination in two genotype groups) and applied a χ2 test to determine whether recombination rate is different between the two groups. Since the frequency of allele 5 in Holsteins is about 9%, there are unbalanced numbers of animals for the three genotype groups for allele 5 (allele 5 homozygote, heterozygote, and non-allele 5 homozygote). Male and female data also have different sample sizes. To account for the issue of unbalanced sample sizes, we used evidence from multiple sources to select the most significant allele-specific hotspots for allele 5 based on the following rules: (1) Same direction of the difference in recombination rate for males and females; (2) P-value for the comparison between allele 5 homozygote and non-allele 5 genotypes is less than 0.05; (3) P-value in the comparison of allele 5 heterozygote versus allele 5 homozygote or non-allele 5 genotypes is less than 0.05; and (4) At least one P-value from (2) or (3) is less than 2 × 10⁻⁶. For non-allele 5, we excluded the comparison between allele 5 homozygote and non-allele 5 genotypes due to the very limited sample sizes and low statistical power.
2.5. Whole genome amplification, genotyping and quality control of single sperm DNA
Sperm cells were obtained from semen samples stored in liquid nitrogen. Frozen semen was thawed in 37 °C water for 30–45 s. Sperms were diluted by PBS + 1% BSA and washed twice. Then the sperms were further diluted to a proper resolution using PBS + 1% BSA on a petri-dish, and active single sperms were picked up manually by pipetting into a reaction tube under micromanipulator. Whole-genome amplification was performed according to the manufacturer’s protocol using a Single Cell Whole Genome Amplification Kit (Yikon Genomics, Shanghai, China) based on the MALBAC (Multiple Annealing and Looping Based Amplification Cycles) technology. In brief, a single sperm was initially lyzed and pre-amplified by primers supplied in the kit with eight cycles with multiple annealing steps. Fragments with variable length at random starting positions were generated by polymerase extension for multiple cycles by exponential amplification step. PCR products were purified and sent to Neogen/GeneSeek (Lansing, MI, USA) for genotyping by the Illumina® BovineHD Genotyping BeadChip assay. PCR amplification quality was confirmed by showing the percentage of SNP successfully genotyped per Mb evenly distributed along the whole genome (Supplementary Fig. S3). To improve the genotyping accuracy for single sperms, we applied a stringent cut-off on the raw genotyping quality score to call genotypes, eliminated heterozygous SNP calls, and removed SNPs that had conflict with the sire genotype. In total, we performed whole genome amplification for 97 single sperms.
2.6. Phasing and inferring crossovers in single sperms
Genomic DNA of Animal 102 and the parents were extracted from ear tissues and genotyped together with single sperm DNA at GeneSeek using Illumina® BovineHD Genotyping BeadChip assay. Heterozygous SNPs (hetSNPs) of the bull were phased to two haploids (paternal and maternal) based on the genotypes of two parents. In total, over 76.33% of the 193,066 hetSNPs were phased. Before inferring crossovers in sperms, we applied additional quality control procedures, including general call score ≥ 0.7 for a SNP and homozygote rate ≥ 0.8 for a sample (Supplementary Fig. S4 and Supplementary Table S4). After quality control (QC), single sperm samples had phased hetSNP numbers ranging from 11,762 to 87,648. To improve accuracy, we applied the Viterbi algorithm in a hidden Markov model in R to identify crossovers in the sperm haplotype as a transition between paternal and maternal status.43 After filtering samples with abnormal numbers of crossovers (>45), we obtained 1,526 autosomal crossover events from 56 high quality single sperms. Using pedigree data of the same bull, we identified 12,089 crossovers from 556 offspring that were genotyped with 7 K, 10 K or 50 K SNP chips.
3. Results
3.1. ZnF variants of PRDM9 in two cattle breeds
Due to the highly repetitive nature of PRDM9 ZnFs, next-generation sequencing is unable to accurately measure the target sequence because one read cannot capture the full length of the ZnF region. To fully characterize genetic variation of cattle PRDM9, we PCR-amplified, cloned, sequenced, and phased the ZnFs of PRDM9 for 25 and 17 influential bulls, respectively, for Holstein and Jersey, the two most common breeds of dairy cattle in the US. Based on amino acid composition, a total of ten different ZnF arrays (color coded in Fig. 1) and five different alleles (combination of multiple ZnF arrays) were recovered from the 42 bulls that are representative of the dairy population because these chosen bulls typically had thousands of daughters and sons (Supplementary Table S2). The five alleles of PRDM9 were named by the order of allele frequency in the Holstein sample. In contrast to primate and mouse PRDM9 that has 6–19 ZnF repeats,10,11 the cattle PRDM9 appears to have fewer ZnF repeats, ranging from 6 to 7 for each allele (Fig. 1a). With exception of allele 3 that possesses seven ZnF repeats, all the remaining alleles consist of six repeats. Despite the small effective population size of domestic cattle,21the amino acid residues at positions –1, 3 and 6 of the ZnF α helix, which were predicted to be in contact with DNA motifs,11,44 are highly polymorphic. Note that the ten different ZnF arrays may have the same composition at these three positions as ZnF arrarys were defined by the full length amino acid sequence. At the nucleotide level, all of the changes at these three sites are non-synonymous. The amino acid alignments of the cattle ZnF repeats with the corresponding repeats of other species, including human, rhesus monkey, rat and mouse, are shown in Supplementary Fig. S5. While the ZnFs of cattle PRDM9 show consistent patterns with other species, several amino acid residues are unique to cattle. For example, cattle have Serine and Glycine at positions –4 and –9, respectively, but the corresponding positions in all other species are Glycine and Arginine (Supplementary Fig. S5).
Figure 1.

PRDM9 alleles and ZnF arrays in Holstein and Jersey cattle. (a) Allele and ZnF array information in Holstein and Jersey cattle. ZnF arrays were coded from A to J according to the full length amino acid composition, and the three important sites were shown (–1, 3 and 6) that may be same for different ZnF arrays. Alleles were coded from allele 1 to allele 5 based on their ZnF array composition. (b) PRDM9 gene structure and comparison between non-allele 5 and allele 5. Four domains (KRAB, SET, single ZnF, 6 to 7 ZnF repeats) were present in bovine PRDM9. Allele 5 was perfectly linked with the minor allele of the SNP at Chr1: 45112924 (R2 = 1). Comparing between non-allele 5 and allele 5, amino acid frequencies at each positions were shown as proportional to the size of the letters (one ZnF includes 28 amino acids). Positions with different amino acid components between allele 5 and other alleles were highlighted by “*”.
Although we identified five alleles in the Holstein cattle (Supplementary Table S2), only four alleles (alleles 1–4) were observed in Jerseys (Supplementary Table S3). As the two breeds are closely related, we observed minor differences in allele frequency between Holstein and Jersey (Fig. 1a). For instance, allele 1 is most frequent in Holstein (38%), but allele 2 appears to be dominant in Jersey (41.2%). The most striking difference between the two breeds is the uniqueness of allele 5 in Holstein (8%). Interestingly, allele 5 is the most distinct allele compared to other alleles with no shared ZnF arrays between allele 5 and non-allele 5 (Fig. 1b). The amino acid alignments between allele 5 and the rest of the alleles revealed unique amino acid substitutions at the DNA-contact sites (i.e. –1, 3 and 6) and nearby positions (–2 and 2). Consistently, allele 5 and non-allele 5 (referred to as the rest of the alleles) were predicted to preferentially recognize distinct DNA motifs (Supplementary Fig. S6). In a previous genome-wide association study (GWAS) study of recombination in cattle, we identified a SNP (rs110661033, Chr1: 45113934) downstream of the PRDM9 gene that was associated with genome-wide hotspot usage and recombination rate.42 Intriguingly, the minor allele ‘A’ of SNP rs110661033 was perfectly linked with PRDM9 allele 5 in the current study (R2 = 1; Supplementary Table S2). All the Holstein bulls that carry one copy of allele 5 are heterozygous at SNP rs110661033 (G/A). We further confirmed this linkage between PRDM9 (non-allele 5/allele 5) and SNP rs110661033 (G/A) by sequencing PRDM9 in an additional five Holstein bulls selected by the SNP genotype, in which two animals are heterozygous at rs110661033 and carry one copy of allele 5 at PRDM9, and three bulls are homozygous (A/A) at rs110661033 and carry two copies of allele 5 (Supplementary Table S2). Altogether, these results demonstrate that PRDM9 ZnF alleles are likely the causative mutations associated with the recombination features in cattle, with PRDM9 allele 5/non-allele 5 combinations fully explaining the association between rs110661033 and recombination rate and hotspot usage that we previously reported.42
3.2. PRDM9 allele-specific recombination maps for holstein
Superior bulls have been extensively used in dairy cattle breeding through artificial insemination. In the national dairy database maintained at AGIL, a bull typically has hundreds to thousands of daughters genotyped. The 25 Holstein bulls selected for sequencing of PRDM9 were chosen because they have large numbers of genotyped offspring to study recombination (Supplementary Table S2). To have an overview of the recombination patterns of PRDM9 alleles, we divided the 25 Holstein bulls into six groups based on their PRDM9 genotypes: allele 1 homozygote, allele 2 homozygote, allele 1/2 heterozygote, allele 3 carrier (homozygote or heterozygote), allele 4 carrier (homozygote or heterozygote), and allele 5 carrier (heterozygote). After splitting, each group has 3 to 6 bulls and more than 2, 300 offspring genotyped by 50 K SNP chips, allowing us to generate PRDM9-specific recombination maps for individual groups (Supplementary Fig. S7). The six recombination maps exhibited similar global patterns of recombination with two peak regions, one near the 10% from the beginning of a chromosome and the other to the end. However, allele 5 carrier group showed a larger recombination rate than other alleles at both peak regions. Note that the difference between allele 5 carrier group and other groups is small due to the limitation of sample size and mixed grouping of heterozygote and homozygote individuals. Still, this observation is consistent with the observed differences in protein sequences between the five alleles, where allele 5 has the most distinct ZnFs compared to other alleles.
Using an imputation-based approach, we next aimed at generating allele-specific recombination maps for each of the five PRDM9 alleles. Based on the LD patterns between PRDM9 alleles and nearby SNPs or haplotypes in the 25 Holstein bulls, we identified markers tagging each of the five PRDM9 alleles (Supplementary Table S5). Using this tagging information, we extracted all available recombination data and constructed recombination maps for each of the five PRDM9 alleles in both males and females (Fig. 2). In total, we extracted 1,369,139 three-generation families in Holstein, with each family including one offspring, at least one parent (maternal or paternal), and at least one grandparent. A total of 239,116 three-generation families were genotyped by chips with at least 50 K SNPs. We inferred over 3.7 million paternal and over 2 million maternal crossover events from these three-generation families. As mentioned previously, SNP rs110661033 was in perfect LD with allele 5 with a maximum R2 value of 1. Using this SNP (MAF = 9.4%) as a tagging marker, we extracted all animals (bulls and cows) carrying allele 5 and the corresponding three-generation families, with the number of families for allele 5 homozygote, allele 5 heterozygote and non-allele 5 homozygote genotypes being 637, 28, 759 and 120, 990 in males and 719, 15, 548 and 72, 513 in females, respectively. Similarly, using tagging haplotypes or SNPs, we extracted animals and three-generation families for each of the other four alleles (Supplementary Table S5).
Figure 2.

PRDM9 allele-specific distribution of recombination rate along a chromosome in males and females in Holstein. (a) Recombination patterns of five alleles in males. (b) Recombination patterns of five alleles in females. (c) Recombination patterns of three genotypes of allele 5 in males. (d) Recombination patterns of three genotypes of allele 5 in females. The relative physical position on a chromosome is used, where zero corresponding to the beginning of a chromosome and one the end. The smooth spline model was fitted across all of the 29 autosomes.
With an expanded data set using imputation, we assembled enough data to generate recombination maps for each of the five PRDM9 alleles in two sexes (Fig. 2). Across the five alleles, the average number of crossovers for males and females are 25.10 and 22.74, respectively, which is consistent with previously reported higher recombination rate in bulls than in cows.42 While males and females exhibited different recombination maps across the genome, most notably near the end of chromosomes, PRDM9 alleles were associated with differences in global recombination maps within each sex (Fig. 2). One striking observation was that among the five PRDM9 alleles, allele 5 showed the largest recombination maps in both sexes (Fig. 2a and b). Bulls with allele 5 homozygote, allele 5 heterozygote and non-allele 5 homozygote genotypes had a genetic map length of 27.0, 25.7 and 24.9 Morgans, respectively; and for cows, the map length dropped to 23.6, 23.4 and 22.6 Morgans for the three genotypes, respectively. These results also confirmed the previous association of SNP rs110661033 with genome-wide recombination rates with the minor allele (linked with allele 5) increasing recombination rate.42 For both males and females, the largest difference in recombination rate between PRDM9 alleles fell into the two recombination peak regions, with animals carrying two copies of allele 5 having highest recombination rate and animals carrying other alleles showing lower recombination rates (Fig. 2c and d). Interestingly, animals carrying one copy of allele 5 (heterozygote) have recombination rates in between the two homozygotes, but are closer to allele 5 homozygous animals, especially in the recombination peak regions. Since allele 5 clearly stands out from the rest PRDM9 alleles in protein composition and recombination patterns, we generated three recombination maps for the three genotypes of allele 5 and non-allele 5 in each of the two sexes (Supp_Data_1).
3.3. PRDM9 allele-specific recombination maps in Jersey
The 17 sequenced Jerseys had four PRDM9 alleles (alleles 1–4) and seven genotype combinations (Supplementary Table S3). Similarly, we evaluated the LD patterns between PRDM9 alleles and nearby SNPs or haplotypes in the Jersey samples and identified allele-tagging markers for Jersey (Supplementary Table S6). As the genotyped pedigree is smaller in Jersey than in Holstein, we focused on allele 2 that had enough data to study allele-specific recombination maps. In total, 11 of 17 animals with allele 2 carry at least one minor allele of SNP Hapmap26498-BTA-33060. An association test further confirmed the correlation between this SNP and genome-wide hotspot usage in Jersey (P = 5.4 × 10⁻³). Note that this SNP was not linked with allele 2 in Holsteins, possibly due to different LD patterns between cattle breeds. Using this tagging marker of allele 2 (MAF = 41%), we assembled 26, 945, 71, 726 and 52, 870 three-generation families for allele 2 homozygote, allele 2 heterozygote and non-allele 2 homozygote genotypes, respectively. Among these families, 3,959, 5,660 and 2,106 were genotyped by 50 K SNP chips in males, and 1,016, 1,214 and 262 genotyped by 50 K chips in females. The male map lengths are 23.3, 23.6 and 24.1 Morgans for allele 2 homozygote, allele 2 heterozygote and non-allele 2 genotypes, respectively; while female maps are 22.0, 22.0 and 22.6 Morgans in length, respectively (Supplementary Fig. S8). Consistent with the patterns found in Holstein, main differences between PRDM9 alleles in Jersey were also found in the two recombination peak regions: in the centromere peak region, allele 2 homozygote map had the lowest recombination rate in both males and females; and in the telomere region, allele 2 carriers had the lowest recombination rate in females and was close to the lowest in males. Note that recombination rate in Jersey is in general slightly smaller than that in Holstein, likely due to lower polymorphism levels of markers in Jersey as the SNP chips were originally designed for Holstein.
3.4. PRDM9 allele-specific hotspot regions
Recombination rates were calculated between consecutive SNPs for animals that carry different PRDM9 alleles, showing allele-specific distributions of recombination across the cattle genome (Fig. 3). We here used the term ‘hotspot region’ instead of ‘hotspot’ because our SNP intervals were much larger (average 44 Kb) than typical recombination hotspot regions in human and mouse studies. We focused on the most distinct PRDM9 alleles in this analysis, allele 5 and non-allele 5. To find allele-specific hotspot regions for allele 5 and non-allele 5, we applied a χ2 test to identify SNP intervals with significantly different recombination rate between the three genotypes of allele 5 and non-allele 5 in both sexes of Holstein (Fig. 3; Tables 1 and 2). Based on the genome-wide significance level of 8.3 × 10⁻⁷ after Bonferroni correction, in males, we identified seven SNP intervals with different recombination rate between allele 5 homozygote and non-allele 5 genotypes, 369 intervals between allele 5 heterozygote and non-allele 5 genotypes, and only 1 interval between allele 5 homozygote and allele 5 heterozygote, respectively. In females, the numbers of intervals with different recombination rate between the three genotypes were 2, 36 and 0, respectively. The different number of identified intervals for these comparisons reflected different sample sizes and statistical power, because the recombination data involved more bulls than cows and had more animals carrying non-allele 5 than allele 5. To account for the issue of unbalanced sample sizes, we adopted multiple evidence to select the most significant allele-specific hotspot regions of allele 5:(1) Same direction of the difference in recombination rate for males and females, (2) Small P-value for the comparison between allele 5 homozygote and non-allele 5 genotype, and (3) Small P-value in the comparison of allele 5 heterozygote versus allele 5 homozygote or non-allele 5 genotype. For non-allele 5, we dropped the comparison between allele 5 homozygote and non-allele 5 genotype due to the limited sample sizes and low statistical power.
Figure 3.

PRDM9 allele 5 dependent recombination hotspots in two sexes. (a) Non-allele 5 v.s. allele 5 homozygote in males. (b) Non-allele 5 v.s. allele 5 homozygote in females. (c) Non-allele 5 v.s. allele 5 heterozygote in males. (d) Non-allele 5 v.s. allele 5 heterozygote in females. (e) Allele 5 heterozygote v.s. allele 5 homozygote in males. (f) Allele 5 heterozygote v.s. allele 5 homozygote in females. For each panel, recombination rates in each SNP intervals of two groups were shown in the top half and corresponding P-values were shown in the bottom half. Different colors were used to distinguish the 29 chromosomes.
Table 1.
Most significant allele 5 specific hotspot regions for males and females in Holstein cattle
| Chr | Start | End | Recombination rate |
Comparison |
||||||
|---|---|---|---|---|---|---|---|---|---|---|
| M0 | M1 | M2 | F0 | F1 | F2 | P-value1 | P-value2 | |||
| 23 | 40,203,865 | 40,236,175 | 0.00061 | 0.00200 | 0.01006 | 0.00061 | 0.00089 | 0.00076 | 1.9 × 10⁻¹⁷ | 9.8 × 10⁻⁵ |
| 13 | 14,923,596 | 15,017,558 | 0.00067 | 0.00281 | 0.00905 | 0.00078 | 0.00314 | 0.00383 | 9.4 × 10⁻¹³ | 1.2 × 10⁻² |
| 4 | 21,160,109 | 21,179,159 | 0.00047 | 0.00050 | 0.00733 | 0.00056 | 0.00062 | 0.00082 | 1.0 × 10⁻¹¹ | 3.1 × 10−09 |
| 1 | 152,566,977 | 152,592,454 | 0.00126 | 0.00252 | 0.00975 | 0.00023 | 0.00030 | 0.00017 | 7.6 × 10⁻⁸ | 1.9 × 10⁻³ |
| 18 | 55,956,772 | 55,983,042 | 0.00041 | 0.00073 | 0.00544 | 0.00048 | 0.00044 | 0.00023 | 3.6 × 10⁻⁷ | 7.1 × 10⁻⁴ |
| 13 | 14,923,596 | 15,017,558 | 0.00067 | 0.00281 | 0.00905 | 0.00078 | 0.00314 | 0.00383 | 2.7 × 10⁻² | 2.4 × 10⁻¹⁴ |
| 18 | 7,014,208 | 7,041,735 | 0.00048 | 0.00220 | 0.00114 | 0.00032 | 0.00157 | 0.00308 | 3.4 × 10⁻³ | 4.2 × 10⁻⁹ |
| 23 | 40,366,428 | 40,416,708 | 0.00062 | 0.00193 | 0.00079 | 0.00059 | 0.00192 | 0.00346 | 2.0 × 10⁻² | 4.1 × 10⁻⁷ |
| 11 | 24,175,823 | 24,193,422 | 0.00025 | 0.00056 | 0.00031 | 0.00029 | 0.00084 | 0.00441 | 5.5 × 10⁻⁷ | 3.2 × 10⁻³ |
| 7 | 34,678,536 | 34,709,628 | 0.00062 | 0.00091 | 0.00075 | 0.00074 | 0.00211 | 0.00349 | 4.8 × 10⁻² | 1.5 × 10⁻⁶ |
Start, End = physical position of hotspot regions on chromosome. M0, M1 and M2 = recombination rates of males with non-allele 5, allele 5 heterozygote and allele 5 homozygote genotypes, respectively. F0, F1 and F2 = female recombination rates. P-value 1= allele 5 homozygote versus non-allele 5 genotype. P-value 2 = allele 5 heterozygote versus non-allele 5 genotype. Top 5 rows are from male results and bottom 5 rows are female hotspots.
Table 2.
Most significant non-allele 5 hotspot regions for males and females in Holstein cattle
| Chr | Start | End | Recombination rate |
Comparison | |||||
|---|---|---|---|---|---|---|---|---|---|
| M0 | M1 | M2 | F0 | F1 | F2 | P-value | |||
| 21 | 67,159,217 | 67,195,140 | 0.00196 | 0.00072 | 0.00011 | 0.00084 | 0.00038 | 0.00035 | 7.4 × 10⁻⁶ |
| 19 | 54,920,324 | 54,947,863 | 0.00216 | 0.00069 | 0.00059 | 0.00072 | 0.00049 | 0.00063 | 3.4 × 10⁻⁷ |
| 4 | 18,380,952 | 18,447,308 | 0.002 | 0.00108 | 0.00057 | 0.0016 | 0.00122 | 0.00095 | 1.3 × 10⁻³ |
| 18 | 624,6055 | 6,275,418 | 0.00155 | 0.00069 | 0.00020 | 0.00092 | 0.00030 | 0.00034 | 6.4 × 10⁻⁴ |
| 2 | 12,415,870 | 12,451,708 | 0.00126 | 0.00068 | 9.45E-05 | 0.00072 | 0.00057 | 0.00014 | 1.2 × 10⁻² |
| 22 | 33,218,085 | 33,245,588 | 0.00048 | 0.00025 | 0.00027 | 0.00171 | 0.00072 | 0.00038 | 6.1 × 10⁻³ |
| 5 | 8,435,987 | 8,476,871 | 0.00079 | 0.00036 | 0.00040 | 0.00119 | 0.00034 | 5.28E-05 | 4.5 × 10⁻³ |
| 7 | 34,269,024 | 34,324,708 | 0.00084 | 0.00047 | 0.00075 | 0.00129 | 0.00062 | 0.00018 | 3.9 × 10⁻² |
| 26 | 26,340,616 | 26,369,697 | 0.00054 | 0.00033 | 0.00038 | 0.00159 | 0.00064 | 0.00051 | 6.3 × 10⁻³ |
| 10 | 7,791,755 | 7,830,003 | 0.00148 | 0.00072 | 0.00043 | 0.0017 | 0.00083 | 0.00068 | 1.6 × 10⁻² |
Start, End = physical position of hotspot regions on chromosome. M0, M1 and M2 = recombination rates of males with non-allele 5, allele 5 heterozygote and allele 5 homozygote genotypes, respectively. F0, F1 and F2 = female recombination rates. P-value = allele 5 heterozygote versus non-allele 5 genotype. Top 5 rows are from male results and bottom 5 rows are female hotspots.
Among the top 5 hotspot regions of allele 5, one hotspot region, located at chr13: 14923596-15017558, is shared between males and females (Table 1). In males, the recombination rate increased 13 fold from 0.0006 to 0.009 between animals with non-allele 5 and two copies of allele 5. In females, animals carrying two copies of allele 5 showed a 5-fold increase. To further investigate the recombination patterns of allele-specific hotspot regions, we zoomed into the local recombination maps of the three PRDM9 genotypes of allele 5 (Supplementary Fig. S9). Generally, for the allele 5 favored hotspot regions, we found a striking peak of the recombination rates of allele 5 compared to other genotypes. As for non-allele 5 hotspot regions, we also observed higher recombination rates for animals carrying alleles other than 5. In both cases, recombination rates of allele 5 heterozygote would mimic either allele 5 or non-allele 5 since the heterozygote animals had both alleles and binding motifs.
3.5. Dominant effect of allele 5 on recombination in two sexes
Using both sharing of recombination hotspot region and correlation in recombination rate, we found animals carrying one copy of allele 5 were more similar to animals with two copies of allele 5 than to animals carrying non-allele 5. To evaluate the sharing of recombination hotspot region, we tentatively defined hotspot regions as the SNP intervals with recombination rate 2.5 S.D greater than the genome-wide average. For Holstein males, a total of 1361, 1353 and 1365 hotspot regions were identified for allele 5 homozygote, allele 5 heterozygote and non-allele 5 animals, respectively. Consistent with observations in human studies,27 each PRDM9 genotype had its unique hotspot regions (Supplementary Fig. S10). Allele 5 homozygote, allele 5 heterozygote and non-allele 5 genotypes each had 887, 737 and 1, 032 unique hotspot regions, with only 97 hotspot regions shared by all three genotypes. Excluding the 97 hotspot regions that were shared by all three genotypes, allele 5 and non-allele 5 had only 47 hotspot regions in common. Consistent with the patterns observed in the global recombination maps, allele 5 heterozygote shared more hotspot regions with allele 5 homozygote than with non-allele 5 genotype (330 vs 189), indicating an observed dominant effect of allele 5. A similar pattern was found in the Holstein cows (Supplementary Fig. S10). Allele 5 homozygote, allele 5 heterozygote and non-allele 5 genotypes each had 801, 583 and 855 allele-specific hotspot regions, with 101 hotspot regions shared across all three genotypes. Excluding the common hotspots, allele 5 homozygote and allele 5 heterozygote genotypes shared 314 hotspot regions, but allele 5 heterozygote and non-allele 5 genotypes had only 260 hotspot regions in common. Using a correlation analysis of recombination rates across three PRDM9 genotypes and two sexes, we found higher correlations between allele 5 homozygote and heterozygote than between allele 5 heterozygote and non-allele 5 in both males and females (Supplementary Fig. S11), confirming the observed dominant effect of allele 5 to other PRDM9 alleles.
3.6. Enrichment of PRDM9 binding motifs in recombination hotspot regions
Using a computational approach designed for ZnF proteins,45 we predicted the binding motifs of the PRDM9 alleles (Supplementary Fig. S6). Since the predicted motifs are almost the same for alleles 1–4, we evaluated the enrichment of PRDM9 binding motifs in recombination hotspot regions by focusing on allele 1 and allele 5. Based on the position weight matrices of the predicted motifs, we extracted the degenerated 17-bp motifs ‘ANNANNANNANNANGGC’ and ‘CGNNANNAGCANNANNA’ for allele 1 and allele 5, respectively. Here, we used allele 1 to represent non-allele 5 alleles because allele 1 was the most frequent and there was little difference in binding motif between allele 1 and other non-allele 5 alleles. In the whole bovine reference genome (UMD 3.1.1), allele 5 motif is 1.17 times more prevalent than allele 1 motif. Compared to this genome-wide baseline ratio of 1.17, non-allele 5 hotspot regions had a decreased ratio of 1.14, and allele 5 hotspot regions had an increased ratio of 1.20 in Holstein males (Supplementary Table S7). When measured in various subsets of hotspot regions, this ratio showed a consistent trend, 1.14 in non-allele 5 and allele 5 heterozygous shared hotspot regions, 1.19 in allele 5 homozygous and allele 5 heterozygous shared hotspot regions, 1.14 in non-allele 5 specific hotspot regions, and 1.21 in allele 5 specific hotspot regions. Similar enrichment trends were observed in females (Supplementary Table S7). Collectively, although we used computationally predicted motifs and our hotspot regions were larger than typical recombination hotspot regions, we did observe an expected trend that allele 5 motif was enriched in allele 5 hotspot regions and allele 1 motif enriched in non-allele 5 hotspot regions.
3.7. Comparison of recombination maps from single sperm-typing and pedigree data
The large pedigree and widely used artificial insemination in cattle provided an opportunity to compare recombination patterns between sperms and live-born offspring. To check the consistency of the recombination patterns inferred from pedigree data, we characterized the recombination patterns of a single Holstein bull using both pedigree and single sperm-typing. The comparison involved 56 high-quality single sperms genotyped on BovineHD (770 K) SNP chip and 556 live-born offspring genotyped with various chips of more than 50 K SNPs (see Materials and methods). Using the same approach of pedigree analysis, we calculated recombination rates in single sperm data between adjacent SNPs on a 50 K SNP chip, so the two recombination maps could be compared with the same number of SNPs. Although sperm data have more SNPs than pedigree data to begin with, the sperm-based recombination map supported the differences between different PRDM9 alleles identified from pedigree data (Supplementary Fig. S12). Overall, recombination rates from the single sperm data (allele1/allele2) showed the highest correlation with the pedigree-based rates from the same bull, and this correlation continuously decreased with recombination maps from animals carrying zero, one and two copies of allele 5 (Supplementary Fig. S12a). As expected, the sperm recombination rates are more similar to male recombination rates than that of females in all groups. In addition, we observed the same trend using the sharing of top 5% recombination intervals between sperm and pedigree data (Supplementary Fig. S12b).
By comparing recombination maps from sperms and pedigree of the same bull, we found the same number but slightly different preferred locations of recombination between sperms and live-born offspring. At the chromosome level, the number of crossovers from pedigree and sperm data were correlated with r = 0.77 across 29 autosomes (Supplementary Fig. S13). Since the sperm data had a higher density of SNPs, we manually decreased the SNP number of sperm data to levels comparable to pedigree data. When using similar numbers of SNPs in both samples (10 K in sperms and 7 K–50 K in pedigree), we saw no difference in the total number of recombination events: 21.91 ± 0.5 SE (±3.8 SD) in sperms and 21.65 ± 0.12 SE (±3.8 SD) in pedigree data (Supplementary Fig. S14). To compare the patterns of recombination in pedigree and sperm data, we generated global recombination maps by collapsing all 29 autosomes into a standardized chromosome (Fig. 4). Overall, the pedigree and sperm recombination maps showed a very similar pattern except near the two ends of chromosomes (standardized locations 10%–20% and >80% on a chromosome). At the beginning of a chromosome (10%–20%), the pedigree-based map exhibited a higher recombination rate than the sperm-based map. To the end of a chromosome (>80%), the recombination rate of sperms reached a peak near the 85% of a chromosome, whereas the pedigree-based recombination rate continuously increased to the end of chromosomes. To avoid potential biases from SNP coverage in sperms, we checked the distribution of SNP numbers along the genome and found no clear deficiency of SNPs to the two ends of chromosomes (Supplementary Fig. S15). However, a χ2 test found no significant differences (P > 0.05) at both locations, possibly due to the small number of sperms tested.
Figure 4.
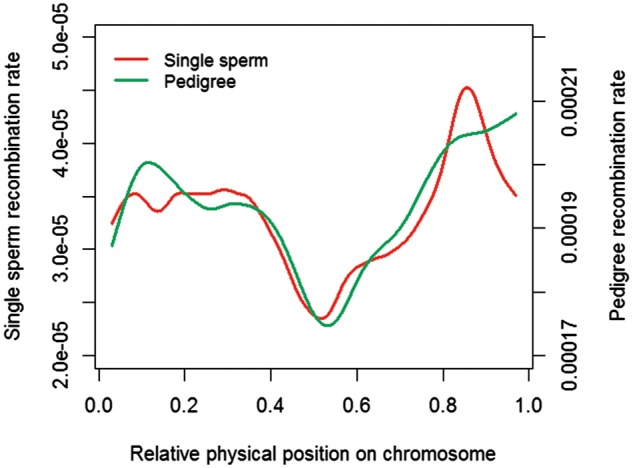
Spline-smoother plot of recombination rate along the chromosome from single sperm data and pedigree data. The relative physical position on a chromosome is used, where zero corresponding to the beginning of a chromosome and one the end. The smooth spline model was fitted across all of the 29 chromosomes. Due to the differences in SNP density, the single sperm and pedigree recombination rates were plotted in different scales.
4. Discussion
The purpose of this study was to characterize PRDM9 allele-specific localizations of meiotic recombination in widely commercialized cattle breeds.20,21 Meiotic recombination is known to enhance genetic and phenotypic variations in sexually reproducing organisms, and PRDM9 regulates the location of double-stranded breaks and thus recombination events in most of the placental mammals.6,7 Recent studies in humans showed that the PRDM9 alleles have dramatic influences on the localization and turnover of the recombination hotspot via increased sequence diversity;27,46 however, it is unclear whether these patterns can also be observed in cattle, which has unique demographic histories and more importantly, persistently succumbed to intense selective pressures in the past 10,000 years after domestication. In addition, multiple recent GWAS studies have identified candidate genes associated with recombination features in cattle, including PRDM9.31,34,47 The present study not only identified the PRDM9 allele-specific variations including the amino acid substitutions at three functionally important sites (i.e., −1, 3, and 6) of the ZnFs but also provided strong evidence of allele-specific localizations of recombination events with most pronounced differences at the two ends of chromosomes in cattle. Importantly, these evidence suggested a specific allele (allele 5) as the causal variant for the PRDM9 association with cattle recombination.
While four out of five PRDM9 alleles were shared between the two cattle breeds and showed similar global recombination patterns, one allele (allele 5) that was unique to Holstein exhibited the highest recombination rates at two recombination peak regions. Interestingly, this pattern is correlated with the observed amino acid substitutions at the functional sites of the PRDM9 ZnFs. In addition, previous studies have reported strong associations between the allele-specific localization and turnover of recombination hotspot regions and the polymorphisms of PRDM9 in humans.8,27,46 Although the diversity levels in PRDM9 alleles and number of ZnF repeats were relatively lower in cattle than primates and rodents,10,11 alleles with unique amino acid substitutions appeared to have dramatic differences in the binding-specificity and the distribution of recombination events. For instance, as observed in this study, animals that carry allele 5 have unique recombination hotspot regions that are distinguishable from hotspot regions modulated by non-allele 5, consistent with studies in humans.27,46 As the PRDM9 ZnFs were predicted to bind sequence motifs that are enriched in recombination hotspot,48,49 one might speculate uneven distributions of binding affinities of the PRDM9 alleles across the cattle genome. Computationally, we predicted two17-bp motifs ‘CGNNANNAGNANNANNA’ and ‘ANNANNANNANNANGGC’ of the most common allele (i.e. allele 1) and allele 5, respectively. We also reported consistent enrichment patterns of these binding motifs in corresponding recombination hotspot regions. Collectively, these variations in PRDM9 ZnFs are associated with the location and intensity of recombination in cattle. However, due to the limited resolution of SNP densities, the strength of enrichment is relatively low and the predicted binding motifs need to be further validated in future experiments.
Given the fact that sampling and genotype errors may potentially bias the pedigree-based results, we further confirmed our findings using a single-sperm genomics approach.36,38 Although the genome-wide recombination rates from these two approaches were consistent, we found some differences, especially at the two locations of recombination peaks, between the pedigree and sperm-based recombination maps. These findings were in agreement with the previous studies in humans, which showed that although the recombination maps from the pedigree and sperm-typing methods are largely consistent, considerable differences were observed at a higher resolution. Since the sperms used in the present study were active and viable, the differences in fitness before fertilization are small between the sperm samples and the sperms that ended up in live-born offspring. However, different fitness between sperms and live-born offspring may still lie in the selection process between sperm-egg fertilization and embryo development till birth. Although it is intuitively unclear as to what factors drive such differences, based on our results and previous reports,40 we postulate the differences in sperm fitness during and after fertilization to be one of the plausible explanations.
5. Conclusions
Taken together, in this study, we characterized the PRDM9 sequence diversity in multiple cattle breeds and generated PRDM9 allele-specific global and local recombination maps in individual bulls. The large cattle pedigree provided us the power to show differences in genome-wide recombination maps of PRDM9 alleles. For the first time, we showed the impact of PRDM9 on the global distribution of recombination on the genome, particularly in the telomere and centromere regions. Using genome-wide single sperm genotyping, we validated the quality of pedigree-based recombination maps. Collectively, these results will provide new insights into the regulatory functions of PRDM9 on meiotic recombination, which further contribute to our understanding of genome evolution in mammals.
Declarations
Ethics approval and consent to participate
The need for ethics approval was waived as the current study didn’t involve whole animals.
Consent for publication
Not applicable.
Availability of data and material
The data that support the results of this research are available within the article and its Supplementary Information files. All other sequence data can be tracked in a Supplementary file (Supp_Data_2). The single sperm microarray data are submitted to GEO under the accession number GSE99620.
Authors' contributions
GL and LM conceived the study. YZ, BS, JJ and AP analyzed and interpreted data. YZ, BS and LM wrote the manuscript. KP, BPT, AO, CGS, HC and JBC contributed tools and materials. All authors read and approved the final manuscript.
Supplementary Material
Acknowledgements
We thank two anonymous reviewers for the constructive comments that have improved the manuscript. We thank Reuben Anderson and Alexandre Dimitriv for technical assistance. The Council on Dairy Cattle Breeding (Bowie, MD) and the Cooperative Dairy DNA Repository (Columbia, MO) are also acknowledged for providing data used in this study.
Accession number
Conflict of interest
AO and CS are employees of Select Sires, Inc. All other authors declare that they have no competing interests.
Funding
This work was supported in part by AFRI grant Nos. 2011-67015-30183, 2013-67015-20951 and 2016-67015-24886 from the USDA NIFA and grant No. US-4997-17 from the US-Israel Binational Agricultural Research and Development Fund. JBC and GEL were also supported by appropriated projects 1265-31000-096-00, ‘Improving Genetic Predictions in Dairy Animals Using Phenotypic and Genomic Information’, and 8042-31000-104-00, ‘Enhancing Genetic Merit of Ruminants Through Genome Selection and Analysis’, of the Agricultural Research Service of the United States Department of Agriculture, respectively. Mention of trade names or commercial products in this article is solely for the purpose of providing specific information and does not imply recommendation or endorsement by the US Department of Agriculture. The USDA is an equal opportunity provider and employer. The funders had no role in study design, data collection and analysis, decision to publish, or preparation of the manuscript.
Supplementary data
Supplementary data are available at DNARES online.
References
- 1. Barton N.H., Charlesworth B.. 1998, Why sex and recombination?, Science, 281, 1986–90. [PubMed] [Google Scholar]
- 2. Stumpf M.P., McVean G.A.. 2003, Estimating recombination rates from population-genetic data, Nat. Rev. Genet., 4, 959–68. [DOI] [PubMed] [Google Scholar]
- 3. Kauppi L., Jeffreys A.J., Keeney S.. 2004, Where the crossovers are: recombination distributions in mammals, Nat. Rev. Genet., 5, 413–24. [DOI] [PubMed] [Google Scholar]
- 4. Coop G., Przeworski M.. 2007, An evolutionary view of human recombination, Nat. Rev. Genet., 8, 23–34. [DOI] [PubMed] [Google Scholar]
- 5. Paigen K., Petkov P.. 2010, Mammalian recombination hot spots: properties, control and evolution, Nat. Rev. Genet., 11, 221–33. [DOI] [PMC free article] [PubMed] [Google Scholar]
- 6. Parvanov E.D., Petkov P.M., Paigen K.. 2010, Prdm9 controls activation of mammalian recombination hotspots, Science, 327, 835. [DOI] [PMC free article] [PubMed] [Google Scholar]
- 7. Baudat F., Buard J., Grey C., et al. 2010, PRDM9 is a major determinant of meiotic recombination hotspots in humans and mice, Science, 327, 836–840. [DOI] [PMC free article] [PubMed] [Google Scholar]
- 8. Berg I.L., Rita N., Lam K.W.G., et al. 2010, PRDM9 variation strongly influences recombination hot-spot activity and meiotic instability in humans, Nat. Genet., 42, 859–863. [DOI] [PMC free article] [PubMed] [Google Scholar]
- 9. Myers S., Bowden R., Tumian A., et al. 2010, Drive against hotspot motifs in primates implicates the PRDM9 gene in meiotic recombination, Science, 327, 876–879. [DOI] [PMC free article] [PubMed] [Google Scholar]
- 10. Kono H., Tamura M., Osada N., et al. 2014, Prdm9 polymorphism unveils mouse evolutionary tracks, DNA Res., 21, 315–326. [DOI] [PMC free article] [PubMed] [Google Scholar]
- 11. Schwartz J.J., Roach D.J., Thomas J.H., Shendure J.. 2014, Primate evolution of the recombination regulator PRDM9, Nat. Commun., 5, 4370. [DOI] [PMC free article] [PubMed] [Google Scholar]
- 12. Ahlawat S., Sharma P., Sharma R., et al. 2016, Evidence of positive selection and concerted evolution in the rapidly evolving PRDM9 zinc finger domain in goats and sheep, Anim. Genet., 47, 740–751. [DOI] [PubMed] [Google Scholar]
- 13. Ponting C.P. 2011, What are the genomic drivers of the rapid evolution of PRDM9? Trends Genet., 27, 165–171. [DOI] [PubMed] [Google Scholar]
- 14. Lesecque Y., Glémin S., Lartillot N., Mouchiroud D., Duret L., Coop G.. 2014, The Red Queen model of recombination hotspots evolution in the light of archaic and modern human genomes, PLoS Genet., 10, e1004790. [DOI] [PMC free article] [PubMed] [Google Scholar]
- 15. Buard J., Rivals E., Dunoyer de Segonzac D., et al. 2014, Diversity of Prdm9 zinc finger array in wild mice unravels new facets of the evolutionary turnover of this coding minisatellite, PLoS One, 9, e85021. [DOI] [PMC free article] [PubMed] [Google Scholar]
- 16. Axelsson E., Webster M.T., Ratnakumar A., Ponting C.P., Lindblad-Toh K., Consortium L.. 2012, Death of PRDM9 coincides with stabilization of the recombination landscape in the dog genome, Genome Res., 22, 51–63. [DOI] [PMC free article] [PubMed] [Google Scholar]
- 17. Auton A., Li Y.R., Kidd J., et al. 2013, Genetic recombination is targeted towards gene promoter regions in dogs, PLoS Genet., 9, e1003984. [DOI] [PMC free article] [PubMed] [Google Scholar]
- 18. Ahlawat S., Sharma P., Sharma R., Arora R., De S., Fugmann S. D.. 2016, Zinc finger domain of the PRDM9 gene on chromosome 1 exhibits high diversity in ruminants but its paralog PRDM7 contains multiple disruptive mutations, PLoS One, 11, e0156159. [DOI] [PMC free article] [PubMed] [Google Scholar]
- 19. Padhi A., Shen B., Jiang J., Zhou Y., Liu G.E., Ma L.. 2017, Ruminant-specific multiple duplication events of PRDM9 before speciation, BMC Evol. Biol., 17, 79. [DOI] [PMC free article] [PubMed] [Google Scholar]
- 20. Loftus R.T., MacHugh D.E., Bradley D.G., Sharp P.M., Cunningham P.. 1994, Evidence for two independent domestications of cattle, Proc. Natl. Acad. Sci., 91, 2757–2761. [DOI] [PMC free article] [PubMed] [Google Scholar]
- 21. Boitard S., Rodriguez W., Jay F., Mona S., Austerlitz F.. 2016, Inferring population size history from large samples of genome-wide molecular data-an approximate Bayesian computation approach, PLoS Genet., 12, e1005877. [DOI] [PMC free article] [PubMed] [Google Scholar]
- 22. Kong A., Thorleifsson G., Gudbjartsson D.F., et al. 2010, Fine-scale recombination rate differences between sexes, populations and individuals, Nature, 467, 1099–1103. [DOI] [PubMed] [Google Scholar]
- 23. Shifman S., Bell J.T., Copley R.R., et al. 2006, A high-resolution single nucleotide polymorphism genetic map of the mouse genome, PLoS Biol., 4, e395. [DOI] [PMC free article] [PubMed] [Google Scholar]
- 24. Hunter C.M., Huang W., Mackay T.F.C., Singh N.D., Sekelsky J.. 2016, The genetic architecture of natural variation in recombination rate in Drosophila melanogaster, PLoS Genet., 12, e1005951. [DOI] [PMC free article] [PubMed] [Google Scholar]
- 25. Nachman M.W., Payseur B.A.. 2012, Recombination rate variation and speciation: theoretical predictions and empirical results from rabbits and mice, Philos. Trans. R. Soc. B, 367, 409–421. [DOI] [PMC free article] [PubMed] [Google Scholar]
- 26. Balcova M., Faltusova B., Gergelits V., et al. 2016, Hybrid sterility locus on chromosome X controls meiotic recombination rate in mouse, PLoS Genet., 12, e1005906. [DOI] [PMC free article] [PubMed] [Google Scholar]
- 27. Pratto F., Brick K., Khil P., Smagulova F., Petukhova G.V., Camerini-Otero R.D.. 2014, Recombination initiation maps of individual human genomes, Science, 346, 1256442. [DOI] [PMC free article] [PubMed] [Google Scholar]
- 28. Baker C.L., Kajita S., Walker M., et al. 2015, PRDM9 drives evolutionary erosion of hotspots in Mus musculus through haplotype-specific initiation of meiotic recombination, PLoS Genet., 11, e1004916. [DOI] [PMC free article] [PubMed] [Google Scholar]
- 29. Payseur B.A. 2016, Genetic links between recombination and speciation, PLoS Genet., 12, e1006066. [DOI] [PMC free article] [PubMed] [Google Scholar]
- 30. Davies B., Hatton E., Altemose N., et al. 2016, Re-engineering the zinc fingers of PRDM9 reverses hybrid sterility in mice, Nature, 530, 171–176. [DOI] [PMC free article] [PubMed] [Google Scholar]
- 31. Ma L., O'Connell J.R., VanRaden P.M., et al. 2015, Cattle sex-specific recombination and genetic control from a large pedigree analysis, PLoS Genet., 11, e1005387. [DOI] [PMC free article] [PubMed] [Google Scholar]
- 32. Jensen-Seaman M.I., Furey T.S., Payseur B.A., et al. 2004, Comparative recombination rates in the rat, mouse, and human genomes, Genome Res., 14, 528–538. [DOI] [PMC free article] [PubMed] [Google Scholar]
- 33. Paigen K., Szatkiewicz J.P., Sawyer K., et al. 2008, The recombinational anatomy of a mouse chromosome, PLoS Genet., 4, e1000119. [DOI] [PMC free article] [PubMed] [Google Scholar]
- 34. Kadri N.K., Harland C., Faux P., et al. 2016, Coding and noncoding variants in HFM1, MLH3, MSH4, MSH5, RNF212, and RNF212B affect recombination rate in cattle, Genome Res., 26, 1323–1332. [DOI] [PMC free article] [PubMed] [Google Scholar]
- 35. Hubert R., MacDonald M., Gusella J., Arnheim N.. 1994, High resolution localization of recombination hot spots using sperm typing, Nat. Genet., 7, 420–424. [DOI] [PubMed] [Google Scholar]
- 36. Wang J., Fan H.C., Behr B., Quake S. R.. 2012, Genome-wide single-cell analysis of recombination activity and de novo mutation rates in human sperm, Cell, 150, 402–412. [DOI] [PMC free article] [PubMed] [Google Scholar]
- 37. Clark A.G., Wang X., Matise T.. 2010, Contrasting methods of quantifying fine structure of human recombination, Annu. Rev. Genom. Hum. Genet., 11, 45. [DOI] [PMC free article] [PubMed] [Google Scholar]
- 38. Lu S., Zong C., Fan W., et al. 2012, Probing meiotic recombination and aneuploidy of single sperm cells by whole-genome sequencing, Science, 338, 1627–1630. [DOI] [PMC free article] [PubMed] [Google Scholar]
- 39. Hubbard T., Barker D., Birney E., et al. 2002, The Ensembl genome database project, Nucl. Acids Res., 30, 38–41. [DOI] [PMC free article] [PubMed] [Google Scholar]
- 40. Ye J., Coulouris G., Zaretskaya I., Cutcutache I., Rozen S., Madden T.L.. 2012, Primer-BLAST: a tool to design target-specific primers for polymerase chain reaction, BMC Bioinformatics, 13, 1. [DOI] [PMC free article] [PubMed] [Google Scholar]
- 41. Zimin A.V., Delcher A.L., Florea L., et al. 2009, A whole-genome assembly of the domestic cow, Bos taurus, Genome Biol., 10(1), R42. [DOI] [PMC free article] [PubMed] [Google Scholar]
- 42. Fazakerley D.J., Naghiloo S., Chaudhuri R., et al. 2015, Proteomic analysis of GLUT4 storage vesicles reveals tumor suppressor candidate 5 (TUSC5) as a novel regulator of insulin action in adipocytes, J. Biol. Chem., 290, 23528–23542. [DOI] [PMC free article] [PubMed] [Google Scholar]
- 43. R, CT. 2014, R: a language and environment for statistical computing, Vienna, Austria: R Foundation Stat. Comput., 5, 299–314. [Google Scholar]
- 44. Oliver P.L., Goodstadt L., Bayes J.J., et al. 2009, Accelerated evolution of the Prdm9 speciation gene across diverse metazoan taxa, PLoS Genet., 5, e1000753. [DOI] [PMC free article] [PubMed] [Google Scholar]
- 45. Persikov A.V., Singh M.. 2014, De novo prediction of DNA-binding specificities for Cys2His2 zinc finger proteins, Nucl. Acids Res., 42, 97–108. [DOI] [PMC free article] [PubMed] [Google Scholar]
- 46. Smagulova F., Brick K., Pu Y., Camerini-Otero R.D., Petukhova G.V.. 2016, The evolutionary turnover of recombination hot spots contributes to speciation in mice, Genes Dev., 30, 266–280. [DOI] [PMC free article] [PubMed] [Google Scholar]
- 47. Sandor C., Li W., Coppieters W., et al. 2012, Genetic variants in REC8, RNF212, and PRDM9 influence male recombination in cattle, PLoS Genet., 8, e1002854. [DOI] [PMC free article] [PubMed] [Google Scholar]
- 48. Ségurel L., Leffler E.M., Przeworski M.. 2011, The case of the fickle fingers: how the PRDM9 zinc finger protein specifies meiotic recombination hotspots in humans, PLoS Biol., 9, e1001211. [DOI] [PMC free article] [PubMed] [Google Scholar]
- 49. Grey C., Barthès P., Chauveau-Le Friec G., et al. 2011, Mouse PRDM9 DNA-binding specificity determines sites of histone H3 lysine 4 trimethylation for initiation of meiotic recombination, PLoS Biol., 9, e1001176. [DOI] [PMC free article] [PubMed] [Google Scholar]
Associated Data
This section collects any data citations, data availability statements, or supplementary materials included in this article.