Publisher's Note: There is a Blood Commentary on this article in this issue.
Key Points
Cancer gene mutations affect treatment response and survival in patients with CLL treated with lenalidomide.
The assessment of cancer gene mutations may be useful in the risk stratification of CLL patients.
Abstract
Lenalidomide is clinically active in chronic lymphocytic leukemia (CLL), but its effectiveness in the context of the CLL mutational landscape is unknown. We performed targeted capture sequencing of 295 cancer genes in specimens from 102 CLL patients with treatment-naïve disease (TN patients) and 186 CLL patients with relapsed/refractory disease (R/R patients) who received lenalidomide-based therapy at our institution. The most frequently mutated gene was SF3B1 (15%), followed by NOTCH1 (14%) and TP53 (14%), with R/R patients having significantly more TP53 mutations than did TN patients. Among all lenalidomide-treated patients, del(17p) (P ≤ .001), del(11q) (P = .032), and complex karyotype (P = .022), along with mutations in TP53 (P ≤ .001), KRAS (P = .034), and DDX3X (P ≤ .001), were associated with worse overall response (OR). R/R patients with SF3B1 and MGA mutations had significantly worse OR (P = .025 and .035, respectively). TN and R/R patients with del(17p) and TP53 mutations had worse overall survival (OS) and progression-free survival (PFS). In R/R patients, complex karyotype and SF3B1 mutations were associated with worse OS and PFS; DDX3X mutations were associated with worse PFS only. Weibull regression multivariate analysis revealed that TP53 aberrations (del(17p), TP53 mutation, or both), along with complex karyotype and SF3B1 mutations, were associated with worse OS in the R/R cohort. Taken together, cancer gene mutations in CLL contribute to the already comprehensive risk stratification and add to prognosis and response to treatment. The related trials were registered at www.clinicaltrials.gov as #NCT00267059, #NCT00535873, #NCT00759603, #NCT01446133, and #NCT01002755.
Introduction
Chronic lymphocytic leukemia (CLL) is a heterogeneous disease owing to various chromosomal and mutational abnormalities that affect time to first treatment, response to treatment, and overall survival. Initial CLL prognostication schemas, such as the Rai and Binet staging systems, used clinical information such as the complete blood count, the number of lymph nodes involved, and liver/spleen involvement for risk stratification. More recently, CLL prognostication has incorporated immunohistochemistry for ZAP70 and CD38 protein expression and for canonical cytogenetic and mutational abnormalities that include del(11q), del(13q), del(17p), tri(12), complex karyotype, and IGHV mutations.1,2 Adding to this already comprehensive risk stratification, massively parallel DNA-sequencing technology has enabled identification of several novel somatic mutations in CLL that are associated with poor outcomes3-7; for example, TP53, SF3B1, KRAS, and POT1 mutations not only portend worse response to chemoimmunotherapy but also correlate with worse survival outcomes.4,6,7 While an ever-expanding catalog of cancer gene mutations in CLL has deepened our understanding of CLL biology, it has also uncovered the remarkable complexity of the CLL genome and its molecular heterogeneity. The challenge ahead is to navigate and understand this complex network of genomic abnormalities and their association among clinical phenotypes, response to therapies, and long-term outcomes.
In a previous study, whole exome sequencing (WES) of 538 CLL samples revealed IKZF3 L162R hotspot mutations in 2% of patients.6 This mutation affects the highly conserved second zinc finger domain of IKZF3 and has been found in vitro to cause lenalidomide resistance by decreasing the lenalidomide-induced ubiquitination and degradation of the protein.8 Since 2005, a large cohort of CLL patients at our institution have been treated on clinical trials of lenalidomide-based therapy, which have shown the efficacy of the drug against CLL.9-13 Therefore, we have a well-established cohort and the samples necessary to further investigate the connection between IKZF3 mutations and lenalidomide resistance. Although this was our initial motivation to conduct the study, this group of patients also enabled us to further investigate 1) the landscape of CLL gene mutations in patients with treatment-naïve disease (TN patients) and patients with relapsed/refractory disease (R/R patients), 2) the association between CLL gene mutations and clinical characteristics, and 3) the predictive and prognostic impact of other CLL mutations in the context of lenalidomide-based therapy.
Methods
Patients and samples
The study included 288 CLL patients enrolled in clinical trials of lenalidomide-based therapy conducted at our institution between 2005 and 2014. Bone marrow aspiration samples (n = 211) or peripheral blood samples (n = 77) obtained prior to the start of therapy were used in this study. These samples’ percentages of CLL cells were estimated by assessing CD5/CD19/CD23-positive cells with multicolor flow cytometry; the samples’ median percentage of CLL cells was 89% (interquartile range [IQR], 73% to 94%). All patients provided written informed consent for the sample collection and analysis. The study protocol was approved by MD Anderson’s institutional review board and adhered to the Declaration of Helsinki.
Therapy
Ninety-two patients received lenalidomide as monotherapy, and 196 received lenalidomide in combination with an anti-CD20 antibody (rituximab or ofatumumab) in clinical trials (supplemental Table 1, available on the Blood Web site). These trials’ study designs, eligibility criteria, and treatment plans have been described previously.10-12,14,15 Briefly, in the monotherapy trials, lenalidomide was started on day 1 with either 5 mg orally daily or 10 mg orally daily and was titrated up to 25 mg orally daily as tolerated. In the combination-therapy trials, lenalidomide was started on day 9 with 10 mg orally daily; rituximab was administered intravenously at a dose of 375 mg/m2 on days 1, 8, 15, and 22 during the first cycle and on day 1 during cycles 3 to 12, or ofatumumab was administered intravenously at a dose of 300 mg on day 1 and a dose of 1000 mg on days 8, 15, and 22 during the first cycle, on day 1 of cycles 3 to 6, and on day 1 of every other cycle during cycles 7 to 24.
Treatment response criteria and survival outcome evaluation
The clinical response to therapy was defined as the best response recorded during treatment and was classified according to guidelines from the 2008 International Workshop on CLL criteria.16 Patients who stopped therapy before the 3-month evaluation were considered nonevaluable for treatment response but were included in the intention-to-treat analysis for survival outcomes. Event-free survival (EFS) was defined as the time from the start of therapy to the time of death, disease progression, initiation of the next therapy, or last follow-up. Overall survival (OS) was defined as the time from the start of therapy to the time of death or last follow-up.
Targeted capture sequencing of 295 genes
We performed targeted capture sequencing of 295 genes in the leukemia samples, as has been described previously.17 Briefly, we designed a SureSelect custom panel of 295 genes (Agilent Technologies, Santa Clara, CA) that are recurrently mutated in hematologic malignancies (supplemental Table 2). This list covered a large portion of the recurrent somatic mutations previously reported in CLL, except for RPS15. Extracted genomic DNA was fragmented and bait-captured according to manufacturer protocols. Captured DNA libraries were then sequenced using a HiSeq 2000 sequencer (Illumina, San Diego, CA) with 76-bp paired-end reads.
Variant calling and detection of high-confidence cancer gene mutations
We identified high-confidence somatic cancer gene mutations in the bone marrow and blood samples, as has been described previously.17 Briefly, we used modified Mutect18 and Pindel19 algorithms against a pooled common normal reference to call high-confidence cancer gene mutations in the samples. The variant filtering and confidence level annotation are described in greater detail in the supplemental Methods.
Estimation of copy number alteration
Our 295-gene panel included approximately 1000 cytosingle nucleotide polymorphism positions distributed evenly across the genome, which enabled us to estimate genome-wide copy number alterations (CNAs).20 We estimated CNAs from reads using functions of an in-house R package, which could extract quality reads for each of the capture regions and then calculate the log2 ratios against the pooled common normal reference after adjusting for the total library size.21 The resulting log2 ratios were subjected to segmentation using circular binary segmentation of the DNA copy package.21
Statistical analysis
We used odds ratios (OD) to assess associations between gene mutations and overall response (OR) or complete response (CR) and used the Fisher exact test to determine significance. To avoid the infinity OD value, we added 0.5 to cells in the contingency table that did not provide events. The Student t test or Mann-Whitney U test was used to examine the statistical significance of continuous variables. For the univariable survival analysis, the Kaplan-Meier method was used to estimate survival outcomes, and the log-rank test was used to examine between-groups differences in survival outcomes. Multivariable analysis was conducted using the Weibull regression method. Statistical analyses were performed in R (version 3.2.0). To avoid the problem of multiplicity, we used the Benjamini and Hochberg method to correct adjusted P values/q values.22 Adjusted P values/q values less than .05 were considered statistically significant.
Results
Clinical characteristics of 288 CLL patients treated with lenalidomide
The baseline clinical characteristics of the 288 CLL patients (102 TN and 186 R/R patients) are summarized in Table 1. Age, gender, disease stage, Eastern Cooperative Oncology Group (ECOG) performance status, and baseline laboratory data were similar between the TN and R/R groups. High-risk features such as unmutated IGHV, ZAP-70 protein expression, del(17p),1 and complex karyotype (defined as ≥3 cytogenetic abnormalities) were more prevalent in the R/R cohort than in the TN cohort. The median number of prior treatments for the R/R cohort was 2 (IQR, 1-4). For TN patients, the median time from initial diagnosis to the time of presentation to our institution was 5.2 months (IQR, 1.4-23.1 months).
Table 1.
Baseline patient characteristics
| Variable | Patients with treatment-naïve disease | Patients with relapsed/refractory disease | Total |
|---|---|---|---|
| Patients, n | 102 | 186 | 288 |
| Median age (range), y | 67 (41-83) | 62 (33-85) | 65 (33-85) |
| Sex, n (%) | |||
| Female | 40 (39) | 49 (26) | 89 (31) |
| Male | 62 (61) | 137 (74) | 199 (69) |
| Binet stage, n (%) | |||
| A | 32 (31) | 61 (33) | 93 (32) |
| B | 36 (35) | 71 (38) | 107 (37) |
| C | 32 (31) | 52 (28) | 84 (29) |
| Unknown | 2 (3) | 2 (1) | 4 (2) |
| ECOG performance score, n (%) | |||
| 0 | 38 (37) | 54 (29) | 92 (32) |
| 1 | 59 (58) | 123 (66) | 182 (63) |
| 2 | 4 (4) | 6 (3) | 10 (3) |
| Unknown | 1 (1) | 3 (2) | 4 (2) |
| IGHV status, n (%) | |||
| Unmutated | 51 (50) | 135 (73) | 186 (65) |
| Mutated | 38 (37) | 33 (18) | 71 (25) |
| Unknown | 13 (13) | 18 (9) | 31 (10) |
| Hierarchical model by FISH, n (%) | |||
| Del(17p) | 9 (9) | 33 (18) | 42 (15) |
| Del(11q) | 23 (23) | 45 (24) | 68 (24) |
| Tri(12) | 20 (20) | 25 (13) | 45 (16) |
| Del(13p) | 29 (28) | 40 (22) | 69 (24) |
| None | 17 (17) | 28 (15) | 45 (16) |
| Conventional karyotyping, n (%) | |||
| <3 aberrations | 93 (91) | 149 (80) | 242 (84) |
| ≥3 aberrations (complex) | 9 (9) | 37 (20) | 46 (16) |
| Median baseline laboratory values (range) | |||
| White blood cell count, 109/L | 79.35 (4.9-244.6) | 31.45 (1.9-243.9) | 45.85 (1.9-244.6) |
| Hemoglobin level, g/dL | 12.2 (8.9-16.4) | 12.55 (8.2-16.5) | 12.4 (8.2-16.5) |
| Platelet count, 109/L | 147.5 (45-464) | 119.5 (22-494) | 126.5 (22-494) |
| β2M level, mg/L | 3.9 (1.4-10.5) | 4.1 (1.5-18.3) | 4 (1.4-18.3) |
| ZAP-70 expression, n (%) | 40 (40) | 20 (11) | 60 (21) |
Landscape of cancer gene mutations in 288 CLL patients
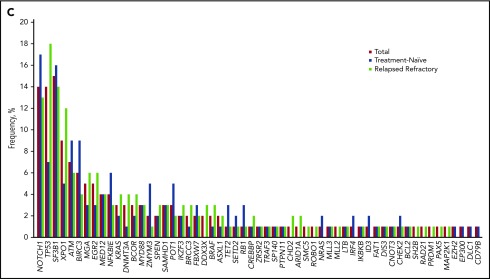
The landscape of the high-confidence cancer gene mutations that were detected in the 288 CLL patients is shown in Figure 1A. Our sequencing platform detected 470 single-nucleotide variants or small indels in 61 genes in 218 patient samples (76%) and detected no cancer gene mutations in 70 patient samples (24%). The median number of mutations detected per patient was 1 (IQR, 0-2), with 1, 2, 3, and ≥4 mutations detected in 24%, 35%, 23%, and 18% of patients, respectively (Figure 1B). The most frequently mutated gene was SF3B1, in 15% of patients, followed by NOTCH1 in 14% of patients and TP53 in 14% of patients; 13 gene mutations were each detected in ≥3% of patients (Figure 1C). IKZF3 mutations were detected in 7 patients (2 TN and 5 R/R patients; 2.4%). All IKZF3 mutations affected the L162 residue in the second zing finger domain (supplemental Table 3).
Figure 1.
Cancer gene mutations in 288 CLL patients. (A) Landscape of genetic mutations detected in 288 CLL patients. Each row represents a somatic gene mutation; each column represents a mutation’s occurrences throughout the patient panel. (B) Percentages of the numbers of mutations per patient among patients who had at least 1 detectable mutation. (C) Frequency of mutations detected by targeted gene sequencing, separated by the disease stage.
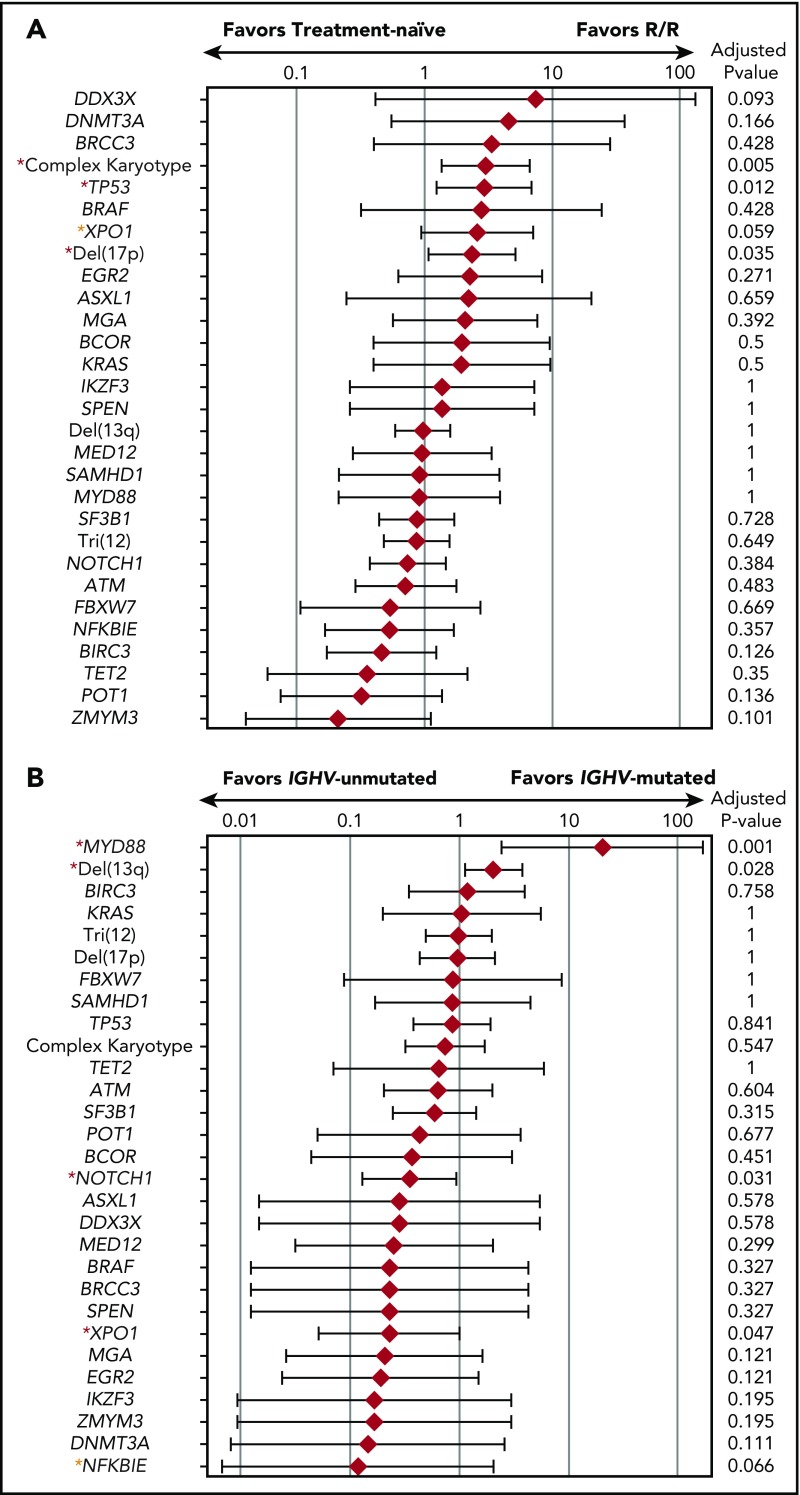
The median number of mutations of the TN patients (1; IQR, 0-2) was not significantly different from that of the R/R patients (1; IQR, 1-2; P = .44). In comparison with the TN cohort, the R/R cohort had a higher rate of complex cytogenetics (P = .006), TP53 mutations (P = .014), and del(17p) (P = .031) (Figure 2A). The R/R group also had a higher rate of XPO1 mutations, but this difference was not statistically significant (P = .062). Other high-frequency mutations such as NOTCH1, SF3B1, ATM, and BIRC3 had similar occurrence rates between the TN and R/R groups (Figure 1C). The median number of mutations of the patients with unmutated IGHV (1; IQR, 1-2) was significantly higher than that of the patients with mutated IGHV (1; IQR, 0-2; P = .002) (supplemental Figure 1). MYD88 mutations were significantly enriched in patients with IGHV mutations (OD, 20.2; 95% CI, 2.44-168; P = .005), whereas NOTCH1 and XPO1 mutations were significantly enriched in patients without IGHV mutations (OD, 0.35; 95% CI, 0.13-0.94; P = .031, and OD, 0.23; 95% CI, 0.05-0.99; P = .047, respectively) (Figure 2B).
Figure 2.
Mutational enrichment in CLL patients. (A) Mutational enrichment in TN CLL patients and R/R CLL patients. Red diamond represents logarithmic OD and bar represents 95% confidence interval (CI). Red asterisks indicate statistically significant differences; yellow asterisks indicate trends toward statistical significance. (B) Mutational enrichment in CLL patients with IGHV mutations and CLL patients without IGHV mutations. Red diamond represents logarithmic OD and bar represents 95% CI. Red asterisks indicate adjusted P value of <.05; yellow asterisks indicate adjusted P value of <.1.
Genome-wide copy number alterations in the CLL genome
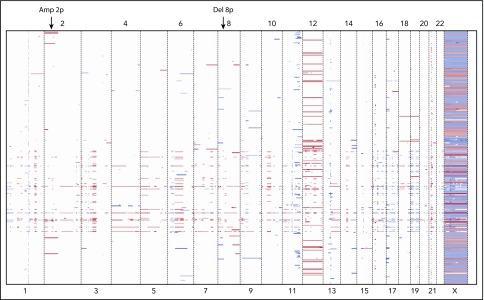
The genome-wide CNAs detected in the 288 bone marrow and blood samples are shown in Figure 3. We found high concordance between fluorescence in situ hybridization (FISH) results and the CNAs that our sequencing platform detected for del(13q), tri(12), del(17p), and del(11p) (supplemental Figure 2). In addition to these commonly detected abnormalities, our panel detected rare but recurrent CNAs in other chromosomal regions such as del(8p) and amp(2p), which were also identified in a previously reported cohort of CLL patients.6
Figure 3.
Heat map of CNAs inferred from targeted gene sequencing in 288 CLL patient samples. Each raw represents patient and column represents chromosome. Red color indicates copy number gain and blue color indicates copy number loss. Abnormalities such as amp(2p) and del(8p) were detected in addition to the chromosomal abnormalities commonly observed in CLL.
Co-occurrence and mutual exclusivity of gene mutations, FISH abnormalities, and standard karyotype
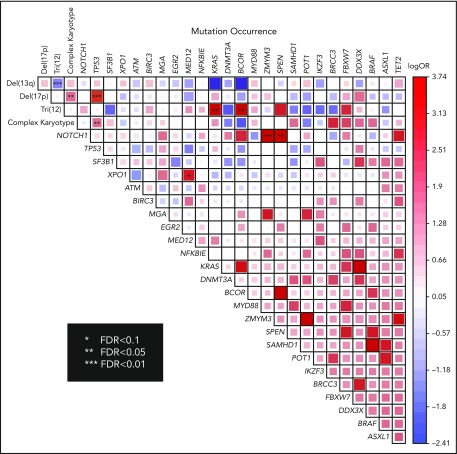
We identified multiple pairwise associations of mutations in our cohort (Figure 4). As was expected, significant co-occurrence was observed between del(17p) and complex karyotype (false discovery rate [FDR] < 0.05) and between del(17p) and TP53 mutations (FDR < 0.01). The significant co-occurrence of tri(12) and KRAS mutations (FDR < 0.05) suggested a cooperative effect between the activating mutation and amplification of the proto-oncogene. We also detected co-occurrence of tri(12) and BCOR mutations (FDR < 0.05), as has been reported previously.6 Other statistically significant mutational co-occurrences included NOTCH1 and ZMYM3 (FDR < 0.01); NOTCH1 and SPEN (FDR < 0.05); and XPO1 and MED12 (FDR < 0.1). Statistically significant mutual exclusion was observed between del(13q) and tri(12) (FDR < 0.01) only.
Figure 4.
Pairwise association of cytogenetic abnormalities and mutations in all patients. The degree of logarithmic odds ratio is shown by color and the size of the box. Red color indicates co-occurence and blue color indicates mutually exclusive pattern. Statistically significant association by FDR is marked by asterisk. FDR, false discovery rate.
Association between gene mutations or FISH abnormalities and response to lenalidomide-based therapy
Among all patients and all treatment modalities, del(17p), del(11q), and complex karyotype, along with TP53, KRAS, and DDX3X mutations, were associated with worse OR (Table 2). Among TN patients, del(17p) and del(11q) were associated with decreased OR, and mutations in TP53 (P = .057) and KRAS (P = .057) trended toward an association with worse OR. None of the TP53 mutated patients attained CR (all were partial response), whereas TP53 wild-type patients had CR in 9 out of 62 (15%) patients. In the R/R cohort, IGHV unmutated status, del(17p) and complex karyotype, along with TP53, MGA, SF3B1, and DDX3X mutations, were associated with worse OR. Despite in vitro evidence of transduced cell lines having resistance to lenalidomide therapy,8 OR of patients with or without IKZF3 mutations did not differ significantly. Of the 7 patients with IKZF3 mutations, 4 had no response to lenalidomide therapy, and 3 had a partial response to the therapy (none had a complete response to therapy).
Table 2.
Likelihood of overall response according to gene mutations and cytogenetic abnormalities
| All patients | Treatment naïve | Relapsed/refractory | |||||||
|---|---|---|---|---|---|---|---|---|---|
| Mutation | OD | 95% CI | P | OD | 95% CI | P | OD | 95% CI | P |
| IGHV unmutated | 0.613 | 0.315-1.19 | .148 | 1.818 | 0.639-5.171 | .262 | 0.310 | 0.111-0.869 | .026 |
| Del(17p) | 0.294 | 0.144-0.601 | <.001 | 0.153 | 0.033-0.711 | .019 | 0.386 | 0.171-0.871 | .031 |
| Del(11q) | 0.510 | 0.284-0.915 | .032 | 0.292 | 0.101-0.842 | .026 | 0.660 | 0.325-1.339 | .275 |
| Tri(12) | 0.961 | 0.491-1.882 | 1.000 | 1.133 | 0.357-3.600 | 1.000 | 0.801 | 0.344-1.866 | .663 |
| Del(13p) | 0.877 | 0.501-1.533 | .672 | 0.810 | 0.290-2.256 | .800 | 0.917 | 0.467-1.800 | .864 |
| TP53 | 0.203 | 0.096-0.427 | <.001 | 0.206 | 0.042-1.009 | .057 | 0.217 | 0.093-0.508 | <.001 |
| Complex karyotype | 0.412 | 0.202-0.840 | .022 | 0.848 | 0.153-4.709 | 1.000 | 0.402 | 0.176-0.917 | .035 |
| ATM | 1.329 | 0.462-3.83 | .800 | 1.147 | 0.219-5.998 | 1.000 | 1.307 | 0.325-5.254 | 1.000 |
| KRAS | 0.176 | 0.033-0.930 | .034 | 0.060 | 0.003-1.293 | .057 | 0.356 | 0.058-2.191 | .348 |
| MGA | 0.377 | 0.122-1.161 | .122 | 2.408 | 0.098-48.532 | 1.000 | 0.214 | 0.053-0.863 | .035 |
| SF3B1 | 0.617 | 0.306-1.246 | .193 | 2.151 | 0.440-10.506 | .502 | 0.368 | 0.155-0.875 | .025 |
| DDX3X | 0.033 | 0.002-0.597 | <.001 | 0.328 | 0.006-17.049 | 1.000 | 0.038 | 0.002-0.692 | .002 |
| IKZF3 | 0.337 | 0.074-1.544 | .213 | 0.312 | 0.019-5.23 | .431 | 0.356 | 0.058-2.19 | .348 |
To investigate the direct association of cancer gene mutations with lenalidomide response, we performed subgroup analysis by treatment modality (lenalidomide alone or lenalidomide plus an anti-CD20 antibody). In the TN cohort, no gene mutations or FISH abnormalities were associated with OR among patients treated with lenalidomide alone or lenalidomide with an anti-CD20 antibody (supplemental Table 4). In the R/R group, the TP53 mutation was the only variable associated with decreased OR among patients treated with lenalidomide only, whereas del(17p) and complex karyotype, along with TP53, MGA, and DDX3X mutations, were associated with decreased OR among patients treated with lenalidomide plus an anti-CD20 antibody.
Association between gene mutations or FISH abnormalities and survival outcomes
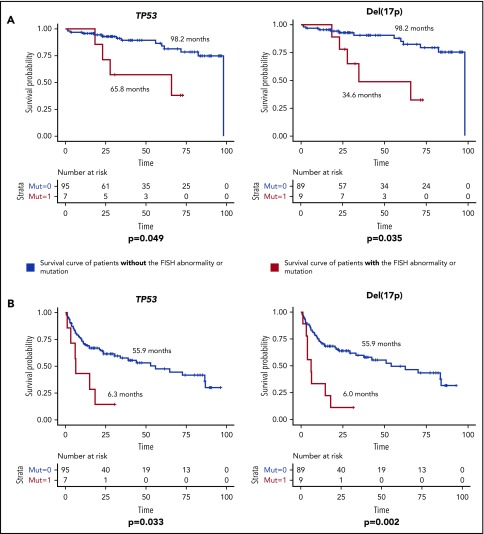
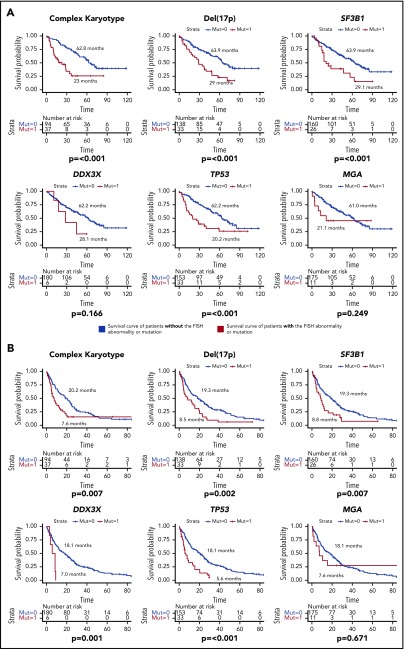
The median follow-up duration was 32.9 months (95% CI, 3.6-96.8 months) for TN patients and 50.9 months (95% CI, 7.7-118.5 months) for R/R patients. The median OS and EFS of all TN patients were 98.2 months (95% CI, unable to estimate) and 52.9 months (95% CI, 26.5-79.3 months), respectively. These outcomes were 61 months (95% CI, 49.3-72.7 months) and 16.8 months (95% CI, 11.8-21.8 months) in the R/R patients. In the TN group, TP53 mutations and del(17p) were associated with significantly decreased median OS and EFS (Figure 5). Out of the 7 TN patients with TP53 mutation, 6 (86%) had a concurrent del(17p) abnormality, whereas 6 out of 9 (67%) del(17p) patients had concurrent TP53 mutations, which helps to explain the similar survival curves for both OS and EFS between the 2 groups. In the R/R group, in addition to del(17p) and TP53 mutations, complex karyotype and SF3B1 mutations were associated with worse OS and EFS, whereas DDX3X mutations were associated with worse EFS only (Figure 6). Because TP53 mutations are strongly associated with del(17p), we considered patients who had either of these abnormalities to have a TP53 aberration. Weibull regression multivariate analysis showed that TP53 aberrations significantly worsened EFS of TN patients, whereas both EFS and OS were significantly affected by the aberrations in the R/R cohort. Additionally, complex karyotype and SF3B1 mutations were significantly associated with worse OS in R/R patients (Table 3).
Figure 5.
Survival duration for TN CLL patients according to mutations or FISH abnormalities. (A) OS of TN CLL patients. (B) EFS of TN CLL patients. The median survival duration in months is shown next to each survival curve. Only statistically significant mutations and FISH abnormalities were shown.
Figure 6.
Survival duration of R/R patients according to mutations or FISH abnormalities. (A) OS of R/R patients. (B) EFS of R/R patients. The median survival duration in months is shown next to each survival curve. Only statistically significant mutations and FISH abnormalities were shown.
Table 3.
Results of a Weibull regression multivariate analysis for factors that contributed to event-free and overall survival in patients with CLL treated with lenalidomide
| Factor | EFS | OS | ||||
|---|---|---|---|---|---|---|
| HR | 95% CI | P | HR | 95% CI | P | |
| Model for TN patients | ||||||
| TP53 aberration | 3.5 | 1.15-10.6 | .023 | 2.62 | 0.44-15.5 | .303 |
| Complex karyotype | 1.57 | 0.54-4.57 | .407 | 0.67 | 0.06-7.9 | .753 |
| IGHV mutated | 0.95 | 0.47-1.93 | .889 | 0.45 | 0.13-1.59 | .889 |
| Model for R/R patients | ||||||
| TP53 aberration | 1.83 | 1.16-2.89 | .008 | 2.1 | 1.21-3.62 | .009 |
| Complex karyotype | 1.39 | 0.86-2.27 | .181 | 2.08 | 1.15-3.76 | .015 |
| SF3B1 | 1.37 | 0.77-2.42 | .278 | 2.52 | 1.33-4.80 | .004 |
| DDX3X | 2.24 | 0.77-6.44 | .133 | 1.1 | 0.33-3.63 | .872 |
| IGHV mutated | 0.72 | 0.42-1.21 | .213 | 0.79 | 0.38-1.63 | .527 |
HR, hazard ratio.
Discussion
In this study, we performed targeted capture sequencing of 295 genes in specimens from 288 CLL patients treated with lenalidomide-based therapy. Our results accentuate the marked mutational heterogeneity in CLL. Sixty-one genes were mutated in at least 1 patient, and no single gene was mutated in more than 15% of patients, which highlights the genomic diversity of CLL. The most frequently mutated molecular pathways included the MAPK–extracellular signal-regulated kinase pathway (KRAS and BRAF), the NOTCH pathway (NOTCH1 and FBXW7), and pathways involved in messenger RNA (mRNA) processing/translation (SF3B1, XPO1, and DDX3X), DNA damage repair (ATM, TP53, and POT1), and inflammation (MYD88, DDX3X, and BIRC3).
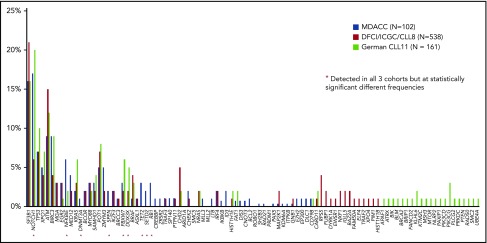
The present study’s findings add to those of 2 similar sequencing studies performed previously. In the Dana Farber Cancer Institute (DFCI)/International Cancer Genome Consortium (ICGC)/CLL8 trial, in which WES was performed on specimens from 278 patients with TN CLL who were treated with frontline fludarabine and cyclophosphamide with or without rituximab,6 SF3B1, TP53, and RPS15 mutations were associated with worse PFS and OS. In the CLL11 trial, which included the targeted sequencing of 85 genes in 161 TN CLL patients treated with chlorambucil with or without rituximab or obinutuzumab, KRAS and TP53 mutations were associated with worse response to therapy, and TP53 and POT1 mutations were associated with worse PFS and OS.7 These studies reported mutational frequencies of several genes, including NOTCH1, NFKBIE, FBXW7, and DDX3X, that were significantly different from those in the TN patients of the present study (N = 102). In addition, our study identified some mutations that those previous studies did not, including mutations in DNMT3A, SPEN, TET2, SETD2, RB1, and CREBBP (Figure 7). Mutations in DNMT3A, ASXL1, and TET2 are commonly mutated in myeloid malignancies but rarely mutated in CLL. Because we sequenced bulk bone marrow or peripheral blood samples instead of purified CLL cells, these mutations may represent clonal hematopoiesis of indeterminate potential not directly associated with CLL.23,24 The median variant allele frequency of these 3 mutations, which was only 8.9% (IQR, 7.2% to 12.8%), supports this possibility. If true, this would suggest that CLL may not arise from clonal hematopoiesis of indeterminate potential, a provocative finding; however, mutation mapping of purified myeloid and lymphoid fractions in bone marrow samples from CLL patients is needed to get a definitive answer.
Figure 7.
Comparison of the mutational frequency in the present study’s cohort and those in the CLL8 and CLL11 cohorts. Only the data from treatment naïve patients were compared. Red stars indicate mutations detected in all three cohorts at significantly different frequencies. MDACC, MD Anderson Cancer Center.
Our large study population enabled us to perform a detailed analysis of pairwise associations among CLL mutations. Patients with IGHV mutations had significant enrichment of MYD88 mutations and del(13q), whereas patients without IGHV mutations had more frequent NOTCH1 and XPO1 mutations, which is consistent with previous reports.6,25 Others have postulated that IGHV-unmutated CLL originates from pregerminal-center naïve B cells, whereas IGHV-mutated CLL derives from postgerminal-center memory B cells.26 MYD88 mutations are commonly found in postgerminal-center B-cell malignancies such as Waldenstrom macroglobulinemia and marginal zone lymphoma, which suggests that MYD88 pathway activation has an essential role in postgerminal-center B-cell malignancies. We also found a notable co-occurrence between NOTCH1 mutations and SPEN mutations. SPEN (previously known as MINT or SHARP) forms a complex with a DNA-binding protein, RBPJ, and represses the transactivation activity of NOTCH1.27,28 The mutations in SPEN that we identified were all truncating mutations clustered on exon 11 and thus expected to disrupt the SPOC C-terminus domain. This domain has been shown to have an essential role in SPEN heterodimerization and an inhibitory role in NOTCH signaling.29 Taken together, these findings suggest that the loss-of-function mutation in SPEN cooperates with the activating mutation of NOTCH1 to further enhance NOTCH signaling in CLL. Mutations in the NOTCH signaling pathway and SPEN were also reported in marginal zone lymphoma30 and adenoid cystic carcinoma,31 further supporting the notion that these 2 mutations share an oncogenic mechanism.
Previously known high-risk features such as del(17p), del(11q), complex karyotype, and TP53 mutations affected response to lenalidomide-based therapy in the present study. In the R/R cohort, TP53 mutations and del(17p) predicted worse overall survival. This result is contradictory to what was reported by Bühler et al.32 In their study of 104 R/R CLL patients treated with lenalidomide, they found no statistical difference in OS between TP53 mutated and wild-type patients. This discrepancy may be explained by much shorter OS of TP53 wild-type patients in their cohort in comparison with ours (median OS of TP53 wild-type patients was 35.4 months in Bühler’s cohort, whereas it was 62.2 months in our counterpart). Because the median OS of TP53-mutated patients did not differ between the 2 studies (19.4 months in Bühler’s vs 20.2 months in ours), shorter OS of TP53 wild-type patients most likely resulted in a statistically nonsignificant difference in their study. The short OS of TP53 wild-type patients in Bühler’s cohort could be due to having a more advanced stage of the disease (60% of their cohort had 3 or more prior therapies, whereas median number of prior therapies was 2 [IQR, 1-4] in our R/R cohort), or because 75% of our R/R patients received anti-CD20 monoclonal antibody with lenalidomide, which might have disproportionately affected survival of TP53 wild-type patients. Nevertheless, results from our study and previous studies suggest that TP53 mutations and del(17p) are universally poor-risk features in CLL.6,7 Although encouraging responses to newer agents such as ibrutinib and venetoclax have been reported in patients with TP53 mutations/del(17p),33,34 these patients still do poorly in comparison with the patients who do not have these abnormalities,35 indicating a strong unmet therapeutic need in this population.
Resistance to lenalidomide therapy was also suspected with IKZF3-mutated CLL patients, because lenalidomide has been shown to induce IKZF3 degradation through CRBN-mediated ubiquitination in multiple myeloma cell lines.8 The key mutation at p.L162R within IKZF3 in the second zinc finger domain decreases lenalidomide-induced ubiquitination in 293T cells. Because only 7 patients in our cohort had IKZF3 mutations, we did not find statistically significant differences in treatment response or survival between IKZF3-mutated and wild-type patients. With the recent addition of highly effective small-molecule inhibitors such as ibrutinib or venetoclax, the clinical relevance of the IKZF3 mutation in the context of lenalidomide resistance may not be as pertinent in CLL. That said, the mutation was shown to be associated with clonal expansion at relapse after chemoimmunotherapy6 and has also been detected in other B-cell malignancies, albeit low frequency; thus its oncogenic potential is still of interest.36-38
Our multivariable model showed that SF3B1 mutations, along with TP53 aberrations (del(17p) and TP53 mutations) were associated with worse survival. The DFCI/ICGC/CLL8 cohort reported similar decreases in median OS and PFS in patients with SF3B1 mutations who were treated with a fludarabine-based regimen.6 SF3B1 mutations, which occur in 10% to 15% of CLL patients, reportedly act within the mRNA spliceosome machinery.4,25,39 SF3B1 defects increase genomic instability, probably by decreasing responses to DNA damage.40,41 SF3B1 abnormalities present as subclonal populations in TN patients and have a clinical impact later in the disease course.42 These findings correlate well with our data in the present study, because SF3B1 mutations were associated with worse OR and OS in the R/R cohort but had little impact on these outcomes in the TN cohort.
Along with the already established prognostication schema in CLL of clinical features and cytogenetic abnormalities, somatic mutations add to and complement the already established risk stratification. Future challenges include determining how all the pieces of CLL prognostication fit together and whether these mutational features can be molecular targets.
Supplementary Material
The online version of this article contains a data supplement.
Acknowledgments
This study was supported by the Cancer Prevention Research Institute of Texas (R120501) (P.A.F.), the Welch Foundation (G-0040) (P.A.F.), the University of Texas System STARS Award (PS100149) (P.A.F.), the Red and Charline McCombs Institute for the Early Detection and Treatment of Cancer Award (K.T.), an institutional research grant from the MD Anderson Cancer Center (K.T.), a National Institutes of Health, National Cancer Institute Leukemia SPORE Career Enhancement Grant (K.T.), a Khalifa Scholar Award (K.T.), Charif Souki Cancer Research Fund (H.K.), MD Anderson’s Cancer Center Support Grant (P30 CA016672), and generous philanthropic contributions to MD Anderson’s Moon Shot Program (M.K., W.G.W., P.A.F.).
Footnotes
The publication costs of this article were defrayed in part by page charge payment. Therefore, and solely to indicate this fact, this article is hereby marked “advertisement” in accordance with 18 USC section 1734.
Authorship
Contribution: K.T., P.A.F., and W.G.W. designed the study and led the research team; K.T., B.H., F.W., Y.Y., E.K., C.V., P.S., and A.F. collected and analyzed data; K.T., K.P.P., N.J., P.T., G.G.-M., H.K., Z.E., M.K., J.A.B., A.F., and W.G.W. collected samples and treated the patients; K.T., C.G., L.L., and S.T. performed DNA sequencing; K.T., F.W., X.S., and J.Z. performed bioinformatics analysis; Y.Y. and K.-A.D. performed statistical analysis; K.T. and B.H. wrote the manuscript; all other authors reviewed and approved the manuscript.
Conflict-of-interest disclosure: The authors declare no competing financial interests.
The current affiliation for C.V. is Department of Hematology, University of Torino, Torino, Italy.
Correspondence: Koichi Takahashi, Department of Leukemia, Unit 428, The University of Texas MD Anderson Cancer Center, 1515 Holcombe Blvd, Houston, TX 77030; e-mail: ktakahashi@mdanderson.org; William G. Wierda, Department of Leukemia, Unit 428, The University of Texas MD Anderson Cancer Center, 1515 Holcombe Blvd, Houston, TX 77030; e-mail: wwierda@mdanderson.org; or Alessandra Ferrajoli, Department of Leukemia, Unit 428, The University of Texas MD Anderson Cancer Center, 1515 Holcombe Blvd, Houston, TX 77030; e-mail: aferrajo@mdanderson.org.
References
- 1.Döhner H, Stilgenbauer S, Benner A, et al. Genomic aberrations and survival in chronic lymphocytic leukemia. N Engl J Med. 2000;343(26):1910-1916. [DOI] [PubMed] [Google Scholar]
- 2.Zenz T, Mertens D, Küppers R, Döhner H, Stilgenbauer S. From pathogenesis to treatment of chronic lymphocytic leukaemia. Nat Rev Cancer. 2010;10(1):37-50. [DOI] [PubMed] [Google Scholar]
- 3.Puente XS, Pinyol M, Quesada V, et al. Whole-genome sequencing identifies recurrent mutations in chronic lymphocytic leukaemia. Nature. 2011;475(7354):101-105. [DOI] [PMC free article] [PubMed] [Google Scholar]
- 4.Wang L, Lawrence MS, Wan Y, et al. SF3B1 and other novel cancer genes in chronic lymphocytic leukemia. N Engl J Med. 2011;365(26):2497-2506. [DOI] [PMC free article] [PubMed] [Google Scholar]
- 5.Fabbri G, Rasi S, Rossi D, et al. Analysis of the chronic lymphocytic leukemia coding genome: role of NOTCH1 mutational activation. J Exp Med. 2011;208(7):1389-1401. [DOI] [PMC free article] [PubMed] [Google Scholar]
- 6.Landau DA, Tausch E, Taylor-Weiner AN, et al. Mutations driving CLL and their evolution in progression and relapse. Nature. 2015;526(7574):525-530. [DOI] [PMC free article] [PubMed] [Google Scholar]
- 7.Herling CD, Klaumünzer M, Rocha CK, et al. Complex karyotypes and KRAS and POT1 mutations impact outcome in CLL after chlorambucil-based chemotherapy or chemoimmunotherapy. Blood. 2016;128(3):395-404. [DOI] [PubMed] [Google Scholar]
- 8.Krönke J, Udeshi ND, Narla A, et al. Lenalidomide causes selective degradation of IKZF1 and IKZF3 in multiple myeloma cells. Science. 2014;343(6168):301-305. [DOI] [PMC free article] [PubMed] [Google Scholar]
- 9.Chanan-Khan A, Miller KC, Musial L, et al. Clinical efficacy of lenalidomide in patients with relapsed or refractory chronic lymphocytic leukemia: results of a phase II study. J Clin Oncol. 2006;24(34):5343-5349. [DOI] [PubMed] [Google Scholar]
- 10.Ferrajoli A, Lee BN, Schlette EJ, et al. Lenalidomide induces complete and partial remissions in patients with relapsed and refractory chronic lymphocytic leukemia. Blood. 2008;111(11):5291-5297. [DOI] [PMC free article] [PubMed] [Google Scholar]
- 11.Ferrajoli A, O’Brien S, Wierda WG, et al. Combination therapy with ofatumumab and lenalidomide in patients with relapsed chronic lymphocytic leukemia (CLL): results of a phase II trial. Blood. 2011;118(21):1788. [Google Scholar]
- 12.Badoux XC, Keating MJ, Wen S, et al. Lenalidomide as initial therapy of elderly patients with chronic lymphocytic leukemia. Blood. 2011;118(13):3489-3498. [DOI] [PMC free article] [PubMed] [Google Scholar]
- 13.Chen CI, Bergsagel PL, Paul H, et al. Single-agent lenalidomide in the treatment of previously untreated chronic lymphocytic leukemia. J Clin Oncol. 2011;29(9):1175-1181. [DOI] [PMC free article] [PubMed] [Google Scholar]
- 14.Thompson PA, Keating MJ, Hinojosa C, et al. Lenalidomide and rituximab in combination as initial treatment of chronic lymphocytic leukemia: initial results of a phase II study. Blood. 2014;124(21):1988. [Google Scholar]
- 15.Badoux XC, Keating MJ, Wen S, et al. Phase II study of lenalidomide and rituximab as salvage therapy for patients with relapsed or refractory chronic lymphocytic leukemia. J Clin Oncol. 2013;31(5):584-591. [DOI] [PMC free article] [PubMed] [Google Scholar]
- 16.Hallek M, Cheson BD, Catovsky D, et al. ; International Workshop on Chronic Lymphocytic Leukemia. Guidelines for the diagnosis and treatment of chronic lymphocytic leukemia: a report from the International Workshop on Chronic Lymphocytic Leukemia updating the National Cancer Institute—Working Group 1996 guidelines. Blood. 2008;111(12):5446-5456. [DOI] [PMC free article] [PubMed] [Google Scholar]
- 17.Takahashi K, Wang F, Kantarjian H, et al. Preleukaemic clonal haemopoiesis and risk of therapy-related myeloid neoplasms: a case-control study. Lancet Oncol. 2017;18(1):100-111. [DOI] [PMC free article] [PubMed] [Google Scholar]
- 18.Cibulskis K, Lawrence MS, Carter SL, et al. Sensitive detection of somatic point mutations in impure and heterogeneous cancer samples. Nat Biotechnol. 2013;31(3):213-219. [DOI] [PMC free article] [PubMed] [Google Scholar]
- 19.Ye K, Schulz MH, Long Q, Apweiler R, Ning Z. Pindel: a pattern growth approach to detect break points of large deletions and medium sized insertions from paired-end short reads. Bioinformatics. 2009;25(21):2865-2871. [DOI] [PMC free article] [PubMed] [Google Scholar]
- 20.Takahashi K, Wang F, Kantarjian H, et al. Copy number alterations detected as clonal hematopoiesis of indeterminate potential. Blood Adv. 2017;1(15):1031-1036. [DOI] [PMC free article] [PubMed] [Google Scholar]
- 21.Zhang J, Fujimoto J, Zhang J, et al. Intratumor heterogeneity in localized lung adenocarcinomas delineated by multiregion sequencing. Science. 2014;346(6206):256-259. [DOI] [PMC free article] [PubMed] [Google Scholar]
- 22.Benjamini Y, Hochberg Y. Controlling the false discovery rate: a practical and powerful approach to multiple testing. J R Stat Soc Ser A Stat Soc. 1995;57:289-300. [Google Scholar]
- 23.Genovese G, Kähler AK, Handsaker RE, et al. Clonal hematopoiesis and blood-cancer risk inferred from blood DNA sequence. N Engl J Med. 2014;371(26):2477-2487. [DOI] [PMC free article] [PubMed] [Google Scholar]
- 24.Jaiswal S, Fontanillas P, Flannick J, et al. Age-related clonal hematopoiesis associated with adverse outcomes. N Engl J Med. 2014;371(26):2488-2498. [DOI] [PMC free article] [PubMed] [Google Scholar]
- 25.Jeromin S, Weissmann S, Haferlach C, et al. SF3B1 mutations correlated to cytogenetics and mutations in NOTCH1, FBXW7, MYD88, XPO1 and TP53 in 1160 untreated CLL patients. Leukemia. 2014;28(1):108-117. [DOI] [PubMed] [Google Scholar]
- 26.Stevenson FK, Caligaris-Cappio F. Chronic lymphocytic leukemia: revelations from the B-cell receptor. Blood. 2004;103(12):4389-4395. [DOI] [PubMed] [Google Scholar]
- 27.Kuroda K, Han H, Tani S, et al. Regulation of marginal zone B cell development by MINT, a suppressor of Notch/RBP-J signaling pathway. Immunity. 2003;18(2):301-312. [DOI] [PubMed] [Google Scholar]
- 28.Oswald F, Kostezka U, Astrahantseff K, et al. SHARP is a novel component of the Notch/RBP-Jkappa signalling pathway. EMBO J. 2002;21(20):5417-5426. [DOI] [PMC free article] [PubMed] [Google Scholar]
- 29.Li J, Li J, Yang X, et al. The C terminus of MINT forms homodimers and abrogates MINT-mediated transcriptional repression. Biochim Biophys Acta. 2005;1729:50-56. [DOI] [PubMed] [Google Scholar]
- 30.Rossi D, Trifonov V, Fangazio M, et al. The coding genome of splenic marginal zone lymphoma: activation of NOTCH2 and other pathways regulating marginal zone development. J Exp Med. 2012;209(9):1537-1551. [DOI] [PMC free article] [PubMed] [Google Scholar]
- 31.Stephens PJ, Davies HR, Mitani Y, et al. Whole exome sequencing of adenoid cystic carcinoma. J Clin Invest. 2013;123(7):2965-2968. [DOI] [PMC free article] [PubMed] [Google Scholar]
- 32.Bühler A, Wendtner CM, Kipps TJ, et al. Lenalidomide treatment and prognostic markers in relapsed or refractory chronic lymphocytic leukemia: data from the prospective, multicenter phase-II CLL-009 trial. Blood Cancer J. 2016;6(3):e404. [DOI] [PMC free article] [PubMed] [Google Scholar]
- 33.Jones JA, Mato AR, Wierda WG, et al. Venetoclax for chronic lymphocytic leukaemia progressing after ibrutinib: an interim analysis of a multicentre, open-label, phase 2 trial. Lancet Oncol. 2018;19(1):65-75. [DOI] [PMC free article] [PubMed] [Google Scholar]
- 34.Farooqui MZH, Valdez J, Martyr S, et al. Ibrutinib for previously untreated and relapsed or refractory chronic lymphocytic leukaemia with TP53 aberrations: a phase 2, single-arm trial. Lancet Oncol. 2015;16(2):169-176. [DOI] [PMC free article] [PubMed] [Google Scholar]
- 35.Jain P, Keating M, Wierda W, et al. Outcomes of patients with chronic lymphocytic leukemia after discontinuing ibrutinib. Blood. 2015;125(13):2062-2067. [DOI] [PMC free article] [PubMed] [Google Scholar]
- 36.Morin RD, Mendez-Lago M, Mungall AJ, et al. Frequent mutation of histone-modifying genes in non-Hodgkin lymphoma. Nature. 2011;476(7360):298-303. [DOI] [PMC free article] [PubMed] [Google Scholar]
- 37.Beà S, Valdés-Mas R, Navarro A, et al. Landscape of somatic mutations and clonal evolution in mantle cell lymphoma. Proc Natl Acad Sci USA. 2013;110(45):18250-18255. [DOI] [PMC free article] [PubMed] [Google Scholar]
- 38.Morin RD, Assouline S, Alcaide M, et al. Genetic landscapes of relapsed and refractory diffuse large B-cell lymphomas. Clin Cancer Res. 2016;22:2290-2300. [DOI] [PubMed] [Google Scholar]
- 39.Damm F, Nguyen-Khac F, Fontenay M, Bernard OA. Spliceosome and other novel mutations in chronic lymphocytic leukemia and myeloid malignancies. Leukemia. 2012;26(9):2027-2031. [DOI] [PubMed] [Google Scholar]
- 40.Wan Y, Wu CJ. SF3B1 mutations in chronic lymphocytic leukemia. Blood. 2013;121(23):4627-4634. [DOI] [PMC free article] [PubMed] [Google Scholar]
- 41.te Raa GD, Derks IA, Navrkalova V, et al. The impact of SF3B1 mutations in CLL on the DNA-damage response. Leukemia. 2015;29(5):1133-1142. [DOI] [PubMed] [Google Scholar]
- 42.Landau DA, Carter SL, Stojanov P, et al. Evolution and impact of subclonal mutations in chronic lymphocytic leukemia. Cell. 2013;152(4):714-726. [DOI] [PMC free article] [PubMed] [Google Scholar]
Associated Data
This section collects any data citations, data availability statements, or supplementary materials included in this article.


