

Abstract
Targeted drugs are effective when directly inhibiting strong disease drivers, but only a small fraction of diseases feature defined actionable drivers. Alternatively, network-based approaches can uncover new therapeutic opportunities. Applying an integrated phenotypic screening, chemical and phosphoproteomics strategy, we here describe the ALK inhibitor ceritinib to have activity across several ALK-negative lung cancer cell lines and identify new targets and network-wide signaling effects. Combining pharmacological inhibitors and RNA interference revealed a polypharmacology mechanism involving the non-canonical targets IGF1R, FAK1 and RSK1/2. Mutating the downstream signaling hub YB1 protected cells from ceritinib. Consistent with YB1 signaling being known to cause taxol resistance, ceritinib combination with paclitaxel displayed strong synergy, particularly in cells expressing high FAK autophosphorylation, which we show to be prevalent in lung cancer. Together, we present a systems chemical biology platform for elucidating multi-kinase inhibitor polypharmacology mechanisms, subsequent design of synergistic drug combinations, and identification of mechanistic biomarker candidates.
Introduction
Targeted drugs have shown significant clinical success when directed against strong disease drivers, such as BCR-ABL in chronic myeloid leukemia (CML), EML4-ALK in non-small cell lung cancer (NSCLC) or JAK3 in rheumatoid arthritis, which are inhibited for instance by imatinib, crizotinib and tofacitinib, respectively.1–3 However, this target-driven approach is rarely effective in diseases with complex pathologies lacking dominant drivers or where these are currently not druggable, such as most KRAS mutations. This is true particularly for many cancers, which often display multiple mutations and epigenetic aberrations leading to deregulation of signaling and gene regulatory networks. Although inhibiting a single target may affect several cellular processes, efficient shutdown of oncogenic signaling networks is often only achieved by directly engaging multiple proteins, which increases the likelihood of effective treatment by reducing signaling crosstalk or compensatory adaptation.4 Oncogene-negative cancers may therefore be more effectively treated using a network-based approach with drugs targeting multiple pathways and cellular processes.5–7 This can be achieved by combining two or more targeted agents, a concept actively pursued in many preclinical and clinical studies and successfully implemented in melanoma using BRAF and MEK inhibitors, which block compensatory feedback activation.8 However, clinical translation of drug combinations is often limited by issues with formulation and dosing, drug-drug interactions, increased toxicity, regulation or strategic business management.6,9 Alternatively, network-wide signaling effects can be produced with single compounds that innately inhibit multiple disease-relevant targets, a phenomenon referred to as “polypharmacology”.6 The rational design of multi-targeted drugs for specific unrelated proteins poses a formidable challenge for drug discovery, though, as simultaneous potency optimization for two targets is difficult and the risk for undesired inhibition of targets that elicit toxicity increases significantly.9 Thus, only few examples have been reported where this has been achieved in a rational manner, for instance in CML with dasatinib (BCR-ABL and SRC family kinases) and thyroid cancer (RET and VEGFR2).10–12
Targeted drugs, particularly kinase inhibitors, serendipitously display widely varying target profiles beyond their intended or “cognate” targets.9,13–16 While these “off-“ or “non-canonical” targets are often either unknown or disregarded, they confer an inherent potential for polypharmacology applications. Notably, phenotypic screening approaches have found some kinase inhibitors to show antitumor activity unrelated to inhibition of their cognate targets, for which the underlying mechanism of action (MoA) therefore is not apparent, but likely involves one or more non-canonical targets.17 Generating a detailed, systems-wide understanding of these beneficial off-target and potentially polypharmacology mechanisms can lead to novel drug repurposing opportunities that allow for the treatment of refractory cancers. Importantly, elucidation of these mechanisms can also be informative for understanding wiring maps of complex oncogenic signaling networks, thus revealing new biological vulnerabilities and therapeutic opportunities with other drugs. Using a multi-tiered systems chemical biology approach, which integrates phenotypic screening with functional proteomics, we here describe the identification and mechanistic characterization of the polypharmacology activity of the FDA-approved, second-generation ALK inhibitor ceritinib (LDK378, Zykadia, 1) in ALK-negative NSCLC, in which ceritinib has not been previously investigated. Furthermore, deep interrogation of ceritinib’s effector network enabled the subsequent development of a synergistic drug combination and identification of a predictive, mechanism-based biomarker candidate.
Results
Ceritinib has cellular activity in ALK-negative NSCLC
We assembled a library of 240 compounds, which are mostly in clinical development or FDA-approved and span multiple target classes. To identify compounds with cellular activity unrelated to their cognate targets, this library contained multiple compounds per target. The library was screened for inhibition of cell viability against 20 NSCLC cell lines with various driver mutations. Unsupervised hierarchical clustering revealed that drugs of the same class largely cluster together (e.g. MAPK pathway inhibitors) (Fig. 1a). Interestingly, the FDA-approved, second-generation ALK/IGF1R inhibitor ceritinib did not cluster with other ALK inhibitors (Fig. 1a) suggesting that ceritinib may have a different activity profile. The data subset containing ALK, IGF1R and EGFR inhibitors (to control for anti-EGFR activity of AP26113) was further analyzed using unsupervised hierarchical clustering for direct comparison. As expected, all ALK inhibitors had potent activity against the ALK-rearranged H3122 cells. However, ceritinib displayed additional activity against a number of NSCLC lines whereas other ALK and IGF1R inhibitors had little effect in these cells (Fig. 1b). To prioritize cell lines with the largest observed sensitivity unrelated to ALK inhibition, we compared ceritinib to GSK1838705A, which has similar potency against both ALK and IGF1R.18,19 This revealed specific ALK-independent activity of ceritinib in various cell lines, such as the KRAS-mutant H650, H1155 and H23 cells (Fig. 1c). This was corroborated by lack of ALK expression in NSCLC cells in the absence of EML4-ALK translocation, which in this cell line panel is only present in H3122 (Fig. 1d). Since GSK1838705A is more potent for IGF1R than ceritinib, ceritinib’s additional activity was also likely independent of IGF1R inhibition alone, which was further supported by the lack of sensitivity to other IGF1R inhibitors (Fig. 1b). Dose-response curves showed that ceritinib inhibited viability of the most sensitive cells with an IC50 between 1–2 μM (Emax = 0% at 4 μM) (Supplementary Results, Supplementary Fig. 1a), which is within clinical plasma concentrations ([ceri] = 1.4 – 2.3 μM).20,21 This activity was elicited mostly through induction of G1 cell cycle arrest (Supplementary Fig. 1b–c). Ceritinib also showed efficacy in clonogenic assays, in which it completely eliminated H23 cells after 10 days (Emax = 0% at 2 μM) (Supplementary Fig. 1d). Together, these results suggest that ceritinib has ALK-independent antiproliferative activity in various NSCLC cell lines at concentrations observed in clinical settings.
Figure 1. Ceritinib has beneficial off-target activity in ALK-negative NSCLC cells.
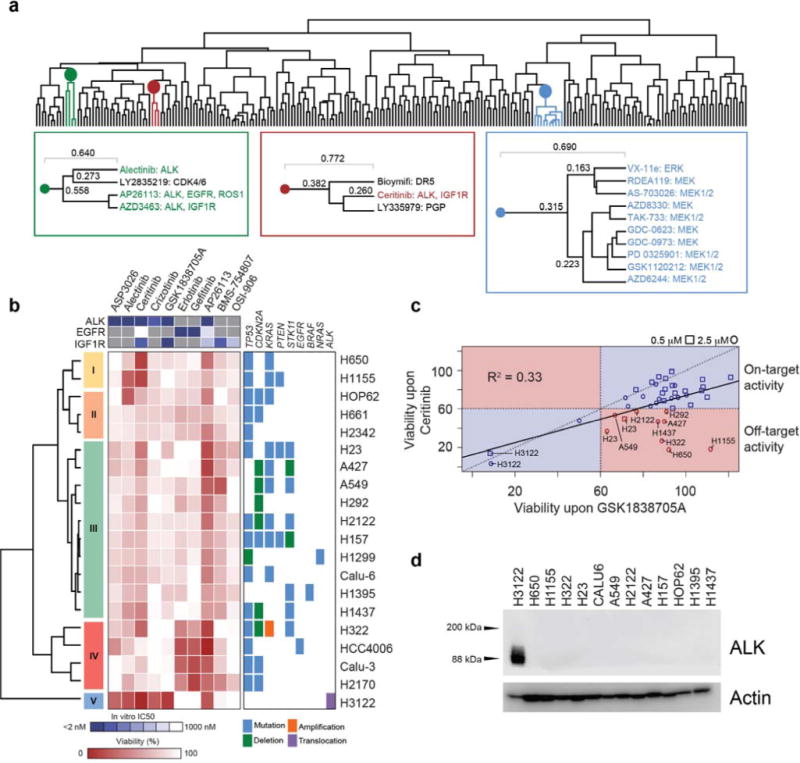
(a) Dendrogram from unsupervised hierarchical clustering of the phenotypic drug screen of 240 compounds in 20 NSCLC cell lines. Cells were treated for 72 h at 0.5 μM and 2.5 μM of each compound in biological duplicate and viability was determined using CellTiterGlo. Colors highlight individual clusters. Left box (green) highlights ALK inhibitor cluster, middle box (red) shows ceritinib cluster, right box (blue) highlights MAPK pathway inhibitor cluster. (b) Subset of drug screening data containing ALK, IGF1R and EGFR inhibitors at 2.5 μM. Points reflect the mean of two biological replicates. Individual clusters were manually chosen and numbered. Right box represents accompanying mutational data for these cell lines. The top box shows the in vitro IC50 values for these drugs against ALK, EGFR and IGF1R. (c) Correlation of relative cell viability values for all cell lines for ceritinib and GSK1838705A. Cell lines highlighted in red represent cell lines displaying off-target activity with < 60% viability with ceritinib treatment and > 60% viability with GSK1838705A treatment. (d) Western blot of ALK across 13 cell lines (n = 2). For full gel images see Supplementary Figure 9.
Ceritinib inhibits multiple targets in addition to ALK
To elucidate the mechanism of action (MoA) of ceritinib’s antiproliferative activity in these cells, we applied a systems approach combining both chemical and phosphoproteomics to gain a global view of ceritinib’s target profile and network-wide phosphorylation changes following ceritinib treatment (Supplementary Fig. 2a). To identify the targets responsible for ceritinib’s activity, we synthesized a boc-protected amino propyl derivative (boc-c-ceritinib, 2) and via deprotection subsequently generated a coupleable ceritinib analog (c-ceritinib, 3) (Supplementary Fig. 2b). Guided by a publically available co-crystal X-ray structure of ALK with ceritinib (PDB: 4MKC),22 we selected the solvent-exposed piperidine moiety of ceritinib as attachment point to allow for immobilization while retaining activity (Fig. 2a). Activity was confirmed by in vitro kinase assays for ALK inhibition (Supplementary Fig. 2c) and by c-ceritinib’s ability to bind EML4-ALK (Supplementary Fig. 2d). Pulldown assays were performed using lysates from H650, H23, and H3122 cells as well as patient-derived, primary lung cancer samples. Subsequent LC-MS/MS analysis identified, where expressed, ceritinib’s cognate target ALK and its known off-target IGF1R. Interestingly, c-ceritinib also bound multiple other kinases including FAK1 (encoded by PTK2), RSK1/2 (encoded by RPS6KA1/3), ERK1/2, CAMKK2 and FER (Fig. 2b, Supplementary Data Set 1), of which FAK1 and RSK1/2 were most prominently enriched across cell lines (Supplementary Fig. 2e). Several kinases were confirmed by in vitro kinase assays as new targets with IC50 values ranging from low/mid nanomolar for FER (5 nM), FAK1 (ø 20 nM, 6.3 nM (Reaction Biology)/33 nM (Eurofins)) and CAMKK2 (ø 26 nM), to upper-nanomolar for RSK2 (ø 275 nM) and RSK1 (ø 584 nM), whereas AMPKα1 was only weakly inhibited (2.5 μM) (Fig. 2c, Supplementary Fig. 2f). ERK1/2 and mTOR were not significantly inhibited at 1.5 μM suggesting very weak or indirect binding to a more potent ceritinib target. Importantly, FAK1 and RSK1/2 are competed away from the affinity matrix using free, unmodified ceritinib thereby confirming specificity of the interaction (Fig. 2d). Ceritinib also enriched for RSK1/2 and FAK1 in lung cancer patient samples (Fig. 2e, Supplementary Fig. 2g). RSK1/2 have two functional kinase domains, with the C-terminal kinase domain (CTKD) being responsible for autophosphorylation of RSK1/2 at S380/S386 in the interdomain linker region, thus activating RSK1/2, and the N-terminal kinase domain (NTKD) being responsible for phosphorylating downstream substrates (Supplementary Fig. 2h).23–26 Cross-competition experiments with specific inhibitors of the NTKD or the CTKD revealed that ceritinib binds to the CTKD of RSK1/2 (Fig. 2f). Consistently, ceritinib inhibited RSK1/2 S380/S386 autophosphorylation in H23 cells. Ceritinib also reduced AKT phosphorylation, indicative of IGF1R inhibition in these cells, as well as autophosphorylation of FAK1 with only minor effects on ERK phosphorylation (Fig. 2g). In summary, chemical proteomics identified several new ceritinib targets with nanomolar IC50 values, most prominently FAK1 and RSK1/2, which were functionally inhibited in cells.
Figure 2. Ceritinib inhibits multiple previously unknown targets including FAK1, RSK1/2, FER and CAMKK2.
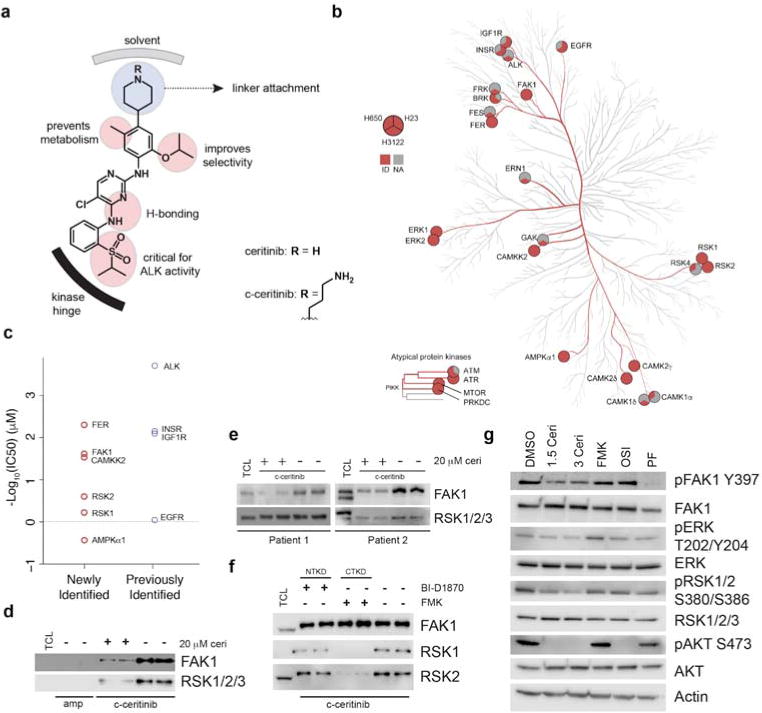
(a) Ceritinib modification strategy. Amino-propyl linker is attached to terminal piperidine moiety. (b) Kinome tree representing kinases identified in chemical proteomics experiments with > 2 exclusive unique spectra. Circles consist of 3 sections representing identification in H650, H23, and H3122 cells, respectively. Kinase phylogenetic tree adapted courtesy of Cell Signaling Technology, Inc. (www.cellsignal.com). (c) Average in vitro IC50 values for newly identified and previously known targets of ceritinib identified in chemical proteomics experiments. Average is reflective of mean of the combined Reaction Biology (technical duplicate) and Eurofins (technical duplicate) datasets. (d) Western blot of eluates from c-ceritinib pulldowns in H650 cells ± 20 μM unmodified ceritinib (n = 2). Ceritinib is able to compete FAK1 and RSK1/2/3 from the affinity matrix. TCL = total cell lysate, ceri = ceritinib, amp = ampicillin. (e) Western blot of eluates from c-ceritinib pulldowns in 2 lung cancer patient samples performed in biological duplicate. (f) Western blot of eluates from c-ceritinib pulldowns in H650 cells ± 20 μM BI-D1870 or FMK. Biological duplicates are displayed (n = 2). CTKD = C-terminal kinase domain, NTKD = N-terminal kinase domain. (g) Western blot of ceritinib targets and downstream signals following 3 h treatment in H23 cells (n = 3). Ceri = ceritinib, FMK = 20 μM FMK, OSI = 1.5 μM OSI-906, PF = 1.5 μM PF-573228. For full gel images see Supplementary Figure 9.
RSK1/2, FAK1 and IGF1R are central network nodes
Next, we performed quantitative phosphoproteomic analysis of phosphotyrosine (pY) and phosphoserine/threonine/tyrosine (pSTY) phosphopeptides to identify the downstream signaling pathways altered by ceritinib (Supplementary Fig. 2a, Supplementary Data Sets 2–3). Immunoprecipitation of pY phosphopeptides and subsequent label-free quantitative LC-MS/MS analysis resulted in detection of 435 unique phosphopeptides. Global IMAC-enriched phosphoproteomics using SILAC-based quantification yielded 4433 unique pS, pT, and pY phosphopeptides. Individual replicates shared similar intensity distributions (Supplementary Fig. 3a) and had good reproducibility (Supplementary Fig. 3b). We then selected pY phosphopeptides with a Fold Change ≥ 2 or p-value ≤ 0.1, as well as pSTY phosphopeptides present in all replicates with a Fold Change ≥ 2. This led to selection of 121 upregulated and 165 downregulated phosphopeptides (Supplementary Fig. 3c).
Proteins containing these phosphopeptides were merged with kinases enriched by chemical proteomics and queried (confidence > 0.9) for protein interactions and associations using STRING.27 Disconnected proteins were excluded from the analysis resulting in a ceritinib effector network of 139 unique protein nodes and 312 edges (interactions). The community structure of this network was analyzed by calculating the modularity28 (modularity = 0.589 with resolution = 2.448) resulting in 9 distinct modules (Fig. 3a, Supplementary Fig. 4a). These communities generally corresponded to cellular processes including kinase signaling, DNA repair, and transcription/translation. The largest module, module 1 (kinase signaling), contained all ceritinib kinase targets with modules 3 and 4 connecting to module 1 through RSK1/2. Module 2 was most interconnected with module 1. To gain further insight into the cellular pathways corresponding to these communities, modules 1–4 were chosen for KEGG pathway analysis. This revealed a large number of perturbed pathways, most significantly adherens junction, insulin signaling, mTOR signaling and focal adhesion signaling (Supplementary Fig. 4b, Supplementary Data Set 4). These pathways displayed large overlap with multiple shared nodes. Also, this analysis revealed several ceritinib-modulated phosphorylation sites associated with IGF1R, FAK1 or RSK1/2 signaling (Supplementary Fig. 4c).
Figure 3. Integrated analysis of chemical and phosphoproteomics data sets.
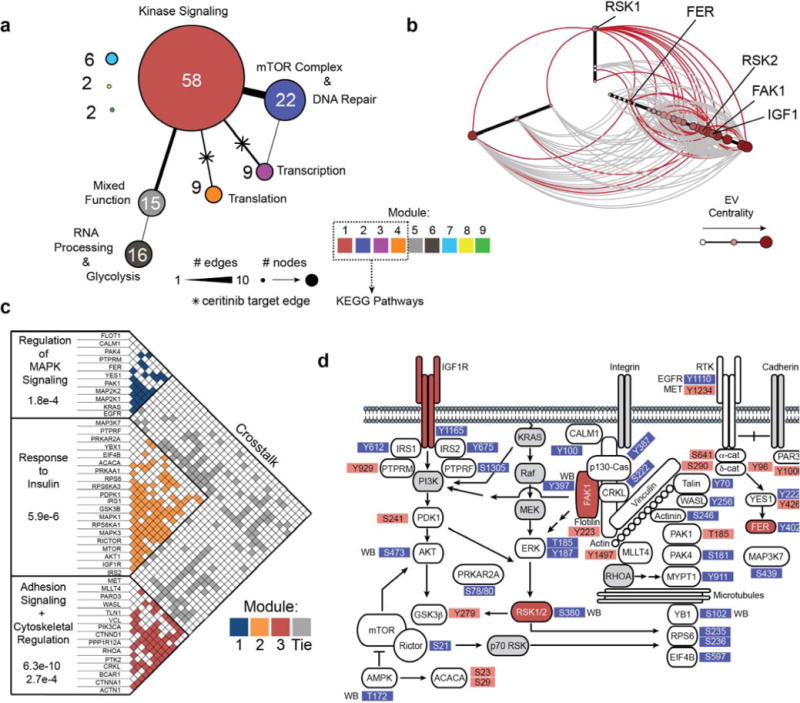
(a) Reduced view of the resulting network from merging kinases identified in chemical proteomics with altered phosphoproteins. Edges were queried using STRING. Colors represent community modules. Edge and node size represent the number of connecting edges between modules and number of nodes within a module. Biological function annotations were assigned based on manual inspection. (b) Hive plot of proteins in adherens junction, insulin, mTOR, focal adhesion and KRAS pathways. Red edges represent edges connected to ceritinib targets. Node size, color and position on axes represent eigenvector centrality. (c) Adjacency matrix of network represented in (b). Box color represent edges within optimal community modules. Gray boxes represent edges linking separate modules. Biological processes were queried from GeneGO. (d) Simplified topological pathway map of ceritinib-modulated network. Ceritinib targets are highlighted in red. Grey nodes were not observed, but manually added to complement signaling pathway connectivity. Red phosphosites were upregulated and blue phosphosites were downregulated following ceritinib treatment. WB = identified by Western blotting.
To pinpoint ceritinib’s most relevant target(s) and key downstream signals in these cells, we analyzed critical vulnerabilities both within the network and in relation to the mutational profile of H650 cells (CCLE, ReKINect).29,30 The most influential nodes are likely signaling hubs, which are central to individual pathways, and bridges, which are involved in modular overlap and pathway crosstalk. These nodes may intersect with mutated proliferation and survival pathways. To identify these bridges and hubs, we analyzed the mutational profile of H650 cells to prioritize pathways altered by ceritinib and created a subnetwork merging these pathways. Interestingly, H650 cells harbor mutations across both the KRAS and focal adhesion pathways (Supplementary Fig. 4d, Supplementary Data Sets 5–6). We therefore merged the focal adhesion, adherens junction, mTOR and insulin signaling pathways, appended key nodes in the MAPK signaling pathway (KRAS, RAF, MEK) as well as upstream/downstream nodes in the network (unobserved by proteomics) (PI3K, AKT, YB1, p70RSK, RHOA) and analyzed the community structure of the resulting subnetwork. RSK1 was a key bridge protein among these pathways with the other ceritinib targets RSK2, FAK1 and IGF1R being very central to the network with high eigenvector centrality, which is indicative of importance in the network (Fig. 3b).31 FER however showed a peripheral interaction with low eigenvector centrality suggesting lower relevance. In addition, many phosphorylation sites in the subnetwork were predicted to be directly phosphorylated by RSK1/2 or IGF1R using NetworKIN (FAK1 is not incorporated into NetworKIN) (Supplementary Fig. 4e; Supplementary Data Set 7).32 When assessing the community modules of this subnetwork,33 three major communities and substantial crosstalk between them with proteins belonging to multiple modules became apparent (Fig. 3c). The targets and signaling nodes represented by these pathways were organized into a topological subnetwork for functional interrogation (Fig. 3d). Together, integrated analysis of chemical and phosphoproteomics data sets suggests RSK1/2, FAK1 and IGF1R to be critical targets in a strongly interconnected ceritinib effector network.
Ceritinib inhibits viability through polypharmacology
Since RSK1/2, IGF1R and FAK1 were central nodes in the ceritinib effector network, they were selected for determining their functional relevance for ceritinib’s MoA. Interestingly, siRNA- mediated knockdown or pharmacological inhibition with selective inhibitors of RSK1/2 CTKD (using FMK; SL0101), FAK1 (using PF-573228) and IGF1R (using OSI-906) showed that inhibition of any of these kinases alone had little effect on viability of multiple cell lines (Fig. 4a, Supplementary Fig. 5a–c). However, combined targeting by simultaneous knockdown and pharmacological inhibition of RSK1/2 with either IGF1R or FAK1 resulted in pronounced decrease of cell viability, which was consistent also upon reversing siRNA and probe molecules for target pairs (Fig. 4a, Supplementary Fig. 5a–b, upper vs. lower panels). This effect was conserved across both H650 and H1155 cells (Fig. 4a, Supplementary Fig. 5a). In H23 cells co-targeting of RSK1/2 with IGF1R contributed stronger than combination with FAK1 (Supplementary Fig. 5b). As IGF1R and FAK1 have been reported in some cases to bind to each other,34 we hypothesized this functional overlap to indicate a physical interaction between these two kinases also in these cells, which was confirmed by co-immunoprecipitation of FAK1 with IGF1R in H1155 cells (Supplementary Fig. 5d). This interaction was independent of their catalytic activity as ceritinib treatment did not disrupt binding.
Figure 4. Ceritinib inhibits cell viability through inhibition of IGF1R, FAK1, RSK1 and RSK2.
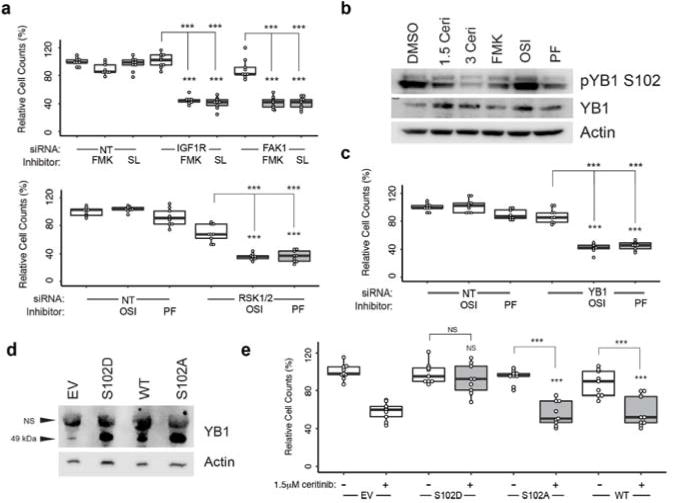
(a) Relative cell counts following 96 h knockdown of IGF1R or PTK2 and 72 h treatment with 20 μM of FMK or SL0101, or knockdown of RPS6KA1/3 and treatment with 1.5 μM OSI-906 or PF-573228 in H650 cells. Data is reflective of biological triplicates each performed in technical triplicate (median ± SD). Knockdown efficiencies were determined by immunoblotting (Supplementary Figure 5c). (b) Immunoblot of YB1 phosphorylation following 3 h of treatment. FMK = 20 μM, OSI = 1.5 μM OSI-906, PF = 1.5 μM PF-573228. (c) Relative cell counts following 96 h knockdown of YBX1 and 72 h treatment with 1.5 μM OSI-906 or 1.5 μM PF-573228 in H650 cells. Data is reflective of biological triplicates each performed in technical triplicate (median ± SD). Knockdown efficiencies were determined by immunoblotting (Supplementary Figure 5j). (d) Western blot of YB1 levels following overexpression of YB1 WT, as well as S102D and S102A mutants. EV = empty vector, NS: non-specific, WT: wild-type. (n = 2) (e) Relative cell counts following 96 h overexpression of YB1 WT, YB1 S102D and YB1 S102A and 72 h treatment with 1.5 μM ceritinib. Data is reflective of biological triplicates each performed in technical triplicate (median ± SD). Asterisks indicate p-value cut-offs (* : 0.05; **: 0.01; *** : 0.001) from Wilcoxon Rank Sum test. Asterisks without bars indicate comparison to NT/EV. For full gel images see Supplementary Figure 9.
We next investigated which signaling nodes downstream of RSK1/2, FAK1 and IGF1R were critical for ceritinib’s MoA. Revisiting the ceritinib network model highlighted the ribosomal protein S6 (RPS6), which plays important roles in increasing transcripts involved in cell proliferation, and the multifunctional oncogenic transcription factor YB1 as central signaling effector nodes, on which several modulated pathways converged (Fig. 3d). Immunoblot analysis demonstrated that ceritinib inhibited phosphorylation of RPS6 at S235/236 (Supplementary Fig. 5e) and YB1 at S102 (Fig. 4b, Supplementary Fig. 5f–g). Comparison with FMK consistently indicated RSK1/2 to be primarily responsible for YB1 phosphorylation (with contributions from FAK1 in H650 and H1155 cells). However, the upstream kinases responsible for RPS6 phosphorylation varied. Focus was therefore given to the role of YB1 for ceritinib’s cellular MoA. Similar to single inhibition of RSK1/2, knockdown of YBX1 (encoding for YB1) had little effect on cell viability. However, co-inhibition of IGF1R or FAK1 significantly reduced cell growth to a similar extent as targeting of RSK1/2 directly suggesting that YB1 is a key downstream effector of RSK1/2 and that its inhibition is required, but not sufficient, for mediating ceritinib’s overall effect (Fig. 4c, Supplementary Fig. 5h–j). Consistently, overexpression of the constitutively active phosphomimetic YB1S102D mutant conferred significant resistance of H650 cells to ceritinib while the inactive YB1S102A mutant or wild-type YB1 provided no protection (Fig. 4d–e). In summary, these results suggest that ceritinib inhibits viability of ALK-negative NSCLC cells through a polypharmacology mechanism that involves simultaneous inhibition of RSK1/2, IGF1R and FAK1 and is largely dependent on the central downstream signaling effector YB1.
Ceritinib strongly synergizes with microtubule inhibition
Since ceritinib caused alterations in pathways that regulate microtubules and the cytoskeleton (Fig. 3c–d) and considering that YB1 has been reported to confer resistance to microtubule-targeting drugs35,36, we hypothesized ceritinib to synergize with the FDA-approved microtubule inhibitor paclitaxel. Indeed, employing the Bliss model of independence, the combination of ceritinib and paclitaxel displayed substantial synergy in H650 and H1155 cells (Fig. 5a). This was corroborated by independent experiments analyzed using the Chou-Talalay combination index method, which revealed strong to very strong synergy and a large shift of the ceritinib dose-response curve (Fig. 5b). This was particularly pronounced in H1155 cells with effective ceritinib concentrations shifted into the nanomolar range, well below attainable plasma concentrations (Fig. 5b, Supplementary Fig. 6a). Conversely, ceritinib addition caused shifts in the paclitaxel dose-response curves in several cell lines, most pronounced again in H1155 cells (Supplementary Fig. 6b). As indicated by cleaved caspase 3/7 and PARP1, combining ceritinib and paclitaxel in H1155 cells also caused a significant increase in apoptosis whereas single drug treatment showed no effect (Fig. 5c–d).
Figure 5. Ceritinib strongly synergizes with the microtubule inhibitor paclitaxel.
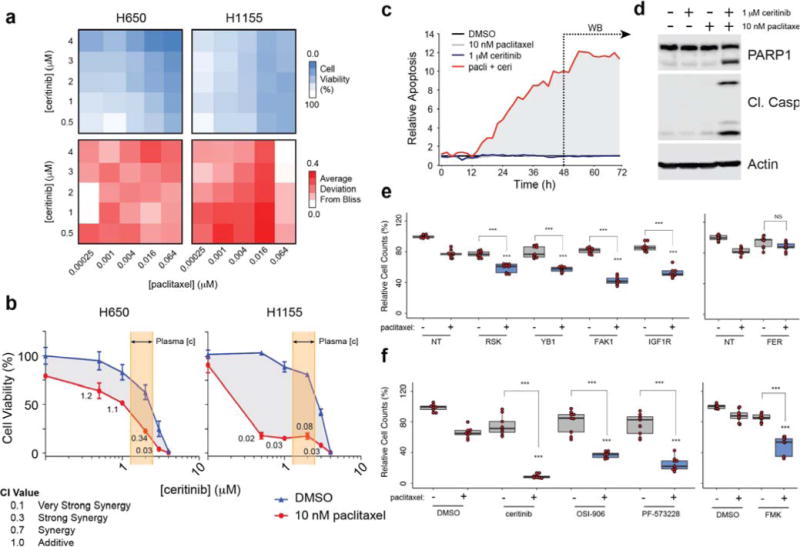
(a) Heatmap of cell viability (top) and deviation from Bliss (bottom) in H650 and H1155 cells following 72 h treatment with ceritinib and paclitaxel. (n = 3) (b) Dose response curve of ceritinib ± paclitaxel in H650 and H1155 cells (n = 3, SD). CI values were calculated using CompuSyn. Highlighted area reflects reported ceritinib concentration range in patient plasma. (c) Relative apoptosis following treatment at the indicated concentrations of ceritinib and paclitaxel as determined by caspase 3/7 cleavage (n = 3). Data were recorded every 2 h for 72 h using an Incucyte Live Cell Analysis System. (d) Western blot of PARP1 and cleaved caspase 3 following 48 h of treatment (n = 3). (e) Relative cell count following 96 h siRNA mediated knockdown of RPS6KA1/3, YBX1, PTK2, IGF1R, or FER and 72 h treatment with 10 nM paclitaxel in H1155 cells. Data is reflective of biological and technical triplicate (median ± SD). (f) Relative cell viability following 72 h co-treatment with 1.5 μM ceritinib, 1.5 μM OSI-906, 1.5 μM PF-573228, or 20 μM FMK with 10 nM paclitaxel. Data is reflective of biological triplicates each performed in technical triplicate (median ± SD). All samples received the same overall amount of DMSO and RNA. Asterisks indicate p-value cut-offs (* : 0.05; ** : 0.01; *** : 0.001) from Wilcoxon Rank Sum test. Asterisks without bars indicate comparison to NT/DMSO + paclitaxel. For full gel images see Supplementary Figure 9.
To determine the underlying mechanism of this synergy, we combined paclitaxel with knockdown of PTK2, RPS6KA1/3, IGF1R or YBX1. Silencing these genes moderately, but significantly enhanced paclitaxel efficacy suggesting they all contribute to the observed synergy, with PTK2 knockdown showing the largest effect (Fig. 5e). Conversely, silencing of FER, did not enhance paclitaxel activity, even in combination with IGF1R inhibition (Supplementary Fig. 7a). Likewise, knockdown of CAMKK2 or PRKAA1 (encoding its downstream substrate AMPKα1) did not synergize with paclitaxel either (Supplementary Fig. 7b–c). However, pharmacological inhibition of IGF1R, FAK1, and/or RSK1/2 markedly sensitized H1155 cells to paclitaxel (Fig. 5f, Supplementary Fig. 7d). Consistent with the gene silencing, the dual CAMKK2/AMPK inhibitor compound C did not synergize with paclitaxel. In addition, combination of paclitaxel with the CDK4/6 inhibitor ribociclib, which has no activity against RSK1/2, IGF1R, or FAK1,37 did not exhibit synergy, whereas the FAK1/RSK/IGF1R inhibitor CEP-3744038 strongly synergized with paclitaxel (Supplementary Fig. 7e–f). Taken together, ceritinib displays pronounced synergy with paclitaxel in H1155 cells leading to potent induction of apoptosis, and this synergy is dependent on inhibition of RSK1/2, IGF1R and FAK1.
FAK1 phosphorylation correlates with pronounced synergy
Since the extent of synergy in H1155 cells was markedly more pronounced than in H650 or H23 cells, we sought to identify additional cell lines that responded similarly and a potential predictive marker of exceptional sensitivity to this combination. We therefore analyzed a panel of 14 cell lines for basal expression and phosphorylation of key nodes in the ceritinib effector network. This revealed that FAK1 autophosphorylation at Y397 was much stronger in H1155 cells than in H650 or H23 (Fig. 6a, Supplementary Fig. 8a). Notably, H460 was the only other cell line in this panel that displayed high pFAK1 levels. Indeed, these cells displayed a strong shift in the dose-response curve and highly synergistic CI values in viability assays (Fig. 6b), as well as pronounced combination effects in clonogenic assays (Fig. 6c). Since both H1155 and H460 cells are large-cell lung carcinoma (LCLC) cell lines harboring KRAS mutations, we hypothesized that additional RAS-mutant LCLC cell lines may respond similarly. Subsequent testing of NRAS-mutant H1299 LCLC cells showed also strong response to the combination of ceritinib and paclitaxel (Fig. 6d). Notably, H1299 cells displayed a substantial FAK1 autophosphorylation (Fig. 6e). These findings suggest that high FAK1 pY397, possibly in the context of RAS mutations, may be predictive of exceptional synergy to the combination of ceritinib and paclitaxel.
Figure 6. FAK1 autophosphorylation may be predictive of synergistic response to ceritinib and paclitaxel.
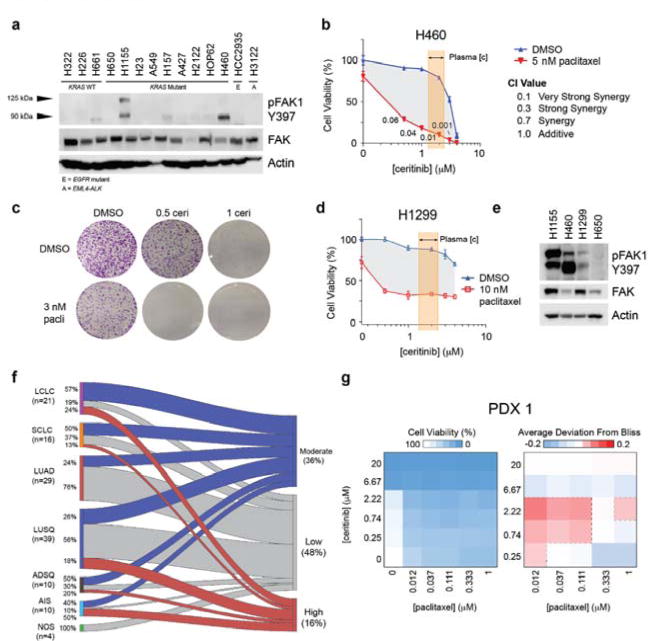
(a) Western blot of pFAK1 Y397 and FAK1 across 14 cell lines with indicated genetic status (WT: wild-type; E: EGFR-mutant; A: EML4-ALK translocation) (n = 4) (b) Dose response curves of ceritinib ± paclitaxel in H460 cells (n = 3, SD). CI values were calculated using CompuSyn. Highlighted area reflects reported maximum range of ceritinib concentration in patient plasma (1.4 – 2.3 μM). (c) Crystal violet stain of clonogenic assay for H460 cells following 7 days of ceritinib and paclitaxel treatment at the indicated concentrations (μM) (n = 3). (d) Dose response curves of ceritinib ± paclitaxel in H1299 cells (n = 3, SD). (e) Western blot of pFAK1 in H1155, H460, H1299 and H650 cells (n = 3). (f) Sankey diagram of pFAK1 staining across lung tumor histologies for TMA1 and TMA2. Chord area is proportional to the number of tumors. Percentage of each tumor type is represented on the left. (g) Heatmap of cell viability (left) and deviation from Bliss (right) in PDX1 tumors grown in 3D ex vivo culture following treatment with ceritinib and paclitaxel at the indicated concentrations (n = 2). LCLC = large cell lung carcinoma, SCLC = small cell lung carcinoma, LUAD = lung adenocarcinoma, LUSQ = lung squamous cell carcinoma, ADSQ = adenosquamous carcinoma, AIS = adenocarcinoma in situ, NOS = not otherwise specified. For full gel images see Supplementary Figure 9.
To determine the prevalence of FAK1 autophosphorylation across various lung cancer subtypes, we analyzed two different lung cancer tissue microarrays (TMA) for pFAK1 by immunohistochemistry (IHC). TMA1 consisted of 60 human tumor samples (US Biomax) and TMA2 consisted of 69 patient-derived xenograft (PDX) tumors (Charles River Laboratories). The TMAs contained varying histologies, the majority being adenocarcinoma (LUAD) and squamous cell carcinoma (LUSQ), followed by LCLC (Supplementary Fig. 8b). IHC analysis revealed a range of pFAK1 staining [range = (0, 280), average = 96.1, median = 100] with most tumors having low (48%) to moderate (36%) staining (H-score < 130) and 16% showing strong pFAK1 staining (Fig. 6f, Supplementary Fig. 8c). Staining was of high quality with TMA2 replicates showing good reproducibility (Supplementary Fig. 8d). Interestingly, 24% of LCLC tumors displayed high pFAK1 (Fig. 6f, Supplementary Fig. 8e). Adenocarcinoma in situ (AIS, formerly bronchioalveolar [BAC]) tumors had the highest amount of pFAK1 with 50% of tumors having high staining with the caveat that the number of AIS cases was low (Fig. 6f, Supplementary Fig. 8e). Using this data, we prioritized three PDX models from TMA2 with high pFAK1 staining (two LCLC [PDX1 and PDX3] and one LUSQ [PDX2], Supplementary Fig. 8e) for functional validation by ex vivo 3D clonogenic assays. All three models exhibited pronounced synergy between ceritinib and paclitaxel, particularly at low drug concentrations (Fig. 6g, Supplementary Fig. 8f–g). In summary, these results suggest that pFAK1 is a prevalent signal in lung cancer, and that further evaluation of pFAK1 as a potential mechanistic biomarker for synergy between ceritinib and paclitaxel is warranted.
Discussion
Network-based targeting strategies have the potential to reveal new therapeutic opportunities in diseases lacking strong and actionable drivers.6,7 Here, we present a systems chemical biology approach for elucidating polypharmacology mechanisms of multi-kinase inhibitors, which enables rational design of synergistic drug combinations and identification of mechanistic biomarker candidates. It furthermore facilitates the systems level understanding of complex signaling networks. This approach utilizes an integrated technology platform based on unbiased phenotypic drug screening, in this case for cancer cell viability, to identify cellular effects unrelated to a drug’s cognate target. Subsequent functional proteomics, comprised of chemical proteomics and phosphoproteomics, allows identification of a kinase inhibitor’s cell-specific targets and network-wide signaling effects, which are synthesized into a mechanistic hypothesis for functional validation. This platform is generalizable to other chemical proteomic technologies such as activity-based protein profiling (ABPP) or cellular thermal shift assays (CETSA). Importantly, this platform could also be adapted to other drug classes, such as HDAC inhibitors, and diseases other than cancer depending on the post-translational modification MS method, e.g. acetylation, or choice of screening assay/cell type, including primary cells. Furthermore, it is not limited to cases where polypharmacology is elicited entirely through non-canonical targets, as observed here for ceritinib, but can be applied similarly to drugs that act through mixed mechanisms involving cognate and other targets. The latter may in fact constitute a more common scenario.
Application of this approach identified the FDA-approved ALK-inhibitor ceritinib to harbor antiproliferative activity also in ALK-negative NSCLC cell lines. This activity, while less potent than in ALK-rearranged NSCLC,22 which is likely for serendipitous drug effects not optimized for the particular target(s), was within clinically relevant plasma concentrations.20,21 The underlying MoA depended not on a single target, but constituted a complex case of polypharmacology involving simultaneous inhibition of multiple non-canonical targets, namely FAK1, IGF1R and RSK1/2. Inhibition of each kinase alone showed no significant effects, thus highlighting the relevance of targeting the signaling network at multiple nodes. In-depth analysis of the ceritinib-modulated network led to identification of YB1 as a key effector node for ceritinib single agent activity. Based on the network converging on microtubule regulation and the fact that YB1, either downstream of RSK1/2 or FAK1, confers resistance to microtubule targeting agents in prostate and ovarian cancers,35,36 this led to discovery of ceritinib synergy with paclitaxel, which was highly pronounced in a subset of cell lines. Although YB1 signaling contributed to the MoA of this drug combination, FAK1 targeting displayed somewhat stronger effects suggesting a role also of other, uncharacterized FAK1-regulated signals. Additional studies are required to determine the exact mechanism of this signaling interaction.
Consistent with a more prominent role of FAK1 for the ceritinib/paclitaxel synergy, high FAK1 autophosphorylation indicated exceptional sensitivity to this drug combination. Notably, cell lines lacking FAK1 autophosphorylation still responded to the combination albeit to lesser extent. Importantly, LCLC and AIS histology tumors showed a much higher pFAK1 prevalence than LUAD, which was previously reported to display high pFAK1 in approximately 25% of cases (LCLC and AIS were not present in this analysis).39 Our findings of high pFAK in LCLC and AIS tumors suggest that the ceritinib/paclitaxel combination has a higher potential of pronounced effects in these subtypes, which compared to LUAD less commonly feature actionable kinase mutations and translocations and therefore constitute a higher unmet medical need. Dedicated clinical studies are required to determine the translational potential of this drug combination and associated biomarker candidate in ALK-negative lung cancers.
In summary, we present a systems chemical biology approach for elucidation of multi-kinase inhibitor polypharmacology mechanisms and their underlying network biology using an integrated phenotypic screening and functional proteomics platform. Using the FDA-approved, second-generation ALK inhibitor ceritinib, we illustrate the potential of this strategy for the subsequent design of synergistic drug combinations and identification of a potential biomarker candidate that may enable repurposing of ceritinib, in combination with paclitaxel, for treatment of ALK-negative NSCLC. In the future, this strategy may facilitate further drug repurposing efforts and lead to an increase of new therapy options for difficult-to-treat patients.
Online Methods
Cell culture and reagents
H650, H1155, HOP62, H661, H2342, H23, A427, A549, H292, H2122, H157, H1299, Calu-6, H1395, H1437, H322, HCC4006, Calu-3, H2170, H3122, H460, H226 and HCC2935 cells were provided by the Moffitt Lung Cancer Center of Excellence Cell Line Core and were cultured in RPMI 1640 media containing 10% FBS (complete RPMI). All cell lines tested negative for mycoplasma contamination and have been authenticated by STR analysis. OSI-906, ceritinib, CEP-37440, ribociclib (Chemietek), PF-573228, BI-D1870 (Selleckchem), Compound C (Sigma), FMK (Axon Medchem) and SL0101 (Millipore) were dissolved in DMSO (10 mM) and diluted in complete RPMI for use. The H157 cell line used in this study is reported in the International Cell Line Authentication Committee database of commonly misidentified cell lines. H157 was only used to demonstrate the range of sensitivity to ceritinib in a large, diverse set of lung cancer cell lines. The batch used in this study has been authenticated by STR analysis. Studies performed with fresh frozen primary patient lung tissue were approved by the institutional scientific review committee (H. Lee Moffitt Cancer Center & Research Institute). Written informed consent was obtained prior to sample collection.
Viability assays & synergy calculations
Cell viability assays were conducted according to manufacturer’s specifications for CellTiter-Glo Luminescent Cell Viability Assay (Promega). Cells were seeded at 1000 cells/well in a 384 well microtiter plate and treated after 24 hours. Drugs were diluted in the respective culture medium at the indicated concentrations. Cells were treated for 72 hours before the addition of CellTiter-Glo (Promega) reagent and read on a M5 Spectramax plate reader (Molecular Devices). Raw data for the drug screen was pre-processed in excel and analyzed using Cluster3.0.40 For details regarding the drug screen see Supplementary Table 1. Raw data for dose-response curves was analyzed using Graphpad Prism or in R using the drc package.41 Drug combination effects were evaluated using Bliss or the combination index (CI) method described by Chou-Talalay using CompuSyn software.
RNA interference
siRNAs used were RSK1 SMARTpool (L-003025-00-0005), RSK2 SMARTpool (L-003026-00-0005), IGF1R SMARTpool (L-003012-00-0005), FAK1 SMARTpool (L-003164-00-0005), FER SMARTpool (L-003129-00-0005), PRKAA1 SMARTpool (L-005027-00-0005), CAMKK2 SMARTpool (L-004842-00-0005) and YB1 SMARTpool (L-010213-00-0005) and ON TARGET plus non targeting (D-001810-10-20) (All Dharmacon). Dual knockdown of RSK1 and RSK2 was achieved by combination of individual RSK1 and RSK2 siRNAs at a final concentration of 20 nM siRNA. Single knockdowns were supplemented with non-targeting siRNA to a 20 nM final concentration of siRNA. Transfection of these siRNAs was conducted in a 6-well plate using Lipofectamine RNAiMAX Transfection Reagent (Invitrogen) according to manufacturer’s instructions. Gene silencing was monitored by immunoblotting. Drug treatments were conducted 24 hours after transfection at the indicated concentrations using complete RPMI as the diluent. Cells were counted in triplicate using trypan blue and a hemocytometer and analyzed in R.
Immunoblotting
Cells were lyzed using 0.20% NP40, 50 mM Tris pH 7.5, 5% Glycerol, 1.5 mM MgCl2, 100 mM NaCl lysis buffer containing Phosphatase Inhibitor Cocktail 2 (Sigma, P5726) and cOmplete Protease Inhibitor Cocktail (Roche, 11873580001). Lysates were resolved by SDS-PAGE and incubated with primary antibodies. Antibodies used were against actin (A5441), CAMKK2 (HPA017389) (both Sigma), ERK1/2 (Sigma, M5670) and phospho-AKT (Ser473)(#9271), AKT (#9272), ALK(#3633), phospho-p90RSK (Ser380)(#12032), RSK1/2/3 (#9355), RSK1(#9333), RSK2 (#5528), phospho-RPS6 (Ser235/236)(#4858), RPS6 (#2217), phospho-ERK1/2 (Thr202/Tyr204)(#4267), phospho-FAK1 (Tyr397)(#8556), FAK1 (#13009), phospho-IGF1R (Tyr1131)(#3021), IGF1R (#9750), cleaved Caspase 3 (#9661), PARP-1 (#9542), AMPK1 (#2795), pAMPKα (Thr172)(#2535), FER (#4268), phospho-YB1 (Ser102)(#2900), and YB1 (#4202) were from Cell Signaling. Secondary antibodies were HRP-conjugated α-rabbit or α-mouse (GE Healthcare).
Flow cytometry
For cell cycle experiments, cells were harvested following incubation, fixed with 70% cold ethanol and stored at −20°C until analyzed. Cells were washed with PBS and cell cycle was determined by incubating in a 1 μg/mL DAPI (4′, 6-Diamidino-2-phenylindole, Sigma)/0.1% Triton X-100/PBS solution and analyzed using a FACSCanto II benchtop analyzer (BD Biosciences). Raw data was processed using ModFitLT V3.2.1 (Verity Software House) and further analyzed in R.
Clonogenic assays
Cells were seeded into 6-well plates (4,000 cells/well) and treated after 24 hours at the indicated concentrations of drug using complete RPMI as the diluent. Cells were fixed and stained with Crystal Violet following 10 (H23) or 7 (H460) days of growth and imaged using a tabletop scanner.
c-Ceritinib synthesis
The starting materials, ceritinib (15 mg, Chemietek, >99%), 3-(boc-amino) propyl bromide (3 EQ) and triethylamine (3 EQ) were dissolved in DMF (300 μL) and stirred under argon atmosphere at r.t. overnight. The reaction was monitored using HPLC-MS and additional 3-(boc-amino) propyl bromide (2 EQ) was added and stirred at r.t. overnight. The HPLC-MS showed completion of the reaction with a minor double alkylated product (< 10%). The crude reaction mixture was extracted using dichloromethane (5 mL) and 0.1 M NaHCO3 (pH 8.5, 5 mL). The aqueous layer was washed with dichloromethane (3 mL × 3). The combined organic phase was washed with saturated NaCl (5 mL), dried (Na2SO4), filtered and concentrated to dryness to obtain a yellow, oily film. This product was further purified using dimercaptotriazine beads (20 EQ, 37°C O/N) to remove excess 3-(boc-amino) propyl bromide and filtered through celite. Single and double alkylated products were then separated through silica (8% MeOH in DCM). LC-MS (ESI+) m/z: 715.3 [M+H]+. 1H NMR (400 MHz, CD3OD): δ 8.45 (d, J = 8.4 Hz, 1H), 8.15 (s, 1H), 7.92 (dd, J = 8.0, 1.5 Hz, 1H), 7.74 (s, 1H), 7.70 – 7.60 (m, 1H), 7.39 – 7.29 (m, 1H), 6.85 (s, 1H), 4.62 – 4.54 (m, 1H), 3.38 – 3.28 (m, 1H), 3.15 – 3.07 (m, 5H), 2.52 – 2.47 (m, 2H), 2.24 – 2.15 (m, 2H), 2.13 (s, 3H), 1.80 – 1.61 (m, 6H), 1.44 (s, 9H), 1.32 (d, J = 6.1 Hz, 6H), 1.25 (d, J = 6.8 Hz, 6H). Purified boc-c-ceritinib (2) was dissolved in dichloromethane/TFA (20%, 200uL) and stirred for 15 minutes to perform boc-deprotection. The reaction was monitored using HPLC-MS and showed completion of the reaction to obtain c-ceritinib (TFA salt). LC-MS (ESI+) m/z: 615.3 [M+H]+; HRMS (ESI+) m/z: calcd. for C31H43ClN6O3S [M+H]+ 615.28786, found 615.28792 (0.10 ppm). 1H NMR (400 MHz, d6-DMSO): δ 9.58 (s, 1H, disappears upon D2O shake), 8.38 (d, J = 8.3 Hz, 1H), 8.33 (s, 1H, disappears upon D2O shake), 8.28 (s, 1H), 7.89 (s, 2H, disappear upon D2O shake), 7.83 (dd, J = 7.7, 1.1 Hz, 1H), 7.61 (dd, J = 7.8, 7.7 Hz, 1H), 7.48 (s, 1H), 7.37 (ddd, J = 8.3, 7.8, 1.1 Hz, 1H), 6.77 (s, 1H), 4.53 – 4.44 (m, 1H), 3.58 – 3.51 (m, 2H), 3.50 – 3.39 (m, 1H), 3.19 – 2.85 (m, 7H), 2.12 (s, 3H), 2.03 – 1.84 (m, 6H), 1.20 (d, J = 6.0 Hz, 6H), 1.13 (d, J = 6.8 Hz, 6H). 13C NMR (100 MHz, d6-DMSO): δ 159.38, 159.03, 158.68, 158.32, 157.46, 155.80, 154.17, 147.39, 138.29, 138.17, 135.26, 131.48, 127.16, 125.67, 124.75, 124.55, 117.82, 114.90, 111.60, 104.99, 104.82, 71.15, 55.15, 53.59, 52.76, 36.73, 34.82, 29.82, 22.24, 18.81, 15.27.
Kinase assays
In vitro kinase inhibition assays and IC50 determinations were performed on the Reaction Biology Kinase HotspotSM and Eurofins KinaseProfiler™ platforms using 10 μM ATP. Reaction Biology IC50 values were determined using a 10 dose 3-fold serial dilution series starting at 20 μM (Reaction Biology). Eurofins IC50 values were determined using a 9 dose 3-fold serial dilution series starting at 20 μM. For details regarding IC50 values, see Supplementary Table 2.
Affinity purification and mass spectrometry
Drug affinity chromatography experiments were conducted essentially as described previously.37 Briefly, c-ceritinib or ampicillin was immobilized on NHS-activated Sepharose for Fast Flow resin (GE Healthcare) and blocked with ethanolamine overnight. H650, H23, H3122 cells and patient samples were lyzed and total cell lysate containing 5 mg of protein were added to the affinity matrix for 2 hours. Competition experiments were conducted by incubating total cell lysates with 20 μM ceritinib for 30 minutes prior to affinity chromatography. A nanoflow liquid chromatograph (U3000, Dionex) interfaced with an electrospray ion trap mass spectrometer (LTQ-Orbitrap, Thermo) was used for tandem mass spectrometry peptide sequencing following chemical proteomic experiments. The sample was first loaded onto a pre-column (5 mm × 300 μm ID packed with C18 reversed-phase resin, 5 μm particle size, 100 Å pore size) and washed for 8 minutes with aqueous 2% acetonitrile and 0.04% trifluoroacetic acid. The trapped peptides were eluted onto the analytical column, (C18, 75 μm ID, 2 μm particle size, 100 Å pore size, Pepmap 100, Dionex). The LC method was programmed as: 95% solvent A (2% acetonitrile + 0.1% formic acid) for 8 minutes, solvent B (90% acetonitrile + 0.1% formic acid) from 5% to 50% in 90 minutes, then solvent B from 50% to 90% B in 7 minutes and held at 90% for 5 minutes, followed by solvent B from 90% to 5% in 1 minute and re-equilibration for 10 minutes. The flow rate on the analytical column was 300 nL/min. Five tandem mass spectra were collected in a data-dependent manner following each survey scan. MS/MS scans were performed using 60 second exclusion for previously sampled peptide peaks. Mascot searches were performed against the UniProt human database downloaded March 2015. Two trypsin missed cleavages were allowed, the precursor mass tolerance was 1.1 Da. MS/MS mass tolerance was 0.8 Da. Dynamic modifications included carbamidomethylation (Cys) and oxidation (Met). A minimum of two exclusive unique spectrum counts was required for protein identification. Mascot search results were summarized in Scaffold 4.4.5 and imported into R for bioinformatic analysis.
Phosphopeptide enrichment and mass spectrometry
For global phosphoproteomics (biological duplicate), cells were labeled using stable isotope labeling with amino acids in cell culture (SILAC) (Invitrogen)42 according to manufacturer’s instructions. Briefly, H650 cells were grown in RPMI (+10% dialyzed FBS) containing 13C6, 15N4-Arginine and 13C6-Lysine or standard RPMI (+10% FBS) for 10 days. Incorporation of heavy label was confirmed by LC-MS/MS (> 99%). For phosphotyrosine proteomics experiments (biological and technical duplicates), cells were lyzed using 20 mM HEPES pH 8.0, 9 M Urea, 1 mM sodium vanadate, 2.5 mM sodium pyrophosphate and 1 mM β-glycerophosphate. Tyrosine phoshopeptides were enriched using the PTMScan Phospho-Tyrosine Mouse mAb (P-Tyr-100) Kit (Cell Signaling #5636) according to manufacturer’s instructions. For SILAC-based experiments, samples were lyzed, digested, fractionated (SCX) into 12 concatenated fractions and global phosphopeptide enrichment was done using PHOS-Select Iron Affinity Gel (Sigma) according to manufacturer’s instructions. A nanoflow ultra high performance liquid chromatograph (RSLC, Dionex) coupled to an electrospray bench top orbitrap mass spectrometer (Q-Exactive plus, Thermo) was used for tandem mass spectrometry phosphopeptide sequencing experiments. The sample was first loaded onto a pre-column (2 cm × 100 μm ID packed with C18 reversed-phase resin, 5 μm, 100 Å) and washed for 8 minutes with aqueous 2% acetonitrile and 0.04% trifluoroacetic acid. The trapped peptides were eluted onto the analytical column, (C18, 75 μm ID × 50 cm, 2 μm particle size, 100 Å pore size, Dionex). The gradient was programmed as: 95% solvent A (2% acetonitrile + 0.1% formic acid) for 8 minutes, solvent B (90% acetonitrile + 0.1% formic acid) from 5% to 38.5% in 90 minutes, then solvent B from 50% to 90% B in 7 minutes and held at 90% for 5 minutes, followed by solvent B from 90% to 5% in 1 minute and re-equilibration for 10 minutes. The flow rate on the analytical column was 300 nL/min. Sixteen tandem mass spectra were collected in a data-dependent manner following each survey scan. MS/MS scans were performed using 60 second exclusion for previously sampled peptide peaks. Data were searched by MaxQuant v1.2.2.543–45 using the UniProt human database (downloaded 11/2014). Carbamidomethylation of cysteine, methionine oxidation and phosphorylation of serine, threonine and tyrosine were selected as variable modifications. For SILAC based experiments, 13C6, 15N4-Arginine and 13C6-Lysine were included as fixed modifications. Data was normalized using iterative rank order normalization (IRON)46 and imported into R for bioinformatic analysis. Phosphopeptide identification and quantification (XIC) was confirmed using Skyline47 (Supplementary Data Sets 8–9).
Proteomics and network analysis
For drug affinity chromatography experiments, exclusive unique spectral counts were used as a measure of abundance. Biological duplicates were averaged and the normalized spectral abundance factor (NSAF) and CRAPomePCT for each protein were calculated as previously described using a customized APOSTL distribution.48–49 Kinases with high NSAF and CRAPomePCT values were prioritized for validation by in vitro kinase assays. As drug affinity chromatography can pull down direct targets as well as binding partners, all kinases identified in these experiments were included in the network analysis. For phosphoproteomics experiments, MS1 intensity was used as the measure of abundance. Following IRON normalization, data were filtered for PEP score > 0.1, contaminants were removed and rows with all 0 intensity values were excluded from analysis. Log2 Fold Change values were calculated for both pY and pSTY (SILAC) datasets and student t-tests were performed for the pY dataset. Cutoffs of FoldChange = 2 and p-value = 0.1 for network analysis were assigned. Proteins passing filtering from both the chemical and phosphoproteomics experiments were queried for known interactions using STRING (confidence > 0.9). The resulting undirected network was imported into GEPHI for visualization and analysis.50 The community structure of the network by calculating the modularity28 was analyzed to identify community subnetworks. Modules 1–4 were selected for KEGG pathway analysis, which was done using the ClusterProfiler R package.51 The proteins present in the adherens junction, insulin signaling, mTOR signaling and focal adhesion pathways were merged with the KRAS pathway (KRAS, RAF, MEK) and other key upstream/downstream nodes not identified by proteomics (PI3K, AKT, YB1, p70RSK, RHOA). The resulting proteins were queried by STRING to generate the subnetwork. Eigenvector centrality and optimal communities were calculated using the igraph R package.52 Hive plot was made using the HiveR package53 and the adjacency matrix was made using ggplot2.54
ReKINect analysis
Mutational data for the H650 cells was obtained from CCLE29 and filtered for missense mutations and mutations that are known to yield errors in ReKINect were removed. The corresponding mutations were mapped onto the protein reference sequence (Uniprot) to generate a mutant FASTA file containing sequences of both the reference and mutated proteins. The mutant FASTA was analyzed using ReKINect30 (http://rekinect.info/home) and mutated proteins were queried for pathways (KEGG) using ClusterProfiler.51
NetworKIN analysis
Phosphorylation information for significantly altered pSTY peptides in the subnetwork was formatted and input in NetworKIN (http://networkin.info/).32 The output was filtered for kinase-substrate interactions with a NetworKIN score >2. The resulting predicted kinase-substrate interactions were used to generate a data-dependent kinase-substrate subnetwork containing significantly altered pSTY peptides from the phosphoproteomics and known/newly identified ceritinib targets.
Fluorescent caspase assay
H1155 cells were seeded at 1,000 cells/well in a 384 well plate. Drugs were diluted in media containing Incucyte Caspase-3/7 Reagent (#4440) and cells were treated 24 hours after plating. Fluorescence and confluence were measured every 2 hours for 72 hours.
Site-directed mutagenesis and rescue experiments
pDESTmycYBX1 was a kind gift from Thomas Tuschl (Addgene plasmid #19878).55 S102A and S102D mutants were created by Mutagenex and confirmed by sequencing. Plasmids were transiently transfected into H650 cells using the Lipofectamine 2000 transfection reagent (Invitrogen) according to manufacturers’ instructions. Protein expression was monitored by immunoblotting. Drug treatments were conducted 24 hours after transfection at the indicated concentrations using complete RPMI as the diluent.
Statistical Analysis
Histograms and F-tests were used to test for normality and to compare sample variances. Two-sided student’s t-tests and Wilcoxon Rank Sum tests were performed where appropriate. A minimum of 3 replicates was used to established statistical significance.
Tissue microarrays
Patient tissue microarray (TMA1) and PDX tissue microarray (TMA2) were constructed by US Biomax and Charles River, respectively. Slides were deparaffinized and rehydrated in successive washes of a xylene/ethanol gradient followed by HIER (pressure cooker) in sodium citrate buffer (10 mM sodium citrate, 0.05% Tween 20, pH 6). Nonspecific binding was blocked by incubating with 1.5% BSA/PBST, and slides were incubated overnight in 0.5% BSA/PBST with anti-FAK1 pY397 (Invitrogen, 700255). Slides were washed twice with PBST, incubated with EnVision+ anti-rabbit (K4011, Dako) for 1 hour and visualized by diaminobenzidine (DAB). Slides were counterstained with hematoxylin, rehydrated and hard-mounted. Each tumor was manually scored for the percentage of cells staining negative, weakly, moderately, or strongly (0, 1, 2 or 3, respectively) by a board-certified pathologist. H-scores were calculated for each tumor as follows:
Where X indicates the percentage of cells in each staining intensity category from negative to strongly positive. Replicate tumors for array TMA2 were averaged before analysis. Tumor data for TMA1 and TMA2 were merged and analyzed in R. We assigned a cutoff for pFAK1 high as an H-score ≥ 130 and defined moderate pFAK1 as an H-score of 100-130. Accompanying mutational data for array TMA2 was obtained from the Charles River PDX compendium.
Soft-agar 3D clonogenic assays
Three PDX tumor models from TMA2 with the highest pFAK1 staining scores were selected to perform ex vivo 3D clonogenic assays (tumor clonogenic assay, TCA). The TCA experiments were performed at Oncotest GmbH (Charles River) based on the company’s protocols. Viability measures were analyzed by Bliss to determine synergy when the PDX tumor models were treated with varying doses of ceritinib and paclitaxel.
Code Availability
Code used to generate figures will be made available upon request.
Data Availability
Proteomics RAW data will be made available in the PRIDE database upon publication of this manuscript (Project Name: Ceritinib Functional Proteomics; Project accession: PXD007137; Project DOI: 10.6019/PXD007137). Searched data is also provided in tabular format with this manuscript. Network files are available for viewing on Network Data Exchange (http://www.ndexbio.org)56 upon publication of this manuscript (UUID: cf910a1d-23ae-11e7-8f50-0ac135e8bacf; UUID: 22d7661f-23af-11e7-8f50-0ac135e8bacf).
Supplementary Material
Acknowledgments
This work was supported by the NIH/NCI R01 CA181746 (to U.R.), the NIH/NCI F99/K00 Predoctoral to Postdoctoral Transition Award F99 CA212456 (to B.M.K), the Moffitt NIH/NCI SPORE in Lung Cancer P50 CA119997 (to E.B.H.), Moffitt Pinellas Partners, and the H. Lee Moffitt Cancer Center and Research Institute. We wish to acknowledge the Moffitt Lung Cancer Center of Excellence and the Moffitt Chemical Biology (Chemistry Unit), Proteomics, Flow Cytometry, Molecular Genomics and Analytical Microscopy Core Facilities. Moffitt Core Facilities are supported by the National Cancer Institute (Award No. P30-CA076292) as a Cancer Center Support Grant. Proteomics is also supported by the Moffitt Foundation.
Footnotes
Author Contributions
B.M.K, L.L.R.R, J.M.K, E.B.H & U.R. conceived and designed the project. L.L.R.R & F.K. conducted the drug screen and B.M.K & U.R. analyzed the data. Chemistry was done by B.M.K. B.M.K performed chemical proteomics experiments and B.M.K & U.R. analyzed the data. Phosphoproteomics experiments were done by B.M.K & B.F. and B.M.K, P.A.S, & U.R. analyzed the data. B.M.K., L.L.R.R. and A.T.B. performed the western blots. B.M.K. conducted bioinformatic and network analyses. SiRNA and rescue experiments were done by B.M.K. B.M.K. and L.L.R.R. performed synergy experiments. B.M.K. performed all IHC, T.A.B. scored the slides and B.M.K analyzed the data. B.M.K. and U.R. wrote the manuscript. All authors read and approved the final manuscript.
Competing Financial Interests
The authors declare no competing financial interests.
References
- 1.Sawyers CL, et al. Imatinib induces hematologic and cytogenetic responses in patients with chronic myelogenous leukemia in myeloid blast crisis: results of a phase II study. Blood. 2002;99:3530–3539. doi: 10.1182/blood.v99.10.3530. [DOI] [PubMed] [Google Scholar]
- 2.Kwak EL, et al. Anaplastic lymphoma kinase inhibition in non-small-cell lung cancer. N Engl J Med. 2010;363:1693–1703. doi: 10.1056/NEJMoa1006448. [DOI] [PMC free article] [PubMed] [Google Scholar]
- 3.Flanagan ME, et al. Discovery of CP-690,550: a potent and selective Janus kinase (JAK) inhibitor for the treatment of autoimmune diseases and organ transplant rejection. J Med Chem. 2010;53:8468–8484. doi: 10.1021/jm1004286. [DOI] [PubMed] [Google Scholar]
- 4.Palla G, Derényi I, Farkas I, Vicsek T. Uncovering the overlapping community structure of complex networks in nature and society. Nature. 2005;435:814–818. doi: 10.1038/nature03607. [DOI] [PubMed] [Google Scholar]
- 5.Farkas IJ, et al. Network-Based Tools for the Identification of Novel Drug Targets. Sci Signal. 2011;4:pt3–pt3. doi: 10.1126/scisignal.2001950. [DOI] [PubMed] [Google Scholar]
- 6.Hopkins AL. Network pharmacology: the next paradigm in drug discovery. Nat Chem Biol. 2008;4:682–690. doi: 10.1038/nchembio.118. [DOI] [PubMed] [Google Scholar]
- 7.Barabási AL, Gulbahce N, Loscalzo J. Network medicine: a network-based approach to human disease. Nat Rev Genet. 2011;12:56–68. doi: 10.1038/nrg2918. [DOI] [PMC free article] [PubMed] [Google Scholar]
- 8.Paraiso KHT, et al. Recovery of phospho-ERK activity allows melanoma cells to escape from BRAF inhibitor therapy. Br J Cancer. 2010;102:1724–1730. doi: 10.1038/sj.bjc.6605714. [DOI] [PMC free article] [PubMed] [Google Scholar]
- 9.Knight ZA, Lin H, Shokat KM. Targeting the cancer kinome through polypharmacology. Nat Rev Cancer. 2010;10:130–137. doi: 10.1038/nrc2787. [DOI] [PMC free article] [PubMed] [Google Scholar]
- 10.Lombardo LJ, et al. Discovery of N-(2-chloro-6-methyl-phenyl)-2-(6-(4-(2-hydroxyethyl)-piperazin-1-yl)-2-methylpyrimidin-4- ylamino)thiazole-5-carboxamide (BMS-354825), a dual Src/Abl kinase inhibitor with potent antitumor activity in preclinical assays. J Med Chem. 2004;47:6658–6661. doi: 10.1021/jm049486a. [DOI] [PubMed] [Google Scholar]
- 11.Rubbi L, et al. Global phosphoproteomics reveals crosstalk between Bcr-Abl and negative feedback mechanisms controlling Src signaling. Sci Signal. 2011;4:ra18. doi: 10.1126/scisignal.2001314. [DOI] [PMC free article] [PubMed] [Google Scholar]
- 12.Frett B, et al. Fragment-Based Discovery of a Dual pan-RET/VEGFR2 Kinase Inhibitor Optimized for Single-Agent Polypharmacology. Angew Chem Int Ed Engl. 2015;54:8717–8721. doi: 10.1002/anie.201501104. [DOI] [PMC free article] [PubMed] [Google Scholar]
- 13.Davis MI, et al. Comprehensive analysis of kinase inhibitor selectivity. Nat Biotechnol. 2011;29:1046–1051. doi: 10.1038/nbt.1990. [DOI] [PubMed] [Google Scholar]
- 14.Godl K, et al. An efficient proteomics method to identify the cellular targets of protein kinase inhibitors. Proc Natl Acad Sci U S A. 2003;100:15434–15439. doi: 10.1073/pnas.2535024100. [DOI] [PMC free article] [PubMed] [Google Scholar]
- 15.Bantscheff M, et al. Quantitative chemical proteomics reveals mechanisms of action of clinical ABL kinase inhibitors. Nat Biotechnol. 2007;25:1035–1044. doi: 10.1038/nbt1328. [DOI] [PubMed] [Google Scholar]
- 16.Ong S-E, et al. Identifying the proteins to which small-molecule probes and drugs bind in cells. Proc Natl Acad Sci U S A. 2009;106:4617–4622. doi: 10.1073/pnas.0900191106. [DOI] [PMC free article] [PubMed] [Google Scholar]
- 17.Remsing Rix LL, et al. GSK3 alpha and beta are new functionally relevant targets of tivantinib in lung cancer cells. ACS Chem Biol. 2014;9:353–358. doi: 10.1021/cb400660a. [DOI] [PMC free article] [PubMed] [Google Scholar]
- 18.Marsilje TH, et al. Synthesis, Structure–Activity Relationships, and in Vivo Efficacy of the Novel Potent and Selective Anaplastic Lymphoma Kinase (ALK) Inhibitor 5-Chloro-N2-(2-isopropoxy-5-methyl-4-(piperidin-4-yl)phenyl)-N4-(2-(isopropylsulfonyl)phenyl)pyrimidine-2,4-diamine (LDK378) Currently in Phase 1 and Phase 2 Clinical Trials. J Med Chem. 2013;56:5675–5690. doi: 10.1021/jm400402q. [DOI] [PubMed] [Google Scholar]
- 19.Sabbatini P, et al. GSK1838705A inhibits the insulin-like growth factor-1 receptor and anaplastic lymphoma kinase and shows antitumor activity in experimental models of human cancers. Mol Cancer Ther. 2009;8:2811–2820. doi: 10.1158/1535-7163.MCT-09-0423. [DOI] [PubMed] [Google Scholar]
- 20.Shaw AT, et al. Ceritinib in ALK-Rearranged Non–Small-Cell Lung Cancer. N Engl J Med. 2014;370:1189–1197. doi: 10.1056/NEJMoa1311107. [DOI] [PMC free article] [PubMed] [Google Scholar]
- 21.Nishio M, et al. Phase I Study of Ceritinib (LDK378) in Japanese Patients with Advanced, Anaplastic Lymphoma Kinase-Rearranged Non–Small-Cell Lung Cancer or Other Tumors. J Thorac Oncol. 2015;10:1058–1066. doi: 10.1097/JTO.0000000000000566. [DOI] [PMC free article] [PubMed] [Google Scholar]
- 22.Friboulet L, et al. The ALK inhibitor ceritinib overcomes crizotinib resistance in non-small cell lung cancer. Cancer Discov. 2014;4:662–673. doi: 10.1158/2159-8290.CD-13-0846. [DOI] [PMC free article] [PubMed] [Google Scholar]
- 23.Fisher TL, Blenis J. Evidence for two catalytically active kinase domains in pp90rsk. Mol Cell Biol. 1996;16:1212–1219. doi: 10.1128/mcb.16.3.1212. [DOI] [PMC free article] [PubMed] [Google Scholar]
- 24.Bjørbæk C, Zhao Y, Moller DE. Divergent Functional Roles for p90rsk Kinase Domains. J Biol Chem. 1995;270:18848–18852. doi: 10.1074/jbc.270.32.18848. [DOI] [PubMed] [Google Scholar]
- 25.Vik TA, Ryder JW. Identification of Serine 380 as the Major Site of Autophosphorylation of Xenopus pp90rsk. Biochem Biophys Res Commun. 1997;235:398–402. doi: 10.1006/bbrc.1997.6794. [DOI] [PubMed] [Google Scholar]
- 26.Romeo Y, Zhang X, Roux PP. Regulation and function of the RSK family of protein kinases. Biochem J. 2012;441:553–569. doi: 10.1042/BJ20110289. [DOI] [PubMed] [Google Scholar]
- 27.Szklarczyk D, et al. STRING v10: protein–protein interaction networks, integrated over the tree of life. Nucleic Acids Res. 2015;43:D447–D452. doi: 10.1093/nar/gku1003. [DOI] [PMC free article] [PubMed] [Google Scholar]
- 28.Blondel VD, Guillaume J-L, Lambiotte R, Lefebvre E. Fast unfolding of communities in large networks. J Stat Mech Theory Exp. 2008;2008:P10008. [Google Scholar]
- 29.Barretina J, et al. The Cancer Cell Line Encyclopedia enables predictive modelling of anticancer drug sensitivity. Nature. 2012;483:603–307. doi: 10.1038/nature11003. [DOI] [PMC free article] [PubMed] [Google Scholar]
- 30.Creixell P, et al. Kinome-wide Decoding of Network-Attacking Mutations Rewiring Cancer Signaling. Cell. 2015;163:202–217. doi: 10.1016/j.cell.2015.08.056. [DOI] [PMC free article] [PubMed] [Google Scholar]
- 31.Wang J, Chen G, Li M, Pan Y. Integration of breast cancer gene signatures based on graph centrality. BMC Syst Biol. 2011;5(Suppl 3):S10. doi: 10.1186/1752-0509-5-S3-S10. [DOI] [PMC free article] [PubMed] [Google Scholar]
- 32.Linding R, et al. NetworKIN: a resource for exploring cellular phosphorylation networks. Nucleic Acids Res. 2007;36:D695–D699. doi: 10.1093/nar/gkm902. [DOI] [PMC free article] [PubMed] [Google Scholar]
- 33.Clauset A, Newman MEJ, Moore C. Finding community structure in very large networks. Phys Rev E. 2004:70. doi: 10.1103/PhysRevE.70.066111. [DOI] [PubMed] [Google Scholar]
- 34.Andersson S, D’Arcy P, Larsson O, Sehat B. Focal adhesion kinase (FAK) activates and stabilizes IGF-1 receptor. Biochem Biophys Res Commun. 2009;387:36–41. doi: 10.1016/j.bbrc.2009.06.088. [DOI] [PubMed] [Google Scholar]
- 35.Kang Y, et al. Role of Focal Adhesion Kinase in Regulating YB–1–Mediated Paclitaxel Resistance in Ovarian Cancer. J Natl Cancer Inst. 2013;105:1485–1495. doi: 10.1093/jnci/djt210. [DOI] [PMC free article] [PubMed] [Google Scholar]
- 36.Shiota M, et al. Targeting ribosomal S6 kinases/Y-box binding protein-1 signaling improves cellular sensitivity to taxane in prostate cancer. The Prostate. 2014;74:829–838. doi: 10.1002/pros.22799. [DOI] [PubMed] [Google Scholar]
- 37.Sumi NJ, Kuenzi BM, Knezevic CE, Remsing Rix LL, Rix U. Chemoproteomics Reveals Novel Protein and Lipid Kinase Targets of Clinical CDK4/6 Inhibitors in Lung Cancer. ACS Chem Biol. 2015;10:2680–2686. doi: 10.1021/acschembio.5b00368. [DOI] [PMC free article] [PubMed] [Google Scholar]
- 38.Ott GR, et al. Discovery of Clinical Candidate CEP-37440, a Selective Inhibitor of Focal Adhesion Kinase (FAK) and Anaplastic Lymphoma Kinase (ALK) J Med Chem. 2016;59:7478–7496. doi: 10.1021/acs.jmedchem.6b00487. [DOI] [PubMed] [Google Scholar]
- 39.Konstantinidou G, et al. RHOA-FAK Is a Required Signaling Axis for the Maintenance of KRAS-Driven Lung Adenocarcinomas. Cancer Discov. 2013;3:444–457. doi: 10.1158/2159-8290.CD-12-0388. [DOI] [PMC free article] [PubMed] [Google Scholar]
- 40.de Hoon MJL, Imoto S, Nolan J, Miyano S. Open source clustering software. Bioinformatics. 2004;20:1453–1454. doi: 10.1093/bioinformatics/bth078. [DOI] [PubMed] [Google Scholar]
- 41.Ritz C, Baty F, Streibig JC, Gerhard D. Dose-Response Analysis Using R. PLOS ONE. 2015;10:e0146021. doi: 10.1371/journal.pone.0146021. [DOI] [PMC free article] [PubMed] [Google Scholar]
- 42.Ong S-E, et al. Stable Isotope Labeling by Amino Acids in Cell Culture, SILAC, as a Simple and Accurate Approach to Expression Proteomics. Mol Cell Proteomics. 2002;1:376–386. doi: 10.1074/mcp.m200025-mcp200. [DOI] [PubMed] [Google Scholar]
- 43.Cox J, et al. A practical guide to the MaxQuant computational platform for SILAC-based quantitative proteomics. Nat Protoc. 2009;4:698–705. doi: 10.1038/nprot.2009.36. [DOI] [PubMed] [Google Scholar]
- 44.Tyanova S, Mann M, Cox J. MaxQuant for in-depth analysis of large SILAC datasets. Methods Mol Biol Clifton NJ. 2014;1188:351–364. doi: 10.1007/978-1-4939-1142-4_24. [DOI] [PubMed] [Google Scholar]
- 45.Cox J, Mann M. MaxQuant enables high peptide identification rates, individualized p.p.b.-range mass accuracies and proteome-wide protein quantification. Nat Biotechnol. 2008;26:1367–1372. doi: 10.1038/nbt.1511. [DOI] [PubMed] [Google Scholar]
- 46.Welsh EA, Eschrich SA, Berglund AE, Fenstermacher DA. Iterative rank-order normalization of gene expression microarray data. BMC Bioinformatics. 2013;14:153. doi: 10.1186/1471-2105-14-153. [DOI] [PMC free article] [PubMed] [Google Scholar]
- 47.MacLean B, et al. Skyline: an open source document editor for creating and analyzing targeted proteomics experiments. Bioinforma Oxf Engl. 2010;26:966–968. doi: 10.1093/bioinformatics/btq054. [DOI] [PMC free article] [PubMed] [Google Scholar]
- 48.Zybailov B, et al. Statistical Analysis of Membrane Proteome Expression Changes in Saccharomyces cerevisiae. J Proteome Res. 2006;5:2339–2347. doi: 10.1021/pr060161n. [DOI] [PubMed] [Google Scholar]
- 49.Kuenzi BM, et al. APOSTL: An Interactive Galaxy Pipeline for Reproducible Analysis of Affinity Proteomics Data. J Proteome Res. 2016;15(12):4747–4754. doi: 10.1021/acs.jproteome.6b00660. [DOI] [PMC free article] [PubMed] [Google Scholar]
- 50.Bastian M, Heymann S, Jacomy Gephi: an open source software for exploring and manipulating networks. 2009 [Google Scholar]
- 51.Yu G, Wang L-G, Han Y, He Q-Y. ClusterProfiler: an R package for comparing biological themes among gene clusters. Omics J Integr Biol. 2012;16:284–287. doi: 10.1089/omi.2011.0118. [DOI] [PMC free article] [PubMed] [Google Scholar]
- 52.Csardi G, Nepusz T. The igraph software package for complex network research. Inter Journal Complex Systems. 2006;1695 [Google Scholar]
- 53.Hanson B. HiveR: 2D and 3D Hive Plots for R. R Package Version 0255. 2016 [Google Scholar]
- 54.Wickham H. ggplot2: Elegant Graphics for Data Analysis. Springer-Verlag; New York: 2009. [Google Scholar]
- 55.Landthaler M, et al. Molecular characterization of human Argonaute-containing ribonucleoprotein complexes and their bound target mRNAs. RNA. 2008;14:2580–2596. doi: 10.1261/rna.1351608. [DOI] [PMC free article] [PubMed] [Google Scholar]
- 56.Pratt D, et al. NDEx, the Network Data Exchange. Cell Syst. 2015;1:302–305. doi: 10.1016/j.cels.2015.10.001. [DOI] [PMC free article] [PubMed] [Google Scholar]
Associated Data
This section collects any data citations, data availability statements, or supplementary materials included in this article.
Supplementary Materials
Data Availability Statement
Proteomics RAW data will be made available in the PRIDE database upon publication of this manuscript (Project Name: Ceritinib Functional Proteomics; Project accession: PXD007137; Project DOI: 10.6019/PXD007137). Searched data is also provided in tabular format with this manuscript. Network files are available for viewing on Network Data Exchange (http://www.ndexbio.org)56 upon publication of this manuscript (UUID: cf910a1d-23ae-11e7-8f50-0ac135e8bacf; UUID: 22d7661f-23af-11e7-8f50-0ac135e8bacf).