

Abstract
The decrease in sequencing cost and increased sophistication of assembly algorithms for short-read platforms has resulted in a sharp increase in the number of species with genome assemblies. However, these assemblies are highly fragmented, with many gaps, ambiguities, and errors, impeding downstream applications. We demonstrate current state of the art for de novo assembly using the domestic goat (Capra hircus), based on long reads for contig formation, short reads for consensus validation, and scaffolding by optical and chromatin interaction mapping. These combined technologies produced the most continuous de novo mammalian assembly to date, with chromosome-length scaffolds and only 649 gaps. Our assembly represents a ~400-fold improvement in continuity due to properly assembled gaps compared to the previously published C. hircus assembly, and better resolves repetitive structures longer than 1 kb, representing the largest repeat family and immune gene complex ever produced for an individual of a ruminant species.
Introduction
A finished, accurate reference genome is essential for advanced genomic selection of productive traits and gene editing in agriculturally relevant plant and animal species1–3. Thus, efficient genome finishing technologies will be of immediate benefit to researchers of these organisms. Substantial progress has been made in methods for generating contigs from whole genome shotgun (WGS) sequencing; yet finishing genomes remains a labor-intensive process that is unfeasible for most large, highly repetitive genomes. The successful production of the human reference genome assembly draft in 20014 was followed by three years of intensive curation by 18 individual institutions5, to produce the best available reference genome assembly for a mammalian species, of which the current version (GRCh38) contains only 832 heterochromatin-associated gaps. While inexpensive short-read sequencing has allowed the creation of a substantial number of draft genome assemblies, they are highly fragmented because high-throughput methods for finishing were not available6.
Repeats pose the largest challenge for reference genome assembly, and much effort has been devoted to resolving the ambiguous assembly gaps caused by repetitive DNA sequence7. Numerous scaffolding technologies have been developed for ordering and orienting assembly contigs8–12, including the recent approaches of chromosome interaction mapping (Hi-C)13 and optical mapping14, which provide relatively inexpensive and high-resolution scaffolding data15–19. Hi-C is an adaptation of the chromosome conformation capture (3C) methodology20 that identifies long-range chromosome interactions in an unbiased fashion, without a priori target site selection. The frequency of long-range consensus interactions decays rapidly based on linear distance along a chromosome, allowing Hi-C data to scaffold assembled contigs to the scale of full chromosomes15. Optical mapping technologies observe the linear separation of small DNA motifs (often restriction enzyme recognition sites19 or nickase sites21), which can provide sufficient contextual information to scaffold assembled contigs22 or correct existing reference assemblies23. Both optical mapping21 and Hi-C15 yield excellent scaffold continuity metrics15,17,18,24. However, both methods have limited ability to scaffold small contigs present in fragmented short-read assemblies25.
Single-molecule sequencing26 can now produce reads tens of kilobases in size, albeit with relatively high error rate. The PacBio RSII sequencing platform achieves an average read length of 14 kb, with maximum read lengths exceeding 60 kb27, and is routinely used to reconstruct complete bacterial genomes28,29 and highly continuous eukaryotic genomes27,30,31. When maximum read length exceeds the maximum repeat size, it is theoretically possible to assemble complete mammalian chromosomes. However, the read depth required to ensure all repeats are spanned by such reads is currently prohibitive, so mammalian assemblies will continue to comprise thousands of pieces27,30 until average read lengths exceed ~30 kb. Currently, combinations of long-read sequencing and long-range scaffolding represent the most efficient approach to produce near-finished reference assemblies. For example, a recent study using long-read sequencing and optical mapping assembled a human genome de novo into 4,007 contigs and 202 scaffolds that covered the entire reference assembly31.
Here we present a near-finished reference genome for the domestic goat (Capra hircus) using a combination of long-read single-molecule sequencing, high-fidelity short read sequencing, optical mapping, and Hi-C-based chromatin interaction maps. Unlike cattle, which are derived from two different sub-species32, extant domestic goats appear to derive from a single wild ancestor, the bezoar33. Due to this singular domestication event, creation of a polished reference genome for goat could enable easier identification of adaptive variants in sequence data from descendent breeds. The most recent goat assembly was generated via short-read sequencing and optical mapping, and is highly fragmented18. Our new assembly strategy achieves superior continuity and accuracy, is cost effective compared to past finishing approaches, and provides a new standard reference for ruminant genetics.
Results
De novo assembly of a Capra hircus reference genome
We sequenced an adult male goat of the San Clemente breed that displayed a high degree of homozygosity to minimize heterozygous alleles and simplify assembly. A combination of three technologies were applied: single-molecule real-time sequencing (PacBio RSII), paired-end sequencing (Illumina HiSeq), and Hi-C (Phase Genomics). Optical mapping (Bionano Genomics Irys) data was also generated, but came from an adolescent son of the reference individual due to tissue storage complications. Assembly of these complementary data types proceeded in a stepwise fashion (Methods), producing progressively improved assemblies (Table 1, Fig. 1). Initial assembly of the PacBio data alone resulted in a contig NG50 of 3.8 Mbp (NG50: half of the haploid genome size is accounted for by contigs of this size or greater). PacBio contigs were first scaffolded using optical mapping data, and the resulting scaffolds were clustered using Hi-C data into chromosome-scale scaffolds. To assess quality, the resulting assembly was validated via statistical methods and comparison to a radiation hybrid (RH) map34 (Supplementary Table 1) and previous assemblies (Supplementary Note). To maximize accuracy of the final reference assembly, the RH map was used to correct 21 inversions (consisting of 83 scaffolds) and 4 misplacements before final gap-filling and polishing35,36. Our final assembly, ARS1, totals 2.92 Gbp of sequence with a contig NG50 of 18.7 Mbp, a scaffold NG50 of 87 Mbp, and an estimated QV of 34.5 (Table 1, Fig. 2, Supplementary Note)37. After error correction and validation, ARS1 contains four major disagreements with the RH map (Fig. 3) that will require further investigation to confirm. Considering that ARS1 comprises just 31 scaffolds and 649 gaps covering 30 of the 31 haploid, acrocentric goat chromosomes38 (excluding only the Y chromosome), our assembly compares favorably with the current human reference (GRCh38), which has 24 scaffolds, 169 unplaced/unlocalized scaffolds, and 832 gaps in the primary assembly39.
Table 1.
Assembly statistics
| Assembly1 | Contigs2 | Scaffolds | Unplaced contigs3 | Degenerate contigs4 | Contig NG50 (Mbp)5 | Scaffold NG50 (Mbp)5 | Assembly Size (Gbp) | Assembly in Scaffolds (%) |
|---|---|---|---|---|---|---|---|---|
| PacBio | 3,074 | – | – | 30,693 | 3.795 | – | 2.914 | N/A |
| Optical Map | – | 2,944 | – | – | – | 1.487 | 2.748 | N/A |
| PacBio + Optical Map | 1,109 | 333 | 1,242 | 30,693 | 10.197 | 20.623 | 2.910 | 90.89 |
| PacBio + Hi-C | 2,115 | 31 | 959 | 30,693 | 3.795 | 88.799 | 2.910 | 87.97 |
| PacBio + Optical Map + Hi-C | 1,780 | 31 | 571 | 30,693 | 10.197 | 87.347 | 2.910 | 89.05 |
| ARS1 | 680 | 31 | 654 | 29,315 | 18.702 | 87.277 | 2.924 | 88.32 |
Assemblies are listed in order of their inclusion of scaffolding technologies towards the final assembly (ARS1), with the original contigs (PacBio) scaffolded using different technologies (Optical Map and Hi-C, respectively). Since the optical map, IrysScaffold program generates an assembly from the consensus of labelled DNA molecules, we have included scaffold statistics from this data (Optical Map) for comparison.
The number of continuous stretches of sequence within the scaffold without gaps larger than 3 bases in length of at least 10 bases.
Unplaced contigs are defined as input contigs or scaffolds that were not placed by the Optical Map or Hi-C in a scaffold were excluded from the scaffold counts.
Degenerate contigs were assembled unitigs that had less than 50 PacBio reads supporting their assembly (Supplementary Note). Differences in degenerate contig counts in the final ARS1 assembly are due to PBJelly merging of degenerate contigs (538 contigs), and removal due to no supporting PacBio read alignments (840).
All NG50 values are based on the ARS1 assembly size: 2.924 Gbp. For the PacBio entry, no scaffolds were generated so only the contig NG50 is reported.
Figure 1.
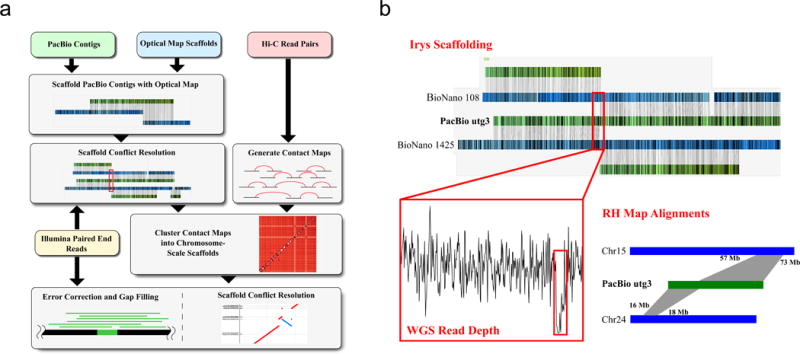
Assembly schema for producing chromosome-length scaffolds. (A) Four different sets of sequencing data (long-read WGS, Hi-C data, optical mapping and short-read WGS) were produced in order to generate the goat reference genome. A tiered scaffolding approach using optical mapping data followed by Hi-C proximity guided assembly produced the highest quality genome assembly. (B) In order to correct misassemblies resulting from contig- or scaffold-errors, a consensus approach was used. An example from the initial optical mapping dataset is shown in the figure. A scaffold fork was identified on contig 3 (a 91 Mbp length contig) from the optical mapping data. Mapping of short-read WGS data showed signature that there was a misassembly near the 13th megabase of the contig, so it was split at this region. Subsequent analysis based on the RH map confirmed this split.
Figure 2.
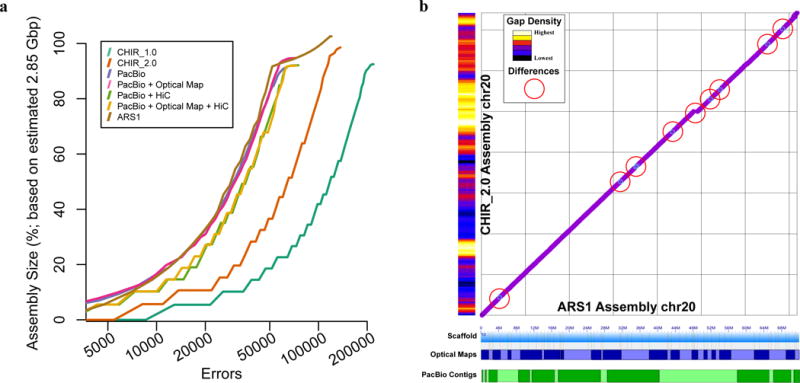
Assembly benchmarking comparisons reveal high degree of assembly completion. (A) Feature response curves (FRC) showing the error rate as a function of the number of bases in each assembly (CHIR_1.0, CHIR_2.0, and ARS1) and each scaffold test (intermediary assemblies using a combination of Hi-C and Bionano scaffolding). (B) Comparison plots of chromosome 20 sequence between the ARS1 and CHIR_2.0 assemblies reveal several small inversions (light blue circles) and a small insertion of sequence (break in continuity) in the ARS1 assembly. Red circles highlight 9 of the aforementioned inversions and the insertion of sequence in our assembly. The ARS1 assembly contains only 10 gaps on this chromosome scaffold whereas CHIR_2.0 has 5,651 gaps on the same chromosome assembly (gap density histogram on the Y axis). ARS1 optical map scaffolds and Pacbio contigs represented on the X axis as alternating patterns of blue and green shades, respectively, showing the tiling path that comprises the entire single chromosome scaffold.
Figure 3.

RH probe map shows excellent assembly continuity. ARS1 RH probe mapping locations were plotted against the RH map order. Each ARS1 scaffold corresponds to an RH map chromosome with the exception of X which is composed of two scaffolds. Red circles highlight two intrachromosomal (on chrs 1 and 23) and two interchromosomal misassemblies (on chrs 18 and 17) in ARS1 that were difficult to resolve.
Scaffolding technology comparisons
We compared initial de novo optical map and Hi-C scaffolds to our final validated reference assembly, in order to evaluate the independent performance of the two scaffolding strategies. The optical map consisted of 2,944 scaffolds with an NG50 of 1.487 Mbp. We believe that optical map fragment sizes (Supplementary Fig. 1) were likely limited by double-strand breaks caused by close proximity of Nt.BsqI sites on opposing DNA strands, as reported previously21. Optical map scaffolding of PacBio contigs produced an assembly of 333 scaffolds, containing 90.89% of the final ARS1 assembly length, with a scaffold NG50 of 20.623 Mbp and identified 36 misassemblies in the PacBio contigs. This two-fold increase in NG50 value over the individual technologies (Table 1) is likely due to the complementary nature of their error profiles; the long PacBio reads span shorter, low-complexity repeats, while the optical map spans larger segmental duplications. In comparison, scaffolding of PacBio contigs with Hi-C data yielded 31 scaffolds containing 87.9% of the total assembly length (Table 1; Supplementary Fig. 2 and Supplementary Table 2). These scaffolds had an NG50 four times larger than the scaffolds generated by optical mapping, but with a relatively higher rate of mis-oriented contigs when compared to the RH map34 (Supplementary Note). Analysis of the mis-oriented contigs revealed that orientation error was correlated with the density of Hi-C restriction sites in the contig (Supplementary Table 3), which might be improved by choosing restriction enzymes with shorter recognition sites (or DNase Hi-C40) to improve Hi-C link density and reduce the associated orientation error rate. Ultimately, we found that sequential scaffolding with optical mapping data followed by Hi-C data yielded an assembly with the highest continuity and best agreement with the RH map (Fig. 1). Thus, the final ARS1 assembly was based on this approach and the remaining inversions found in comparisons to the RH map were corrected manually before final gap filling and polishing.
Assembly benchmarking and comparison to reference
The goat CHIR_1.0 reference assembly18 was generated from paired-end short reads using the SOAPdenovo2 assembler, a restriction-enzyme based optical map, and cross-species scaffold alignments to the Bos taurus UMD3.1 reference assembly41. The CHIR_2.0 assembly (CHIR_2.0 NCBI accession number: GCA_000317765.2) is a recent improvement to the CHIR_1.0 assembly that used the goat radiation hybrid map data for scaffolding and likely included additional curation, but has not yet been described. Paired-end read sequences used to create the Black Yunan goat CHIR_1.0 reference assembly18 were aligned to CHIR_1.0, CHIR_2.0, and our ARS1 assembly for a reference-free measure of structural correctness42–44 (Supplementary Note). These alignments confirmed that CHIR_2.0 is a general improvement over CHIR_1.0, with fewer putative deletions (2,735 vs. 10,256) and duplications (115 vs. 290); however, CHIR_2.0 also contains 50-fold more putative inversions than CHIR_1.0 (215 vs. 4; Supplementary Table 4). Our ARS1 assembly is a further improvement over CHIR_2.0, with fourfold fewer deletions and 50-fold fewer inversions identified. This is particularly notable given that the Black Yunan data was not used for constructing ARS1, yet our assembly is more consistent with the Black Yunan paired-end data than the CHIR_1.0 and CHIR_2.0 assemblies themselves. We assessed large-scale structural continuity of each assembly by aligning fosmid end sequence and identifying structural variants (Methods; Supplementary Table 5). ARS1 had half the number of trans-scaffold discrepancies (BND variants: 456) of CHIR_2.0 (840) and had 13 fewer assembly errors per 100 Mbp. This independent validation suggests that ARS1 corrects numerous errors present in CHIR_2.0 (Fig. 2).
We also assessed the quantity and size of gaps in each respective assembly (Supplementary Table 6). The CHIR_2.0 reference filled 62.4% of CHIR_1.0 gap sequences (160,299 gaps filled), whereas our assembly filled 94.3% of all CHIR_1.0 gaps (242,268 gaps filled). The remaining CHIR_1.0 gaps (13,853) had flanking sequence that mapped to two separate chromosomes in our assembly, indicating potential false gaps due to errors in the CHIR_1.0 assembly. WGS sequence alignments from our San Clemente reference animal as well as alignments of gap fill regions from CHIR_2.0 agreed with our assembly in closed gap locations (Methods), revealing 200,624 CHIR_1.0 gaps (77.02% of total) confirmed as closed in ARS1. Of the remaining 59,850 CHIR_1.0 gaps that were not confirmed as closed in ARS1, 52 coincided with gaps in ARS1, 568 were predicted to be filled by greater than 10 kbp of sequence, and 23 did not have flanking sequence that could be mapped to the ARS1 assembly. Because gaps coinciding with ARS1 gaps are currently ambiguous, it is difficult to ascertain the true status of these remaining regions. Fosmid end structural variant calls (Supplementary Table 5) intersected 14 of ARS1 gap regions, suggesting that there are structural discrepancies or assembly errors that contribute to the unknown gaps in ARS1. In total, our assembly contains 649 sequence gaps (larger than 3 bp) in the chromosomal scaffolds split among gaps of known (515 inferred from optical mapping distances) and unknown (134 Hi-C scaffold joining) sizes. Compared to CHIR_2.0, ARS1 has 1,000-fold fewer ambiguous bases and improves even the core gene annotation over the short-read assembly by receiving a two point higher BUSCO score45 (82% vs 80%, respectively).
Improvement in genetic marker tools and functional annotation
We quantified the benefit of our approach over short-read assembly methods with respect to genome annotation and downstream functional analysis. Chromosome-scale continuity of the ARS1 assembly was found to have appreciable positive impact on genetic marker order for the existing Capra hircus 52k SNP chip3 (Supplementary Table 7). Of the 1,723 SNP probes currently mapped to the unplaced contigs of the CHIR_2.0 assembly, we identified chromosome locations for 1,552 unplaced markers (90.0% of 1,723 unplaced) and identified 26 markers with ambiguous mapping locations (1.8% of 1,466 low-call rate markers)3. This finding suggests that the latter markers were unknowingly targeting repeat sequences and may explain why their call rate was poor.
After annotation, we found 3,495 newly annotated gene models (Methods) that contained at least one gap in the CHIR_2.0 assembly that was filled by our assembly (Supplementary Table 6). We also identified 1,926 predicted exons that contained gaps in CHIR_1.0 and CHIR_2.0 but were resolved by our assembly (Fig. 4a). Significantly, annotation of repetitive immune gene regions revealed that complete complements of the leukocyte receptor complex (LRC) and natural killer cell complex (NKC) were contained within single autosomal scaffolds in our assembly (Fig. 5). These regions are particularly difficult to assemble with short-read technologies because they are highly polymorphic and repetitive46, with gene content being largely species-specific. The successful assembly and annotation of these regions in ARS1 is an important achievement (Supplementary Note and Supplementary Figs. 3, 4, and 5).
Figure 4.
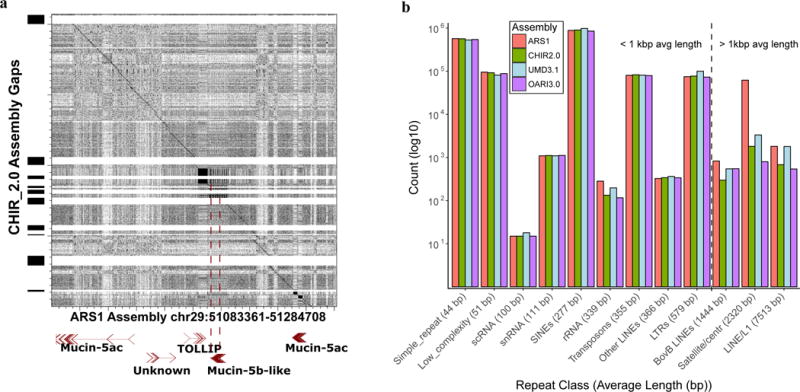
Long-read assembly with complementary scaffolding resolves gap regions (A) and long repeats (B) that cause problems for short-read reference annotation. (A) A region of the Mucin gene cluster was resolved by long-read assembly, resulting in a complete gene model for Mucin-5b-Like that was impossible due to two assembly gaps in the CHIR_2.0 assembly. (B) Counts of repetitive elements that had greater than 75% sequence length and greater than 60% identity with RepBase database entries for ruminant lineages. With the exception of the rRNA cluster (which is present in many repeated copies in the genome), the CHIR_2.0 reference contained a full complement of shorter repeat segments that were also present in our assembly. However, repeats that were larger than 1 kb were present in higher numbers in our assembly due to our ability to traverse the entire repetitive element’s length.
Figure 5.
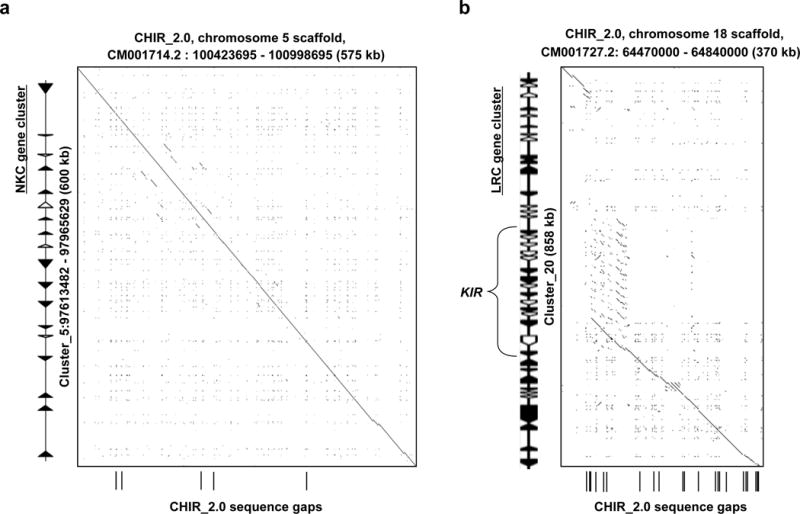
(A) A region of the Natural Killer Cell (NKC) gene cluster was fragmented in the CHIR_2.0 reference genome but is present on a single contig within ARS1. (B) Likewise, the Leukocyte Receptor Complex (LRC) locus was poorly represented in CHIR_2.0, and was missing ~500 kb of sequence. For highly repetitive and polymorphic gene families, our assembly approach provided the best resolution and highest continuity of gene sequence.
Structural elements and karyotype
The combination of technologies used for ARS1 significantly improves on repeat resolution versus previous assembly approaches, including both short-read and Sanger sequencing projects41,47. Large fractions of the Y chromosome and heterochromatin regions are now assembled, which are typically absent from de novo assembly efforts. For example, the presence of > 5 kbp of telomeric sequence on six autosomes indicates that scaffolds have reached one end of the acrocentric chromosomes. Using previously determined centromeric repeat sequence for goat48, we identified 15 of our chromosome scaffolds that included centromeric repeats greater than 2 kbp in length (Methods) suggesting inclusion of the centromeric ends. Seven chromosomes (1, 6, 12, 13, 22, 26, and 29) had centromeric repeat sequence alignments that were larger than 8 kbp in length. Chromosomes 19 and 23 have centromere and telomere repeats on opposite ends, consistent with complete chromosome-wide assembly. Two scaffolds (corresponding to chromosomes 13 and 28) have centromeric repeats 3 Mbp from the end, suggesting that the ARS1 assembly includes the elusive p arm of these acrocentric chromosomes (Methods). Additionally, closer examination of the optical maps revealed 34 maps containing large tandem and interspersed repetitive nickase motifs with a cumulative size of four megabases that did not align to the long-read contigs (Supplementary Table 8). Since these repetitive maps also did not align to any prior Capra hircus assembly, these may represent constitutive heterochromatin that could not be assembled using other technologies. We identified 105 additional repetitive patterns greater than 12 kb in the optical map that were represented in ARS1, distributed among all Hi-C chromosome scaffolds except chromosomes 9 and 10. Finer scale repeat identification using the RepeatMasker49 algorithm confirmed that the larger classes of repetitive elements (greater than 1 kb) were resolved in ARS1 (Fig. 4b), and 66% more BovB LINE repeats were assembled to at least 75% of the repeat length than in CHIR_2.0. Significantly, 43.6% of the CHIR_2.0 gaps that ARS1 successfully closes coincided with BovB repeats greater than 3.5 kbp in length (Supplementary Fig. 6 and Supplementary Table 9). Comparison of fosmid end sequence data to repetitive sequence identified only five structural variants (two predicted “duplications,” two predicted “deletions” and one “inversion”) that intersected with our larger repetitive regions, including the predicted centromeric region on chromosome 10 (Supplementary Note), suggesting that at least five large repeats (5 / 30,347 repeats larger than 1 kb, or 0.016% of identified repeats) in ARS1 may be misassembled.
The final ARS1 assembly contained two scaffolds that mapped to two different—but continuous—regions of the X chromosome; representing 85.9% of the expected chromosome size (assuming a size of 150 Mbp38). Self-hit alignment filtering, and cross-species alignment to existing Y chromosome scaffolds in cattle, identified 10 Mbp of sequence that may have originated from the Capra hircus Y chromosome, approximately 50% of the estimated size50 (Supplementary Note and Supplementary Table 10). Alignments of X-degenerate Y genes51 and Bos taurus Y genes to these scaffolds confirmed their association with the Y chromosome, identifying 16% and 84% of our self-hit filtered contig list, respectively, with several contigs containing both sets of alignments. Both the heterochromatic nature of the Y and the ambiguous placement of the pseudoautosomal region on the X or Y (the last portion of our X chromosome, and unplaced scaffolds 8, 12, 119 and 186) precluded generation of chromosome-scale scaffolds for the male sex chromosome.
Discussion
The advent of long-read sequencing has dramatically improved the average and N50 contig lengths of mammalian genome assemblies27,31, but complex genomic regions still interfere with the generation of complete, single-contig chromosomes31. Attempts to fill gaps in existing short-read assemblies with low-coverage long reads fail to close many gaps that could otherwise be closed with higher coverage52, as shown by the ~41,000 gaps remaining in the Oar_v4.0 assembly (accession: GCA_000298735.2) and the ~35,000 gaps in the Btau_5.0.1 assembly (accession: GCA_000003205.6). Complex genomic regions have even higher impact for genomes that are polyploid or have historical whole-genome duplications. By increasing coverage, a higher number of very long reads from the top tail of the read-length distribution are collected, which help resolve large repetitive regions. Thus, higher coverages of long reads tend to provide superior results to gap-filled short-read assemblies, as demonstrated by the few gaps remaining in ARS1. However, current long-read technologies still fall short of regularly producing completely assembled chromosomes, so reliable and affordable scaffolding technologies remain vitally important for generating high-quality finished reference genome assemblies. In this study, the utility of both optical and chromatin interaction mapping was assessed, showing that they are complementary and particularly useful in combination with long-read assemblies. A stepwise combination of these methods was employed that leveraged their unique benefits to generate a final assembly.
Optical mapping had fewer conflicts with the initial contigs and provided higher resolution, so the resulting scaffolds were easier to validate than the Hi-C scaffolds. However, optical mapping was insufficient to generate full chromosome-scale scaffolds, with one notable exception being the single scaffold spanning goat chromosome 20 (Fig. 2b). The primary limitation of the goat optical map appears to be double-strand breaks caused by neighboring nickase sites on opposite strands, which breaks the map assembly due to a lack of spanning fragments21. Optical map scaffolding generated only three confirmed assembly errors (3 / 333, or 0.9% of scaffolds), two of which were difficult to detect without the use of the RH map. Scaffolding with Hi-C was able to accurately assign contigs to their respective chromosome groups, as supported by our RH map data, 99.8% of the time; however, there were 21 confirmed order and orientation errors affecting 83 scaffolds (83 / 1,533, or 5.41%). Mis-orientation by Hi-C could be reduced with longer input contigs, having higher numbers of orienting restriction sites, or by selection of a restriction enzyme with a higher frequency of recognition sites. Contigs and scaffolds with low orientation quality scores were frequently associated with orientation mistakes in the Hi-C scaffolds (r = 0.49; Pearson’s correlation) (Supplementary Table 3), suggesting that more frequent cutting may provide higher fidelity.
Optical mapping and Hi-C scaffolding had distinct error profiles. The Hi-C method was more likely to invert smaller contigs in final scaffolds, whereas the optical mapping method was more likely to leave contig errors uncorrected due to insufficient optical map coverage. Both scaffolding methods were sensitive to the quality of the input sequence data, evident from the improvement of Hi-C scaffolding after optical scaffolding (Table 1) and the large relative improvement of our optical map scaffold NG50 compared to CHIR_1.0, which used optical mapping in combination with short-read data18. Despite these limitations, we achieved the reconstruction of 29 vertebrate autosomes into single scaffolds with a minimal number of gaps and without manual finishing (649 total gaps; 417 gaps in autosomes alone excluding the start and end of chromosome scaffolds).
Mammalian genome references have generally been produced using female animals, to improve coverage of the X chromosome, relegating assembly of the Y chromosome to separate, targeted projects53,54. Despite using a male animal, the ARS1 assembly has better continuity of X than the short-read assemblies of a female goat, and produced some Y-associated scaffolds. Hi-C scaffolding was successful at clustering sex-chromosome contigs, but was unable to scaffold the Y chromosome or segregate X and Y chromosome contigs into singular distinctive clusters. Optical mapping also encountered difficulty in generating Y chromosome scaffolds, generating 16 scaffolds that contained 50.2% of the putative Y chromosome sequence in our assembly. Much of the sequence of the Y is constitutive heterochromatin38, which makes the generation of large optical maps and Hi-C fragments difficult.
Validation of the combined PacBio, optical map, and Hi-C assembly using the RH map demonstrated that despite the tremendous improvement in continuity, there are limitations to the approach. There were 6.1% of scaffolded scaffolds, spanning 422.1 Mbp (14.4%) of the assembly, that appear to be misassembled by the two scaffolding technologies prior to application of RH map data. The most common problem (83 of 94 discrepancies among 1,553 scaffolds) was mis-orientation of contigs within scaffolds. The recommended improvements in Hi-C library preparation and optical map generation suggested here, as well as the refinement of scaffolding algorithms, could further reduce this error in future projects. Additionally, ARS1 is a haplotype-mixed representation of a diploid animal. Haplotype phasing is possible using single-molecule55 and Hi-C56 technologies, so a future aim is to generate a phased reference assembly.
The proposed assembly approach still has difficulty with constitutive heterochromatin, including most of the centromeres and telomeres, as well as large tandem repeats, such as the nucleolar organizer regions. Neither the long read contigs, optical maps, nor Hi-C interaction signals can accurately model these features for inclusion in the assembly, and they remain unresolved even in the human reference genome, which has undergone a decade of manual finishing. While assembly methods that can fully resolve heterochromatin regions are under development, they are likely to remain unresolved unless sequence read lengths increase in size to routinely span them. However, ARS1 does show a marked improvement in resolving the full structure of large repetitive elements, such as BovB retro-transposons and centromeric repeats (Fig. 4b). This increased resolution will enable future, pan-ruminant analysis of these repeat classes which may lead to further insight into the evolution of ruminant chromosome structure.
The methods presented in this study have generated chromosome-scale scaffolds, reducing the cost of genome finishing. The tiered approach to scaffold highly continuous single-molecule contigs obviated the need for expensive cytometry or BAC-walking experiments for chromosome placement. We estimate a current project cost of about $100,000 to complete a similar genome assembly, assuming current RSII sequencing and the two scaffolding platforms used here. This cost is on the order of three times greater than a short read assembly scaffolded in a similar fashion, but with a tremendous gain in continuity and quality. To achieve similar quality via manual finishing of a short-read assembly would be much higher cost. Moreover, advances in single molecule sequencing including an updated SMRT platform and alternative nanopore-based platforms, will continue to decrease this cost. As shown by the completeness of our assembly, and the improvements in gene model continuity, we expect these methods will enable the scaling of de novo genome assembly to large numbers of vertebrate species without requiring major sacrifices with respect to quality.
Online Methods
All animal work was approved by the Virginia State University Institutional Animal Care and Use Committee. Research was conducted under an IACUC approved protocol in compliance with the Animal Welfare Act, PHS Policy, and other Federal statutes and regulations relating to animals and experiments involving animals. The facility where this research was conducted is accredited by the Association for Assessment and Accreditation of Laboratory Animal Care, International and adheres to principles stated in the Guide for the Care and Use of Laboratory Animals, National Research Council, 2011.
Reference individual selection
A DNA panel composed of 96 U.S. goats from 6 breeds (35 Boer, 11 Kiko, 12 LaMancha, 15 Myotonic, 3 San Clemente, and 20 Spanish) was assembled to identify the most homozygous individual so as to minimize the number of scaffold conflicts due to heterozygous genomic regions57. Genotypes were generated using Illumina’s Caprine53K SNP beadchip processed through Genome Studio (Illumina, Inc. San Diego, CA). The degrees of homozygosity of individuals were determined by raw counts of homozygous markers on the genotyping chip (Sayre, B.L., Sonstegard, T.S., Silverstein, J., Huson, H.J., Woodward-Greene, J., et al. Proceedings of the Brazilian Society of Animal Science, Campinas, SP, BR (2013)). Individuals were ranked by their counts of homozygous markers and the individual with the highest count was selected as the reference animal. An adult male of the San Clemente goat breed with 46.02% SNP-distance homozygosity (FROH) was selected from this survey as the reference animal.
Genome sequencing, assembly, and scaffolding
Libraries for SMRT sequencing were constructed as described previously31 using DNA derived from the blood of the reference animal. We generated 465 SMRTcells using P5-C3 (311 cells), P4-C2 (142 cells), and XL-C2 (12 cells) chemistry (Pacific Biosciences). A total of 194 Gbp (69-fold) of subread bases with a mean read length of 5,110 bp were generated.
The “Celera Assembler PacBio corrected Reads” (CA PBcR) pipeline30 was used for assembly. Celera Assembler v8.2 was run with sensitive parameters specified in Berlin et. al30 which utilized the MinHash Alignment Process (MHAP) to overlap the PacBio-reads to themselves and PBDAGCON28 to generate consensus for the corrected sequences The PBcR pipeline generated 7.4 million error-corrected reads (~38 Gbp; 5.1 kb average length). The error-corrected reads were in turn assembled into 3,074 contigs having an NG50 of 3.795 Mbp with a total length of 2.63 Gbp and 30,693 degenerate contigs – contigs with fewer than 50 supporting PacBio reads — with a total length of 288.361 Mbp. Initial polishing was performed with Quiver28 using the P5-C3 data only. The degenerate contigs (representing 9.90% of the 2.914 Gbp assembled length) were excluded from scaffolding by optical maps and Hi-C and incorporated into ARS1 as unplaced contigs. Subsequent repetitive analysis revealed that 84.1% (25,821 / 30,693) of degenerate contigs were fully repetitive (greater than 75% length comprised of repeats) with 94.9% (24,500 / 25,821) of these contigs containing a portion of centromeric/telomeric satellite sequence. The remainder were likely fragments of alternative haplotypes constituting copy number variants and other structural variants.
Scaffolding of the contigs with optical mapping was performed using the Irys optical mapping technology (Bionano Genomics). DNA of sufficient quality was unavailable from the animal sequenced due to his accidental death, so we extracted DNA derived from a male child of the original animal. Purified DNA was embedded in a thin agarose layer and was labeled and counterstained following the IrysPrep Reagent Kit protocol (Bionano Genomics) as in Hastie et al.21. Samples were then loaded into IrysChips and run on the Irys imaging instrument (Bionano Genomics). A 98-fold coverage (256 Gbp) optical map of the sample was produced in two instrument runs with labeled single molecules above 100kb in size. The IrysView (Bionano Genomics) software package was used to produce single-molecule maps and de novo assemble maps into a genome map (Table 1).
Scaffolding was also performed using Hi-C based proximity guided assembly (PGA). Hi-C libraries were created from goat whole blood cells (WBC) as described58, in this case the sequenced animal was used as samples were taken prior to his death. Briefly, cells were fixed with formaldehyde, lysed, and the crosslinked DNA digested with HindIII. Sticky ends were biotinylated and proximity-ligated to form chimeric junctions, that were enriched for and then physically sheared to a size of 300–500 bp. Chimeric fragments representing the original crosslinked long-distance physical interactions were then processed into paired-end sequencing libraries and 115 million 100bp paired-end Illumina reads were produced. The paired-end reads were uniquely mapped onto the draft assembly contigs which were grouped into 31 chromosome clusters, and scaffolded using Lachesis software15 with tuned parameters (Supplementary Note).
Conflict resolution
Our tiered approach to scaffolding provides several opportunities for resolving misassemblies and contig orientation mistakes made by prior steps (for more detail, see Supplementary Note). In order to resolve all conflicts from our final assembly, we used a consensus approach that used evidence from five different sources of information: (a) our long read-based contig sequence, (b) Irys optical maps, (c) Hi-C scaffolding orientation quality scores, (d) San Clemente goat Illumina HiSeq read alignments to the contigs and (e) a previously generated RH map34 (Fig. 1b). We found that 40 contigs did not align with the Irys optical map, and there were 102 Irys conflicts that needed resolution. A large proportion of the conflicts were identified as forks in the minimum tiling path of contigs superimposed on Irys maps (e.g. Fig. 1b), but we found that 70 of these conflicts were due to ambiguous contig alignments on two or more Irys maps. Assembly forks are conflict regions in the assembly that arise when ambiguity of sequence makes it equally likely that a contig or scaffold’s sequence should continue in two (or more) distinct paths. These ambiguous alignments were due to the presence of segmental duplications or divergent, alternative haplotypes on multiple scaffolds, and were discarded. Of the original 102 conflicts, only 36 conflicts had characteristic drops in Illumina sequence read depth indicating a misassembly, and were later confirmed by the RH map to be chimeric. The PacBio + PGA assembly (prior to Irys scaffolding) had 131 scaffolds with orientation conflicts compared to the RH map. The PacBio + Irys + PGA dataset had 21 orientation conflicts (consisting of 83 scaffolds) with our RH map. After reordering conflict scaffolds using the RH map information, approximately 84.3% of these orientation conflicts (70 / 83) were filled by PBJelly, confirming that the RH map orientations for these scaffolds were correct and the PGA orientations were errors. We were unable to find any other dataset, apart from the RH map, that accurately predicted which PGA scaffolds contained orientation errors to a high degree of specificity. Since the Capra hircus X chromosome is acrocentric, our two X chromosome scaffolds do not represent distinct arms of the goat X chromosome and were likely split due to the requested number of clusters in the proximity-guided assembly algorithm. Still, our recommendation is to use the haploid chromosome count as input to Hi-C scaffolding to avoid false positive scaffold merging. We recommend the use of a suitable genetic or physical map resource, the use of larger input scaffolds into the PGA algorithm or the use of more frequent cutting restriction enzymes in the generation of Hi-C libraries in order to avoid or resolve these few remaining errors.
Assembly polishing and contaminant identification
After scaffolding and conflict resolution we ran PBJelly from PBSuite v15.8.2435 with all raw PacBio sequences to close additional gaps. PBJelly closed 681 of 1,439 gaps of at least 3 bp in length. A final round of Quiver28 was run to correct sequence in filled gaps. It removed 846 contigs with no sequence support, leaving 649 gaps larger than 3bp. Finally, as P5-C3 chemistry is higher error than either P4-C2 or P6-C4 (https://github.com/PacificBiosciences/GenomicConsensus/blob/master/doc/FAQ.rst), we generated 23X coverage of the San Clemente goat individual using 250 bp insert Illumina HiSeq libraries, as mentioned previously, for post-processing error correction and conflict resolution. We aligned reads using BWA59 (version: 0.7.10-r789) and Samtools60 (version: 1.2). Using PILON36, we closed 1 gap and identified and corrected 653,246 homozygous insertions (885,794 bp), 87,818 deletions (127,024bp), and 34,438 (34,438bp) substitutions within the assembly that were not present in the Illumina data. This matches the expected error distribution of PacBio data, which has ~5-fold more insertions than deletions61. Closer investigation of this data revealed that the majority of insertion events (52.01%) were insertions within a homopolymer run, a known bias of the PacBio chemistry [https://github.com/PacificBiosciences/GenomicConsensus/blob/master/doc/FAQ.rst]. PILON also identified 1,082,330 bases with equal-probability heterozygous substitutions, indicating potential variant sites within the genome.
The final assembly was screened for viral and bacterial contamination using Kraken v0.10.562 with a database including Viral, Archeal, Bacterial, Protozoa, Fungi, and Human. A total of 183 unplaced contigs and 1 scaffold were flagged as contaminant and removed. An additional two unplaced contigs were flagged as vector by NCBI and removed.
Assembly annotation
We employed EVidence Modeler (EVM)63 to consolidate RNA-seq, cDNA, and protein alignments with ab initio gene predictions and the CHIR_1.0 annotation into a final gene set. RNA-seq data included 6 tissues (hippocampus, hypothalamus, pituitary, pineal, testis, and thyroid) extracted from the domesticated San Clemente goat reference animal and 13 tissues pulled from NCBI SRA (Supplementary Table 11). Reads were cleaned with Trimmomatic64 and aligned to the genome with Tophat265. Alignments were then assembled independently with StringTie66, Cufflinks67 and de novo assembled with Trinity68. RNA-seq assemblies were combined and further refined using PASA63. Protein and cDNA alignments using exonerate and tblastn with Ensembl datasets of Ovis aries, Bos taurus, Equus caballus, Sus scrofa, and Homo sapiens as well as NCBI annotation of Capra hircus and Ab initio predictions by Braker169 were computed. The CHIR_1.0 annotation coordinates were translated into our coordinate system with the UCSC liftOver tool. All lines of evidence were then fed into EVM using intuitive weighting (RNAseq > cDNA/protein > ab initio gene predictions). Finally, EVM models were updated with PASA.
Gap resolution and repeat analysis
Sequence gap locations were identified from the CHIR_1.0, CHIR_2.0 and ARS1 assembly. In order to identify identical gap regions on different assemblies, we used a simple alignment heuristic (Supplementary Note). Briefly, we extracted 500 bp fragments upstream and downstream of each gap region using BEDTOOLS70 in CHIR_1.0 or CHIR_2.0 and then aligned both fragments to the assembly of comparison (eg. ARS1) using BWA MEM59. If both fragments aligned successfully within 10 kb on the same scaffold/chromosome (which was a length greater than 99.6% of all CHIR_1.0 and CHIR_2.0 gaps); the filled sequence did not map back to a repetitive section on the originating assembly; and the intervening sequence did not contain ambiguous (N) bases, the gap was considered “closed.” If fragments aligned to two separate scaffolds/chromosomes, then the region was considered a “trans-scaffold” break. In cases where one or both fragments surrounding a gap did not align, or if there were two or more ambiguous bases between aligned fragments, the gap was considered “open.” Gaps were confirmed by two methods. The first method confirmed gaps by checking Illumina WGS read alignments from the sequenced animal to the gap region using samtools depth version 1.360 with read alignment filters as follows: -a -q 30 -Q 40. If one or more bases in the filled region had a read depth less than 5, the gap was considered unresolved. The second method focused on CHIR_1.0 gaps that were filled by both CHIR_2.0 and ARS1. Briefly, the gap closure region was isolated from CHIR_2.0 and mapped to ARS1 using BWA-MEM v 0.7.1259 with default parameters. Alignments with > 14 map quality score (< 0.04% likelihood that the alignment is misplaced) to the complementary region in ARS1 indicated a consensus gap closure. Repeats were identified using the RepBase library release 2015-08-07 with RepeatMasker49 on the ARS1, CHIR_2.0, UMD3.1 (cattle)41 and Oarv3.1 (sheep; http://www.livestockgenomics.csiro.au/sheep/oar3.1.php) reference assemblies. The “quick” (-q) and “species” (e.g., -species goat, -species sheep, -species cow) options were the only deviations from the default. Repeats were filtered by custom scripts if they were less than 75% of the expected repeat length or were below 60% identity of sequence. Gap comparison images between assemblies were created using Nucmer71.
Centromeric and telomeric repeat analysis
To identify telomeric sequence we used the 6-mer vertebrate sequence (TTAGGG) and looked for all exact matches in the assembly. We also ran DUST72 with a window size of 64 and threshold of 20. Windows with at least 10 consecutive identical 6-mer matches (fwd or rev strand) intersecting with low-complexity regions of at least 1500 bp were flagged as potential telomeric sites and those with >5 kbp total length reported. To identify putative centromeric features in our assembly, we used centromeric repetitive sequence for goat from a previously published study48. Subsequent alignments of that sequence were used to flag collapsed centromeric sequence in our assembly, identifying three unplaced contigs that contained large portions of the repeat. The contigs were mapped to the assembly and regions at least 2 kbp in length reported as centromeric sites. In all but four cases the telomeric and centromeric sequences were within 100 kbp of the contig end (Supplementary Table 12). In the cluster corresponding to chromosome 1, the centromeric sequence was at position 40 Mbp, confirming a misassembly identified by the RH map. In chromosomes 12 and 13 (clusters 13 and 14, respectively) the centromere was < 3 Mbp from the end, indicating potential assemblies of the short chromosome arms, though this has not yet been experimentally confirmed.
Fosmid end sequencing and analysis
Sheared genomic DNA was end-repaired and fragments were separated by field-inversion agarose gel electrophoresis. Fragments ranging from 38–48 kb were electro-eluted, and concentrated using a Microcon-30 centrifugal concentrator. The libraries were created by cloning the DNA into the pNGS FOS vector (Lucigen, Middleton, WI) with propagation in an E. coli DH10B host. End sequence libraries were prepared using a NxSeq 40 kb Mate-pair cloning kit (Lucigen, Middleton, WI) and sequenced on a MiSeq (Illumina, San Diego, CA) using two restriction enzymes (BfaI and RsaI) to generate fosmid end libraries. Approximately 5.2 million and 5.5 million 2 × 250 bp reads were generated from the BfaI and RsaI libraries. Accounting for the expected insert size of the fosmids, the physical coverage of the clones was 40-fold for each library (80-fold total). Reads were screened for vector and bacterial host sequence. Reads were aligned to each reference assembly using BWA MEM59 with default parameters. Lumpy-SV43 was used to identify structural variations in the alignment data (Supplementary Note).
Statistical Analysis
R/Bioconductor was used for all statistical analyses. Spearman’s rank order correlation was conducted using the “cor.test” function in the base R set of utilities, with a “two.sided” alternative hypothesis. P values < 0.05 were considered statistically significant.
Supplementary Material
Acknowledgments
We thank Robert Lee for technical assistance. This project was supported by the US Agency for International Development Feed the Future program, Norman Borlaug Commemorative Research Initiative, Livestock Improvement Program. This work was also supported in part by Agriculture and Food Research Initiative (AFRI) competitive grant No. 2011-67015-30183 and 2015-67015-22970 from the USDA National Institute of Food and Agriculture (NIFA) Animal Genome Program. DMB, BR, SGS, and CPVT were supported by USDA CRIS project number: 8042-31000-104-00. CMK and TPLS were supported by USDA CRIS project number: 3040-31320-012-00. GCW was supported by USDA CRIS project number: 6402-31000-006-00D. J.Shendure was supported in part by NIH R01 grant number HG006283. MJD and IL were supported in part by NIH grant number P41 GM103533. MJD is a Senior Fellow in the Genetic Networks program at the Canadian Institute for Advanced Research and a Rita Allen Foundation Scholar. IL is supported by the UW Commercialization Gap Fund and Commercialization Fellows Program. FAPL was supported by MN Experiment Station Project MIN-16-103. JCS and JAH were funded by the United Kingdom Biotechnology and Biological Sciences Research Council Institute Strategic Program on Livestock Viral Diseases awarded to The Pirbright Institute. Mention of trade names or commercial products in this article is solely for the purpose of providing specific information and does not imply recommendation or endorsement by the US Department of Agriculture. SK and AMP were supported by the Intramural Research Program of the National Human Genome Research Institute, National Institutes of Health. This study utilized the computational resources of the Biowulf system at the National Institutes of Health, Bethesda, MD (http://biowulf.nih.gov).
Footnotes
Author Contributions
DMB, BR, SK, TSS, GEL, J.Shendure, AMP, CPVT and TPLS planned and coordinated the study and wrote the manuscript. TPLS and CMK performed the long-read sequencing and assisted with downstream analysis. SK and AMP performed the initial long-read assembly. ARH, SC, JL, and ETL performed the optical mapping and provided technical support related to the data. IL, STS, JB, MJD, and J.Shendure designed the Hi-C experiments, produced assembly scaffolds from the data and provided technical support. DMB and SK polished the final reference assembly. JAH and JCS provided manual annotation of the immune gene clusters. FAPDL provided manual annotation of the Y chromosome genes and contigs. BLS and J.Sun extracted RNA-seq biopsies and ran RNA-seq experiments, respectively. BLS, JLH, YZ, J.Sun, HJH, JCN, GCW, and AC performed downstream analysis of the data and assisted in the generation of additional files for the manuscript. All authors read and approved the final manuscript.
Data Availability
The Black Yunan Illumina data was downloaded from SRA: SRA051557. The CHIR_1.0 assembly was downloaded from NCBI accession number: GCA_000317765.1. The CHIR_2.0 assembly was downloaded from NCBI accession number: GCA_000317765.2. The PacBio reads, RNA-seq reads, Fosmid-end sequences, Illumina WGS reads, and the Hi-C library reads that were generated for this study have been deposited in Genbank under the primary BioProject accession codes PRJNA290100 (https://www.ncbi.nlm.nih.gov/bioproject/PRJNA290100/) and PRJNA340281 (https://www.ncbi.nlm.nih.gov/bioproject/340281). Optical map data that was generated for this study have been deposited in Genbank and are accessible at the following URLs: https://submit.ncbi.nlm.nih.gov/ft/byid/myXc0uq8/goat-merge.cmap and https://submit.ncbi.nlm.nih.gov/ft/byid/ueeq9b8k/rawmolecules.bnx. Intermediary assembly fasta files, accession numbers and other miscellaneous information can be found at the following link: https://gembox.cbcb.umd.edu/goat/index.html or can be made available from the corresponding authors upon request.
Code Availability
All software versions, links and command line arguments are provided in the Supplementary Note. Custom scripts and programs are currently hosted in a Github repository at the following link: https://github.com/njdbickhart/GoatAssemblyScripts .
Competing Financial Interests: TSS is a current employee of Recombinetics. IL and STS are employees of Phase Genomics. JB, JS and MJD have a vested financial interest in Phase Genomics. ARH, SC, JL, and ETL are employees of Bionano Genomics. All other authors declare no competing financial interests.
References
- 1.Matukumalli LK, et al. Development and Characterization of a High Density SNP Genotyping Assay for Cattle. PLoS ONE. 2009;4 doi: 10.1371/journal.pone.0005350. [DOI] [PMC free article] [PubMed] [Google Scholar]
- 2.Romay MC, et al. Comprehensive genotyping of the USA national maize inbred seed bank. Genome Biol. 2013;14:R55. doi: 10.1186/gb-2013-14-6-r55. [DOI] [PMC free article] [PubMed] [Google Scholar]
- 3.Tosser-Klopp G, et al. Design and Characterization of a 52K SNP Chip for Goats. PLOS ONE. 2014;9:e86227. doi: 10.1371/journal.pone.0086227. [DOI] [PMC free article] [PubMed] [Google Scholar]
- 4.Lander ES, et al. Initial sequencing and analysis of the human genome. Nature. 2001;409:860–921. doi: 10.1038/35057062. [DOI] [PubMed] [Google Scholar]
- 5.Consortium IHGS. Finishing the euchromatic sequence of the human genome. Nature. 2004;431:931–945. doi: 10.1038/nature03001. [DOI] [PubMed] [Google Scholar]
- 6.Schatz MC, Delcher AL, Salzberg SL. Assembly of large genomes using second-generation sequencing. Genome Res. 2010;20:1165–1173. doi: 10.1101/gr.101360.109. [DOI] [PMC free article] [PubMed] [Google Scholar]
- 7.Phillippy AM, Schatz MC, Pop M. Genome assembly forensics: finding the elusive mis-assembly. Genome Biol. 2008;9:R55. doi: 10.1186/gb-2008-9-3-r55. [DOI] [PMC free article] [PubMed] [Google Scholar]
- 8.Fleischmann RD, et al. Whole-genome random sequencing and assembly of Haemophilus influenzae Rd. Science. 1995;269:496–512. doi: 10.1126/science.7542800. [DOI] [PubMed] [Google Scholar]
- 9.Myers EW, et al. A whole-genome assembly of Drosophila. Science. 2000;287:2196–2204. doi: 10.1126/science.287.5461.2196. [DOI] [PubMed] [Google Scholar]
- 10.Pop M, Kosack DS, Salzberg SL. Hierarchical scaffolding with Bambus. Genome Res. 2004;14:149–159. doi: 10.1101/gr.1536204. [DOI] [PMC free article] [PubMed] [Google Scholar]
- 11.Boetzer M, Pirovano W. SSPACE-LongRead: scaffolding bacterial draft genomes using long read sequence information. BMC Bioinformatics. 2014;15:211. doi: 10.1186/1471-2105-15-211. [DOI] [PMC free article] [PubMed] [Google Scholar]
- 12.McCoy RC, et al. Illumina TruSeq synthetic long-reads empower de novo assembly and resolve complex, highly-repetitive transposable elements. PloS One. 2014;9:e106689. doi: 10.1371/journal.pone.0106689. [DOI] [PMC free article] [PubMed] [Google Scholar]
- 13.Lieberman-Aiden E, et al. Comprehensive mapping of long-range interactions reveals folding principles of the human genome. Science. 2009;326:289–293. doi: 10.1126/science.1181369. [DOI] [PMC free article] [PubMed] [Google Scholar]
- 14.Schwartz DC, et al. Ordered restriction maps of Saccharomyces cerevisiae chromosomes constructed by optical mapping. Science. 1993;262:110–114. doi: 10.1126/science.8211116. [DOI] [PubMed] [Google Scholar]
- 15.Burton JN, et al. Chromosome-scale scaffolding of de novo genome assemblies based on chromatin interactions. Nat Biotechnol. 2013;31:1119–1125. doi: 10.1038/nbt.2727. [DOI] [PMC free article] [PubMed] [Google Scholar]
- 16.Kaplan N, Dekker J. High-throughput genome scaffolding from in vivo DNA interaction frequency. Nat Biotechnol. 2013;31:1143–1147. doi: 10.1038/nbt.2768. [DOI] [PMC free article] [PubMed] [Google Scholar]
- 17.Putnam NH, et al. Chromosome-scale shotgun assembly using an in vitro method for long-range linkage. Genome Res. 2016;26:342–350. doi: 10.1101/gr.193474.115. [DOI] [PMC free article] [PubMed] [Google Scholar]
- 18.Dong Y, et al. Sequencing and automated whole-genome optical mapping of the genome of a domestic goat (Capra hircus) Nat Biotechnol. 2013;31:135–141. doi: 10.1038/nbt.2478. [DOI] [PubMed] [Google Scholar]
- 19.Nagarajan N, Read TD, Pop M. Scaffolding and validation of bacterial genome assemblies using optical restriction maps. Bioinforma Oxf Engl. 2008;24:1229–1235. doi: 10.1093/bioinformatics/btn102. [DOI] [PMC free article] [PubMed] [Google Scholar]
- 20.Dekker J, Rippe K, Dekker M, Kleckner N. Capturing chromosome conformation. Science. 2002;295:1306–1311. doi: 10.1126/science.1067799. [DOI] [PubMed] [Google Scholar]
- 21.Hastie AR, et al. Rapid genome mapping in nanochannel arrays for highly complete and accurate de novo sequence assembly of the complex Aegilops tauschii genome. PloS One. 2013;8:e55864. doi: 10.1371/journal.pone.0055864. [DOI] [PMC free article] [PubMed] [Google Scholar]
- 22.Riley MC, Kirkup BC, Johnson JD, Lesho EP, Ockenhouse CF. Rapid whole genome optical mapping of Plasmodium falciparum. Malar J. 2011;10:252. doi: 10.1186/1475-2875-10-252. [DOI] [PMC free article] [PubMed] [Google Scholar]
- 23.Zhou J, Lemos B, Dopman EB, Hartl DL. Copy-number variation: the balance between gene dosage and expression in Drosophila melanogaster. Genome Biol Evol. 2011;3:1014–1024. doi: 10.1093/gbe/evr023. [DOI] [PMC free article] [PubMed] [Google Scholar]
- 24.Zhang G, et al. Comparative genomic data of the Avian Phylogenomics Project. GigaScience. 2014;3:26. doi: 10.1186/2047-217X-3-26. [DOI] [PMC free article] [PubMed] [Google Scholar]
- 25.Chaisson MJP, Wilson RK, Eichler EE. Genetic variation and the de novo assembly of human genomes. Nat Rev Genet. 2015;16:627–640. doi: 10.1038/nrg3933. [DOI] [PMC free article] [PubMed] [Google Scholar]
- 26.Eid J, et al. Real-time DNA sequencing from single polymerase molecules. Science. 2009;323:133–138. doi: 10.1126/science.1162986. [DOI] [PubMed] [Google Scholar]
- 27.Gordon D, et al. Long-read sequence assembly of the gorilla genome. Science. 2016;352:aae0344. doi: 10.1126/science.aae0344. [DOI] [PMC free article] [PubMed] [Google Scholar]
- 28.Chin CS, et al. Nonhybrid, finished microbial genome assemblies from long-read SMRT sequencing data. Nat Methods. 2013;10:563–569. doi: 10.1038/nmeth.2474. [DOI] [PubMed] [Google Scholar]
- 29.Koren S, et al. Reducing assembly complexity of microbial genomes with single-molecule sequencing. Genome Biol. 2013;14:R101. doi: 10.1186/gb-2013-14-9-r101. [DOI] [PMC free article] [PubMed] [Google Scholar]
- 30.Berlin K, et al. Assembling large genomes with single-molecule sequencing and locality-sensitive hashing. Nat Biotechnol. 2015;33:623–630. doi: 10.1038/nbt.3238. [DOI] [PubMed] [Google Scholar]
- 31.Pendleton M, et al. Assembly and diploid architecture of an individual human genome via single-molecule technologies. Nat Methods. 2015;12:780–786. doi: 10.1038/nmeth.3454. [DOI] [PMC free article] [PubMed] [Google Scholar]
- 32.Elsik CG, Tellam RL, Worley KC. The Genome Sequence of Taurine Cattle: A Window to Ruminant Biology and Evolution. Science. 2009;324:522–528. doi: 10.1126/science.1169588. [DOI] [PMC free article] [PubMed] [Google Scholar]
- 33.Naderi S, et al. The goat domestication process inferred from large-scale mitochondrial DNA analysis of wild and domestic individuals. Proc Natl Acad Sci. 2008;105:17659–17664. doi: 10.1073/pnas.0804782105. [DOI] [PMC free article] [PubMed] [Google Scholar]
- 34.Du XY, et al. A whole-genome radiation hybrid panel for goat. Small Rumin Res. 2012;105:114–116. [Google Scholar]
- 35.English AC, et al. Mind the gap: upgrading genomes with Pacific Biosciences RS long-read sequencing technology. PloS One. 2012;7:e47768. doi: 10.1371/journal.pone.0047768. [DOI] [PMC free article] [PubMed] [Google Scholar]
- 36.Walker BJ, et al. Pilon: An Integrated Tool for Comprehensive Microbial Variant Detection and Genome Assembly Improvement. PLoS ONE. 2014;9 doi: 10.1371/journal.pone.0112963. [DOI] [PMC free article] [PubMed] [Google Scholar]
- 37.Garrison E, Marth G. Haplotype-based variant detection from short-read sequencing. ArXiv12073907 Q-Bio. 2012 [Google Scholar]
- 38.Iannuzzi L, Di Meo GP. Chromosomal evolution in bovids: a comparison of cattle, sheep and goat G- and R-banded chromosomes and cytogenetic divergences among cattle, goat and river buffalo sex chromosomes. Chromosome Res Int J Mol Supramol Evol Asp Chromosome Biol. 1995;3:291–299. doi: 10.1007/BF00713067. [DOI] [PubMed] [Google Scholar]
- 39.Schneider VA, et al. Evaluation of GRCh38 and de novo haploid genome assemblies demonstrates the enduring quality of the reference assembly. bioRxiv. 2016;72116 doi: 10.1101/072116. [DOI] [PMC free article] [PubMed] [Google Scholar]
- 40.Ma W, et al. Fine-scale chromatin interaction maps reveal the cis-regulatory landscape of human lincRNA genes. Nat Methods. 2015;12:71–78. doi: 10.1038/nmeth.3205. [DOI] [PMC free article] [PubMed] [Google Scholar]
- 41.Zimin AV, et al. A whole-genome assembly of the domestic cow, Bos taurus. Genome Biol. 2009;10:R42. doi: 10.1186/gb-2009-10-4-r42. [DOI] [PMC free article] [PubMed] [Google Scholar]
- 42.Ewing B, Green P. Base-calling of automated sequencer traces using phred. II. Error probabilities. Genome Res. 1998;8:186–194. [PubMed] [Google Scholar]
- 43.Layer RM, Chiang C, Quinlan AR, Hall IM. LUMPY: a probabilistic framework for structural variant discovery. Genome Biol. 2014;15:R84. doi: 10.1186/gb-2014-15-6-r84. [DOI] [PMC free article] [PubMed] [Google Scholar]
- 44.Vezzi F, Narzisi G, Mishra B. Reevaluating Assembly Evaluations with Feature Response Curves: GAGE and Assemblathons. PLOS ONE. 2012;7:e52210. doi: 10.1371/journal.pone.0052210. [DOI] [PMC free article] [PubMed] [Google Scholar]
- 45.Simão FA, Waterhouse RM, Ioannidis P, Kriventseva EV, Zdobnov EM. BUSCO: assessing genome assembly and annotation completeness with single-copy orthologs. Bioinformatics. 2015;31:3210–3212. doi: 10.1093/bioinformatics/btv351. [DOI] [PubMed] [Google Scholar]
- 46.Sanderson ND, et al. Definition of the cattle killer cell Ig-like receptor gene family: comparison with aurochs and human counterparts. J Immunol Baltim Md 1950. 2014;193:6016–6030. doi: 10.4049/jimmunol.1401980. [DOI] [PMC free article] [PubMed] [Google Scholar]
- 47.International Sheep Genomics Consortium et al. The sheep genome reference sequence: a work in progress. Anim Genet. 2010;41:449–453. doi: 10.1111/j.1365-2052.2010.02100.x. [DOI] [PubMed] [Google Scholar]
- 48.Melters DP, et al. Comparative analysis of tandem repeats from hundreds of species reveals unique insights into centromere evolution. Genome Biol. 2013;14:R10. doi: 10.1186/gb-2013-14-1-r10. [DOI] [PMC free article] [PubMed] [Google Scholar]
- 49.Smit AF, Hubley R, Green P. RepeatMasker Open-3.0. 1996 [Google Scholar]
- 50.Hansen KM. Q-band karyotype of the goat (Capra hircus) and the relation between goat and bovine Q-bands. Hereditas. 1973;75:119–129. doi: 10.1111/j.1601-5223.1973.tb01148.x. [DOI] [PubMed] [Google Scholar]
- 51.Pérez-Pardal L, et al. Multiple paternal origins of domestic cattle revealed by Y-specific interspersed multilocus microsatellites. Heredity. 2010;105:511–519. doi: 10.1038/hdy.2010.30. [DOI] [PubMed] [Google Scholar]
- 52.Koren S, et al. Hybrid error correction and de novo assembly of single-molecule sequencing reads. Nat Biotechnol. 2012;30:693–700. doi: 10.1038/nbt.2280. [DOI] [PMC free article] [PubMed] [Google Scholar]
- 53.Vanneste K, Baele G, Maere S, de Peer YV. Analysis of 41 plant genomes supports a wave of successful genome duplications in association with the Cretaceous–Paleogene boundary. Genome Res. 2014;24:1334–1347. doi: 10.1101/gr.168997.113. [DOI] [PMC free article] [PubMed] [Google Scholar]
- 54.Tomaszkiewicz M, et al. A time- and cost-effective strategy to sequence mammalian Y Chromosomes: an application to the de novo assembly of gorilla Y. Genome Res. 2016 doi: 10.1101/gr.199448.115. [DOI] [PMC free article] [PubMed] [Google Scholar]
- 55.Chin CS, et al. Phased Diploid Genome Assembly with Single Molecule Real-Time Sequencing. bioRxiv. 2016:56887. doi: 10.1101/056887. [DOI] [PMC free article] [PubMed] [Google Scholar]
- 56.Selvaraj S, Dixon RJ, Bansal V, Ren B. Whole-genome haplotype reconstruction using proximity-ligation and shotgun sequencing. Nat Biotechnol. 2013;31:1111–1118. doi: 10.1038/nbt.2728. [DOI] [PMC free article] [PubMed] [Google Scholar]
- 57.Barrière A, et al. Detecting heterozygosity in shotgun genome assemblies: Lessons from obligately outcrossing nematodes. Genome Res. 2009;19:470–480. doi: 10.1101/gr.081851.108. [DOI] [PMC free article] [PubMed] [Google Scholar]
- 58.Burton JN, Liachko I, Dunham MJ, Shendure J. Species-Level Deconvolution of Metagenome Assemblies with Hi-C–Based Contact Probability Maps. G3 GenesGenomesGenetics. 2014;4:1339–1346. doi: 10.1534/g3.114.011825. [DOI] [PMC free article] [PubMed] [Google Scholar]
- 59.Li H, Durbin R. Fast and accurate short read alignment with Burrows-Wheeler transform. Bioinforma Oxf Engl. 2009;25:1754–1760. doi: 10.1093/bioinformatics/btp324. [DOI] [PMC free article] [PubMed] [Google Scholar]
- 60.Li H, et al. The Sequence Alignment/Map format and SAMtools. Bioinforma Oxf Engl. 2009;25:2078–2079. doi: 10.1093/bioinformatics/btp352. [DOI] [PMC free article] [PubMed] [Google Scholar]
- 61.Ross MG, et al. Characterizing and measuring bias in sequence data. Genome Biol. 2013;14:R51. doi: 10.1186/gb-2013-14-5-r51. [DOI] [PMC free article] [PubMed] [Google Scholar]
- 62.Wood DE, Salzberg SL. Kraken: ultrafast metagenomic sequence classification using exact alignments. Genome Biol. 2014;15:R46. doi: 10.1186/gb-2014-15-3-r46. [DOI] [PMC free article] [PubMed] [Google Scholar]
- 63.Haas BJ, et al. Automated eukaryotic gene structure annotation using EVidenceModeler and the Program to Assemble Spliced Alignments. Genome Biol. 2008;9:R7. doi: 10.1186/gb-2008-9-1-r7. [DOI] [PMC free article] [PubMed] [Google Scholar]
- 64.Bolger AM, Lohse M, Usadel B. Trimmomatic: a flexible trimmer for Illumina sequence data. Bioinformatics. 2014;30:2114–2120. doi: 10.1093/bioinformatics/btu170. [DOI] [PMC free article] [PubMed] [Google Scholar]
- 65.Kim D, et al. TopHat2: accurate alignment of transcriptomes in the presence of insertions, deletions and gene fusions. Genome Biol. 2013;14:R36. doi: 10.1186/gb-2013-14-4-r36. [DOI] [PMC free article] [PubMed] [Google Scholar]
- 66.Pertea M, et al. StringTie enables improved reconstruction of a transcriptome from RNA-seq reads. Nat Biotechnol. 2015;33:290–295. doi: 10.1038/nbt.3122. [DOI] [PMC free article] [PubMed] [Google Scholar]
- 67.Trapnell C, et al. Transcript assembly and quantification by RNA-Seq reveals unannotated transcripts and isoform switching during cell differentiation. Nat Biotechnol. 2010;28:511–515. doi: 10.1038/nbt.1621. [DOI] [PMC free article] [PubMed] [Google Scholar]
- 68.Grabherr MG, et al. Trinity: reconstructing a full-length transcriptome without a genome from RNA-Seq data. Nat Biotechnol. 2011;29:644–652. doi: 10.1038/nbt.1883. [DOI] [PMC free article] [PubMed] [Google Scholar]
- 69.Hoff KJ, Lange S, Lomsadze A, Borodovsky M, Stanke M. BRAKER1: Unsupervised RNA-Seq-Based Genome Annotation with GeneMark-ET and AUGUSTUS. Bioinformatics. 2016;32:767–769. doi: 10.1093/bioinformatics/btv661. [DOI] [PMC free article] [PubMed] [Google Scholar]
- 70.Quinlan AR, Hall IM. BEDTools: a flexible suite of utilities for comparing genomic features. Bioinforma Oxf Engl. 2010;26:841–842. doi: 10.1093/bioinformatics/btq033. [DOI] [PMC free article] [PubMed] [Google Scholar]
- 71.Kurtz S, et al. Versatile and open software for comparing large genomes. Genome Biol. 2004;5:R12. doi: 10.1186/gb-2004-5-2-r12. [DOI] [PMC free article] [PubMed] [Google Scholar]
- 72.Morgulis A, Gertz EM, Schäffer AA, Agarwala R. A fast and symmetric DUST implementation to mask low-complexity DNA sequences. J Comput Biol J Comput Mol Cell Biol. 2006;13:1028–1040. doi: 10.1089/cmb.2006.13.1028. [DOI] [PubMed] [Google Scholar]
Associated Data
This section collects any data citations, data availability statements, or supplementary materials included in this article.