

Abstract
Stopping incipient action activates both the right inferior frontal cortex (rIFC) and the anterior insula (rAI). Controversy has arisen as to whether these comprise a unitary cortical cluster—the rIFC/rAI—or whether rIFC is the primary stopping locus. To address this, we recorded directly from these structures while taking advantage of the high spatiotemporal resolution of closely spaced stereo‐electro‐encephalographic (SEEG) electrodes. We studied 12 patients performing a stop‐signal task. On each trial they initiated a motor response (Go) and tried to stop to an occasional stop signal. Both the rIFC and rAI exhibited an increase in broadband gamma activity (BGA) after the stop signal and within the time of stopping (stop signal reaction time, SSRT), regardless of the success of stopping. The proportion of electrodes with this response was significantly greater in the rIFC than the rAI. Also, the rIFC response preceded that in the rAI. Last, while the BGA increase in rIFC occurred mainly prior to SSRT, the rAI showed a sustained increase in the beta and low gamma bands after the SSRT. In summary, the rIFC was activated soon after the stop signal, prior to and more robustly than the rAI, which on the other hand, showed a more prolonged response after the onset of stopping. Our results are most compatible with the notion that the rIFC is involved in triggering outright stopping in concert with a wider network, while the rAI is likely engaged by other processes, such as arousal, saliency, or behavioral adjustments. Hum Brain Mapp 39:189–203, 2018. © 2017 Wiley Periodicals, Inc.
Keywords: electrocorticography, frontal lobe, humans, inhibition (psychology)
INTRODUCTION
Many studies of rapidly stopping action, using various methodologies, have consistently implicated the right inferior frontal cortex (rIFC), especially the pars opercularis (as recently reviewed by Aron et al. [2016], Bari and Robbins [2013], Jahanshahi et al. [2015], and Wiecki and Frank [2013]). Whereas some researchers have argued that the rIFC is a crucial node within a wider network for inhibitory control that includes the pre‐supplementary motor area (pre‐SMA), basal ganglia, and M1 [Aron et al., 2014, 2015; Bari and Robbins, 2013; Chambers et al., 2009], others have argued that rIFC is merely one out an ensemble of different right prefrontal regions, also including the anterior insula, which all implement inhibitory control [Erika‐Florence et al., 2014; Hampshire, 2015; Hampshire and Sharp, 2015b]. Indeed, fMRI studies do show functional activation of both rIFC and rAI related to stopping [Aron and Poldrack, 2006; Boehler et al., 2010; Cai et al., 2016; Chikazoe et al., 2009; Rae et al., 2014; Ramautar et al., 2006; Swick et al., 2011]. However, a recent meta‐analysis of fMRI profiles of rIFC and rAI during stopping [Cai et al., 2014] has revealed distinct functional connectivity of these two regions: the rIFC is more connected to the dorsomedial PFC (such as preSMA) while the rAI is more connected to the anterior cingulate. The study also showed that rAI was more activated during unsuccessful stopping than was rIFC. While these findings challenge the idea of a unitary fronto‐insula cluster [Erika‐Florence et al., 2014; Hampshire, 2015; Hampshire and Sharp, 2015b] better temporal information about rIFC vs rAI is needed to elucidate their activation profiles. For example, if activation in the rAI occurrs before rIFC, and both are activated before the stop signal reaction time (SSRT), this would be compatible with a function for rAI in detecting/processing the stop signal and relaying it to rIFC; alternatively, if rIFC is activated before SSRT and rAI (later), especially after SSRT, then this may suggest that rAI is not involved in outright stopping at all, but instead in registering arousal effects, saliency, or behavioral consequences [Bastin et al., 2016].
To resolve this issue, we used intracranial EEG (stereo‐electro‐encephalographic, SEEG, recordings with depth electrodes) which provides high spatio‐temporal resolution and records from both superficial as well as deep parts of the brain. This allowed us to systematically record from the rAI, which is located deep in the cerebrum, and is not accessible by subdural grid electrodes. Only one prior intracranial study has recorded from rAI during a stop signal task [Bastin et al., 2016], but it did not examine the relative roles of rIFC and rAI. We performed these recordings in 12 patients participating in a stop‐signal task. Critically, each patient had at least one recording electrode in both rIFC and rAI. We focused our analysis mainly on broadband gamma activity (BGA, 50–150 Hz) as this robustly covaries with behavioral measures [Darvas et al., 2010; Gaona et al., 2011; Maris et al., 2011; Ray et al., 2008; Tort et al., 2008; Wang, 2010]. It also indexes local cortical activation [Cardin et al., 2009], strongly correlates with the BOLD signal [Engell et al., 2012; Logothetis et al., 2001; Mukamel et al., 2005], and has the temporal resolution necessary to assess the chronology of the rapid succession of events that occur during stopping.
On each trial, the patient was presented with a Go signal, which required a button press with the right index finger. On a minority of these trials, a subsequent stop signal was presented, instructing the patient to stop. We estimated the speed of stopping (SSRT) in each patient [Logan and Cowan, 1984; Verbruggen and Logan, 2009]. We then analyzed BGA in both the rIFC and rAI, time‐locked to the stop signal, up to the SSRT and beyond, for both successful and failed stop trials.
METHODS
Participants
Sixteen patients undergoing placement of depth electrodes as part of a stereo‐electroencephalographic (SEEG) recording for medically refractory epilepsy were enrolled. The participants met the following inclusion criteria: age > 18 years, IQ > 75, no overt brain structural abnormalities, seizure‐free for at least 2 h before and after the experimental session and at least one electrode placed in the rAI and one in the rIFC (as defined in the Regions of interest definition section below). All experimental procedures were reviewed and approved by the Committee for the Protection of Human Subjects (CPHS) of the University of Texas Houston Medical School (IRB #HSC‐MS‐06–0385), and written informed consent was obtained from all participants. Handedness was assessed using the Edinburgh Inventory [Oldfield, 1971]. 11 participants were right handed and 1 was left handed (patient 8, for whom right hemispheric dominance for language was confirmed with the Wada Test). Data from 4 participants were subsequently discarded: two because behavioral performance did not meet criteria (one had a very low success in stopping ≈ 30%, while the other made too many errors on go trials, 20%), and two patients were found to have seizures or prominent interictal activity originating in the insula or IFC. Thus, the study analyzed data from 12 participants (4 females, mean age and standard deviation 29 ± 9 years) with good behavioral data and no seizures detected in the two regions of interest. All brain regions were sampled solely by clinical needs and so these varied across participants (4 right hemispheric and 8 bilateral implants).
Electrode Localization
Preimplantation anatomical MRI scans were collected using a 3 T whole‐body MR scanner (Philips Medical Systems, Bothell WA) and were co‐registered with a postimplantation CT scan using AFNI software [Cox, 1996]. Stereotactic electrodes were manually localized using the center of their artifact visible on the CT scan. Cortical surface models were reconstructed using FreeSurfer software (v5.1) and imported to SUMA for visualization [Fischl, 2012]. Spheroids were generated to model each electrode location on an individualized cortical surface model [Pieters et al., 2013].
Regions of Interest Definition
The rAI was defined as comprising the short gyri of the insula, the anterior circular sulcus and the superior circular sulcus. The rIFC was defined as comprising the pars opercularis, pars triangularis, the horizontal ramus of the lateral fissure, and the vertical ramus of the lateral fissure (Fig. 1). For each participant, all electrodes were localized within each ROI in native anatomical space, with cortical gyral and sulcal boundaries defined using automated parcellation labels (2005 Destrieux cortical atlas) [Destrieux et al., 2010; Fischl et al., 2004], implemented in FreeSurfer software [Fischl, 2012]. Additionally, all electrode localizations were verified by an expert in human neuroanatomy (NT). Electrodes not clearly localizable to one or the other ROI were excluded (9 electrodes). A total of 59 electrodes were localized to the rAI and 41 to the rIFC, with at least one electrode (i.e., one electrode contact) per ROI in each participant. To enable a topologically accurate population‐level representation of electrode localizations (Fig. 2; Panel a), individual subject electrodes were mapped to a standardized cortical surface (MNI N27 template brain, aligned to Talairach coordinate space), using a surface‐based normalization strategy [Kadipasaoglu et al., 2014, 2016; Saad et al., 2004].
Figure 1.

Regions of interest (ROIs). Right inferior frontal cortex (rIFC)—blue colors—and the right anterior insula (rAI)—magenta colors—as identified by the Destrieux atlas. The ROIs are shown on the same standard brain from different views: lateral, axial and coronal MRI, semi‐transparent brain surface, and inflated surface. POp = Pars Opercularis; vLF = vertical ramus of the lateral fissure; PTr = Pars Triangularis; hLF = horizontal ramus of the lateral fissure; sCS = superior part of the insular circular sulcus; aCS = anterior part of the insular circular sulcus; sIG = short insular gyri. [Color figure can be viewed at http://wileyonlinelibrary.com]
Figure 2.

Stop‐signal paradigm recruits both the rIFC and the rAI during the stop process. (Panel a) The electrodes in rIFC and rAI used for all analyses—shown in standard space. (Panel b) Task. Each trial starts with a fixation cross, followed by an arrow pointing either to the left or to the right (Go cue). On stop trials, a tone occurs at a variable delay after the Go cue signaling the need to stop the initiated response (Stop Signal). The stop signal reaction time (SSRT) represents the average duration of the stopping process. Four time windows of interest are highlighted, prestimulus baseline (B: baseline‐fixation cross); initiation of the response (T1: from Go cue to stop signal); the stopping process (T2: from stop signal to SSRT); and the behavioral outcome (T3: from SSRT to 500 ms later). (Panel c) Example of time‐frequency power plots for one electrode (time on the x‐axis, frequency on the y‐axis, color‐coded according to percent signal change). The mean power change (% from baseline) is calculated across stop trials (left) and go trials (right) separately. The dashed rectangles in each plot show the T2 window (from SS = stop signal or E(SS) = expected stop signal for go trials to SSRT) and the broadband gamma power values (from 50 to 150 Hz) that are used to compute the contrast between stop and go trials (shown in Panel d). (Panel d) Difference between stop and go trials in the T2 time window using broadband gamma power signal change with respect to baseline. The map shows the results of the mixed effects model contrasting BGA values during stop trials vs go trials (difference in percent signal change for stop vs go) masked by ROI and by statistical significance (P < 0.05). Both ROIs show an increase in BGA for stopping trials with respect to go trials, replicating previous fMRI findings using BOLD signal, and both regions show an increase of broadband gamma (with respect to baseline) in the T2 window. [Color figure can be viewed at http://wileyonlinelibrary.com]
Task and Procedure
Participants performed a simple stop signal paradigm implemented using Psychtoolbox [Brainard, 1997] running in Matlab® (version 2014). For each trial, there was a go cue (an arrow that pointed either left or right, 1,500 ms duration) and the participant was instructed to press the corresponding button on a laptop keyboard (with the right hand). On 33% of trials, a stop signal (a tone with 900 Hz frequency of 250 ms duration) was presented at a variable delay from the onset of the go cue (stop signal delay, SSD) and participants attempted to stop the button press response. A fixation cross was presented during the intertrial interval, which had a variable duration (lasting 3,000 ms minus the reaction time when there was a button press; 1,500 ms when no button was pressed).
Each participant participated in two experimental sessions. The first session included 20 trials to familiarize him/her with the task. These data were not analyzed. The second session consisted of 5 blocks of 60 trials each, with the stop signal being presented on one third of the trials (200 go‐trials and 100 stop‐trials). The SSD (delay between the go cue and the stop signal in stop‐trials) was initially set at 200 ms and varied using an adaptive‐algorithm driven by subject performance: it increased by 50 ms with each successful stop and decreased by 50 ms for a failed stop. This led to ∼50% probability of stopping (around 50 trials of successful stops and 50 of failed stops per subject), an optimal proportion for computing SSRT. The SSD was adapted independently for the left and right button press responses.
Experiments were run using a MacBookPro (OSX 10.8.5, Apple Inc., Cupertino CA) positioned at eye level. A TTL pulse generated by the computer was used to mark trial onset in the SEEG recordings. The SEEG signals were recorded from the implanted intracranial electrodes (2 KHz sampling rate, bandwidth 0.3–500 Hz; cylindrical electrodes with 0.8 mm diameter and 2.5 mm length) using a BlackRock NeuroPort NSP system (Blackrock Microsystems, Salt Lake City, UT). The ground and reference electrodes were placed in white matter. After each block of 60 trials, feedback was provided about performance (median RT and error/miss count on go trials).
Intracranial Data Processing
EEG data were imported into Matlab®, visually inspected for line noise, artifacts, and epileptic activity and electrodes with >10 dB of noise in the 60 Hz band or localized to sites of seizure onset were excluded. Trials contaminated by interictal epileptic spikes were discarded (even if present in a single electrode). Each electrode was rereferenced offline to the average of a set of white‐matter electrodes (electrodes at least 4 mm away from grey matter in any direction). For each trial, recordings were segmented into a 1,500 ms window around the event of interest (−500 before and 1,000 after the stop signal for stop trials; expected SSD was used in go trials, i.e., the SSD that would have been used on that trial according to the adaptive algorithm for SSD selection). The epoch just prior to the go cue was used as baseline (B: from 250 to 1,250 ms before the go cue). To avoid edge effects due to filtering, 1 s of recording before/after each window of interest (for trial and baseline) was maintained for band‐power calculations and removed thereafter. Each trial was band‐pass filtered (IIR Elliptical filter, 30 dB sidelobe attenuation) using a filter‐bank (100 frequency bands, central frequency increasing logarithmically from 4 to 180 Hz, band width increasing from 1 Hz at lower frequencies to 15 Hz at higher frequencies) and a Hilbert transform was applied to compute the analytic signal to derive the power in each frequency band.
For each stop trial, four time‐windows of interest were identified and labeled (Fig. 2, panel b): #1 was the prestimulus baseline (B: baseline‐fixation cross from −250 to −1250 ms before the go cue); #2 was related to response initiation (T1: from Go cue to stop signal); #3 was related to the stopping process (T2: from stop signal to SSRT); and #4 was related to the behavioral outcome (T3: from SSRT to 500 ms later). For each go trial, we identified the same four windows (for T1 and T2, we used the expected SSD on that trial; i.e., the SSD that would have been used on that trial according to the adaptive algorithm for SSD selection). We defined the time windows in relation to these events given that the timing of the stop signal presentation changed on a trial‐by‐trial basis and that the SSRT was different for each participant. In the following sections, we refer to these labels (B, T1, T2, and T3) to indicate the time window used for each analysis.
Analysis 1: Cortical Surface Mapping of Grouped Activation for Stop versus Go Trials
First, we evaluated the presence of a response in the rAI and rIFC during the unfolding of the stopping process. This analysis of the time window between stop signal presentation and SSRT (i.e., T2; Fig. 2, Panel c) would be expected to mirror fMRI studies showing the recruitment of these two regions during stop‐signal paradigms. Broadband gamma activity (BGA, 50–150 Hz) in the T2 time‐window was averaged and expressed as a percent change from baseline (i.e., B: −250 to −1,250 ms before go cue). To perform this analysis, we applied surface based mixed effects multilevel analysis. This approach was first developed to correct for incomplete data samples and for outliers in fMRI data [Chen et al., 2012]. With SEEG data, there are multiple electrode contacts per subject, and different subjects have different numbers of electrodes in different spaces. We first represent the recording zones of all of these electrodes in a common reference space, to which each individual's anatomy is normalized. The activity at all these electrodes in a common space can then be analyzed using a general linear model at each “recording zone” (even though some subjects will contribute no contacts to a particular zone). The general linear model, as for fMRI, includes the stop trial regressor, and the go trial regressor. A parameter estimate and a measure of variability are generated for each subject, and these are then analyzed at a second level (group of subjects). See for details: [Chen et al., 2012; Kadipasaoglu et al., 2014; Whaley et al., 2016]. The results from this analysis were masked by ROI (rIFC or rAI) and by significance (P < 0.05).
Analysis 2: Response Profile of rAI and rIFC Electrodes Before and After the SSRT
Next, we evaluated the within‐trial response profile of electrodes in each of the two ROIs. The two regions were expected to exhibit different patterns of recruitment over time (i.e., over the time windows), reflecting potentially different functional roles. BGA values for each trial were averaged within each time window separately (T1, T2, and T3). The aim was to classify the response profile at each electrode and evaluate the changes over time. For each electrode, we performed three Mann–Whitney U tests on BGA (one for each time window: T1, T2, and T3): successful stop trials against their baseline, failed trials against their baseline, successful stop trials against failed stop trials. The results of the test (P < 0.01, corrected for FDR according to the number of electrodes tested) were used to classify response profiles into one out of four classes: not‐active, stop‐responsive, failed‐preference and success‐preference. Not‐active electrodes did not show any difference from baseline, for either successful or failed stop trials. Stop‐responsive electrodes showed an increase from baseline, but a nonsignificant difference between failed and successful stop trials. Failed‐preference electrodes showed an increase in BGA values for failed stop trials versus successful stop trials. The opposite was true for success‐preference electrodes. To test if the pattern of recruitment was different depending on the ROI, we performed a multinomial mixed‐effects regression using the electrode classification (not active, stop‐responsive, failed‐preference) as the dependent variable (note: success‐preference was not included in the analysis due to insufficient representation in the data). ROI (rIFC and rAI) and time window (T2 and T3) were included as fixed effects and subjects and electrodes as random effects. We implemented the analysis via Markov chain Monte Carlo methods using the brms package interfacing R and Stan [Bürkner, 2016; R Core Team, 2016; Brooks et al., 2011] (see Supporting Information for details). We adopted a Bayesian approach to be able to overcome convergence issues affecting maximum likelihood estimates in the presence of separation, as in our data [i.e., which happens when a level of predictor is associated with only one outcome: in our case, there are no occurrences of Failed Preference responses in T2; Albert and Anderson, 1984; Allison, 2008]. In Table 1, we report the odds ratios and their 95% credible interval. We refer to odds ratios (of being classified as stop‐responsive vs non‐active or failed‐preference vs non‐active) as “not different” when the 95% credible interval includes 1.
Table 1.
Electrode classification: odds‐ratio and credible interval
| Stop‐responsive vs non‐active | Failed preference vs non‐active | ||||||
|---|---|---|---|---|---|---|---|
| OR | 95% CI lower | 95% CI upper | OR | 95% CI lower | 95% CI upper | ||
| T2 | rAI vs rIFC | 0.08* | 0.01 | 0.35 | 4.70 × 10⁻³ | 3.18 × 10⁻⁷ | 36.2 |
| T3 | rAI vs rIFC | 2.03 | 0.34 | 14.01 | 0.22 | 1.70 × 10⁻³ | 18.73 |
| rIFC | T3 vs T2 | 0.54 | 0.12 | 2.44 | 5.58 × 10⁸* | 2.77 × 10⁴ | 4.33 × 10¹³ |
| rAI | T3 vs T2 | 13.46* | 3.03 | 96.54 | 1.25 × 10⁹* | 8.50 × 10⁴ | 8.06 × 10¹³ |
Table showing the odds‐ratios (OR) and the 95% credible interval (CI, lower and upper bounds) derived from the coefficient of the multinomial model (see Supporting Information for more details). An asterisk is used to flag a reliable change (OR not including 1 in the 95% CI). The first two columns show the comparisons performed to compute the OR (T2: between SS and SSRT; T3: after SSRT). The left side of the table is relative to stop‐responsive vs not‐active, the right side to failed‐preference vs not‐active. For example, the first row shows the OR of an electrode being classified as stop‐responsive vs not‐active in the rAI vs the rIFC (right side: T2 rAI vs rIFC), which is lower than 1: i.e. there are lower odds of an electrode being classified as stop‐responsive in the insula with respect to the rIFC between the SS and the SSRT. Note that the OR are highly variable for failed‐preference vs not‐active, due to no electrodes being classified as failed‐preference in the T2 time‐window. These ORs should be interpreted only with respect to their direction given this limitation.
Analysis 3: Testing Timing Differences for rIFG Versus rAI
We tested whether there was a difference in the timing of the recruitment of the two ROIs. We exploited the high signal‐to‐noise ratio of these data by examining single‐trial BGA values. For each participant, we computed the time of onset of the BGA for stop trials at a single trial level, and we then calculated the onset time difference for each pair of rIFG‐rAI electrodes in that subject.
To compute the onset of the BGA power at a given electrode, single trial raw power was averaged within the 50–150 Hz frequency band. We then adapted a previously published method to our data [Foster et al., 2015; Foster and Parvizi, 2012]. For each trial, we selected the first time point exceeding a threshold (the 95th percentile of BGA power values for at least 20 consecutive milliseconds in a window between 0 and 1,000 ms from the stop signal). After that, a 300 ms wide window was built around that time point (200 ms before and 100 after). This window was segmented into 20 ms bins with 50% overlap and a linear regression was fitted to each bin (with time as the independent variable and BGA power values as the dependent one). The first time‐point of the bin with the highest slope and smallest residual error was defined as the onset of the BGA power peak (following the method described by Foster et al.: the slopes were ranked in ascending order and the one with the smallest residual error among the highest five was selected). All possible pairs of rIFC and rAI electrodes within each subject were used to compute the onset difference at each individual trial level (i.e., rIFC onset time on trial t minus rAI onset time on trial t). The median onset difference was then obtained across all trials for each electrode pair. We then tested if the median onset difference was different from zero considering all electrode pairs (n = 206) with a Mann–Whitney U test.
To validate the reliability of the onset measures, we also used two alternative approaches to compute the onset time of BGA. The first order derivative of the BGA power time series was computed and the median point between the maximum (corresponding to the highest rate of power increase over time) and the neighboring zero‐crossing (corresponding to the preceding local minimum) was used as an alternative onset measure (correlation of onset values with the first method: r = 0.93, t(204) = 37.7, P < 0.001). Lastly, we calculated optimal lag for the cross‐correlation of power time series between electrode pairs (correlation with the first measure: r = 0.73, t(204) = 15.39, P < 0.001). Given the agreement between the onset values computed using all three methods, in the results section we focus mainly on the outcome of the analysis performed using the first method, and only briefly discuss the latter methods.
Analysis 4: Full Frequency‐Range Contrast for the Two ROIs
While the main objective of our study was to assess timing differences in recruitment of rIFC and rAI, for which we needed high‐frequency gamma estimates, we also show the wider event‐related spectral perturbation. Accordingly, we derived power values (expressed as percent change from baseline) from the whole frequency range (from 4 to 180 Hz) in the 1,000 ms window after SSD. Successful and failed stop trials were averaged separately for each ROI and each subject. The time‐frequency maps (2 for each subject: one for rAI and one for rIFC) were contrasted between rAI and rIFC using permutation testing (2,000 permutations shuffling ROI labels, using subjects as a pairing variable). The results were corrected for the number of time‐frequency points examined by means of FDR correction with an alpha level of 0.05. An auxiliary analysis did the same thing, but time‐locked to the SSRT for each subject instead of the SSD on each stop trial.
RESULTS
Behavior
Behavioral performance was quite exemplary. Mean RT on go trials was 620 ± 121 ms (mean ± standard deviation), while on failed trials it was 524 ± 83 ms, and this difference was present in 11 out of 12 participants, consistent with the race model of stopping [Logan and Cowan, 1984]. Errors on go trials and misses were rare, occurring on 2% of go trials. The stop signal reaction time (SSRT), estimated using the mean method [Verbruggen and Logan, 2009], and indicative of the length of the stopping process, was 251 ms, with the probability of stopping being 49% on average (ranging between 42% and 60%, Table 2). An auxiliary analysis looked at the after‐effects of stopping by comparing reaction times on go trials after a failed stop versus after a go trial. The mean RT after a failed stop was significantly longer than after a go trial (689 ± 129 ms as opposed to 574 ± 116 ms, t(11) = 5.82, P < 0.01).
Table 2.
Behavioral performance
| Patient n | goRT | failedRT | SSRT | SSD | Num errors | p inhibit (%) |
|---|---|---|---|---|---|---|
| 1 | 547 | 451 | 352 | 195 | 4 | 44 |
| 2 | 891 | 712 | 252 | 640 | 0 | 60 |
| 3 | 503 | 451 | 221 | 282 | 7 | 49 |
| 4 | 689 | 589 | 270 | 419 | 0 | 42 |
| 5 | 655 | 562 | 194 | 460 | 0 | 48 |
| 6 | 520 | 464 | 180 | 340 | 1 | 45 |
| 7 | 598 | 507 | 173 | 424 | 1 | 43 |
| 8 | 618 | 519 | 241 | 378 | 1 | 48 |
| 9 | 653 | 479 | 336 | 316 | 2 | 55 |
| 10 | 637 | 525 | 226 | 411 | 0 | 55 |
| 11 | 716 | 608 | 304 | 412 | 0 | 52 |
| 12 | 414 | 423 | 263 | 150 | 9 | 49 |
| Mean | 620 | 524 | 251 | 369 | 2.1 | 49 |
| sd | 121 | 83 | 58 | 128 | 3.0 | 5 |
The table shows for each participant (patient n) the average reaction time of go trials (goRT) failed stop trials (failedRT), the stop signal reaction time (SSRT), and the median stop signal delay (SSD) expressed in milliseconds. The number of errors on go trials is displayed (errors) and the percentage of successful inhibition of the response on stop trials (p inhibit). The last two rows show the mean and standard deviation (sd) across the sample.
Broadband Gamma Activity Increases for Stop Trials Versus Go Trials in rIFC and rAI
The first analysis assessed the recruitment of rIFC and rAI during the stopping process (i.e., time period T2), by contrasting BGA for stop trials versus go trials. We used a surface‐based analysis akin to what is done with fMRI. Here, instead of voxels in normalized space, we have “recording zones” corresponding to the SEEG electrode contacts, in normalized space. The statistics represent the group level effect (across subjects) for different recording zones. We show that both rIFC and rAI were activated by the stop signal—there was greater BGA signal change (P < 0.05) for stop compared to go trials (Fig. 2, Panel d), in agreement with fMRI studies of the stop‐signal paradigm [see Aron and Poldrack, 2006; Cai et al., 2014; Rae et al., 2014; Xue et al., 2008 and many others]. As the analysis was performed over the time window between the stop signal presentation and the SSRT, this shows that insular locations also show responses to the stop signal before the end of the stop process and prior to the behavioral outcome (stopping or failure to stop).
Electrodes in rIFC Versus rAI are More Likely to Respond Before SSRT
Next, for each participant, we classified electrodes in each ROI into one of four categories at each time‐window (Fig. 3, Panel a,b: not‐active, stop‐responsive, failed‐preference, success‐preference; note: success‐preference was not included in the analysis due to insufficient representation in the data). First we consider the time period between stop signal and SSRT for stop‐responsive electrodes (see line 1 of Table II). For testing the classification of electrodes in rIFC and rAI as being stop‐responsive vs. non‐active we used odds ratio. The odds‐ratio of an electrode being classified as stop‐responsive vs. non‐active were lower for the rAI vs. the rIFC (OR: 0.08, 95% CI from 0.01 to 0.35; for a list of all odd ratios and their credible intervals, see Table 1). Next, we consider the time period after SSRT. Now there was no difference. Indeed, in this time period, there were higher odds of rAI electrodes being stop‐responsive when compared to the earlier time window. Now, we consider failed‐preference electrodes. In the time period between stop signal and SSRT there was no odds ratio difference for electrodes being classified as stop‐responsive vs. non‐active for the rAI vs. the rIFC. Yet, after SSRT there was now a dramatic increase in the odds of being classified as failed‐preference, for both ROIs. In summary, there were more stop‐responsive electrodes in the rIFC than in the rAI between the SS and the SSRT. There were no differences between the two ROIs in the occurrence of failed‐preference responses, which depended only on the time‐window considered.
Figure 3.

Stopping recruits more locations within the rIFC. (Panel a) The proportion of electrodes assigned to each classification type (not‐active; stop‐responsive; failed‐preference, success‐preference) for each time window (T1, T2, and T3) is represented using a Sankey diagram. The height of each ribbon is proportional to the percentage of electrodes falling into each category for each ROI (number of total electrodes in rIFC: 41; in rAI: 59). (Panel b) The cortical distribution of the electrodes is represented by coloring each electrode according to its classification. The three time windows are shown from left to right. [Color figure can be viewed at http://wileyonlinelibrary.com]
The Gamma Band Power Increase Occurs Earlier in rIFC Versus rAI
To compare stopping‐related differences in activity in rIFC versus rAI, we compared all pairs of electrodes (between rIFC and rAI) within each participant and computed a single trial‐level distribution of onset differences. Importantly, this was never done within and not between subjects, to minimize the contribution of interindividual differences in both timing and electrode placement, which could spuriously affect the results. We then computed the median onset differences across trials and tested if the average difference in onset time (for the 206 total electrode pairs) was centered on zero (i.e., no difference between ROIs). BGA power was earlier in the rIFC (P < 0.001) and the distribution of onset differences between rIFC and rAI had a median value of −39 ± 7 ms (i.e., an earlier rIFC onset, Fig. 4; Panel a‐b). To ensure that the results were not driven by a subset of electrode pairs, we repeated the analysis after averaging onset difference values from all electrode pairs within a subject (reducing the observations from 206 to 12, one per subject). The result was still significant (P < 0.01), also when considering successful stop and failed stop trials separately. Note that the same result arose when considering other onset‐difference estimations such as the derivative method (P < 0.05) and cross‐correlations (P < 0.05). The onset time for successful and failed stop trials was not significantly different.
Figure 4.
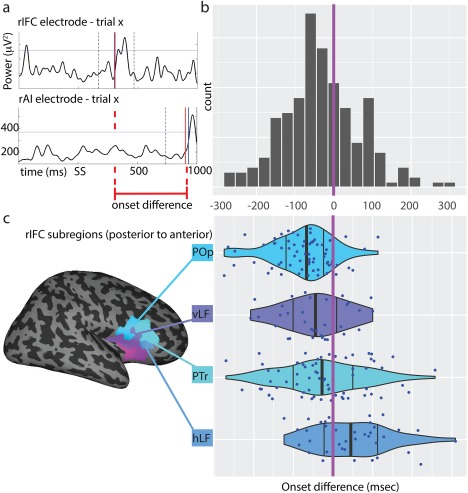
Gamma band power increase occurs earlier in the rIFC. (Panel a) Example of a successful stop trial recorded from one rIFC electrode (upper plot) and one rAI electrode (lower). BGA power (y‐axis) time trace in a −500 to 1,000 ms window (x‐axis) around stop signal presentation (SS). The two vertical dashed lines delimit the window used to identify the onset (200 ms before and 100 ms after the first value exceeding the 95th percentile, marked with the horizontal line). The onset of the peak in BGA power (red vertical line) is used to compute onset difference between the two electrodes at a single trial level. (Panel b) Histogram of onset differences values (x‐axis) for all possible rIFC‐rAI electrodes (averaged across trials). Negative values denote an earlier rIFC onset with respect to rAI. The purple line indicates the point at which the onset difference is zero (onset equality). (Panel c) Onset differences by rIFC subregions (POp = Pars Opercularis; vLF = vertical ramus of the lateral fissure; PTr = Pars Triangularis; hLF = horizontal ramus of the lateral fissure) showing a posterior to anterior gradient in the onset difference distribution, moving from negative values (rIFC earlier than rAI) to positive values (rIFC later than rAI). The vertical black lines show the 25th, 50th, and 75th percentiles for each region. The purple line indicates the point at which the onset difference is zero. [Color figure can be viewed at http://wileyonlinelibrary.com]
When plotting the onset‐differences separately for each subdivision of the rIFC, a clear postero‐anteriorly oriented temporal gradient emerged (Fig. 4; Panel c). The most posterior portions of the rIFC (POp) were the earliest to be show gamma power onset (most negative values relative to rAI), whereas the anterior parts of rIFC, that is, PTr and hLF were the last (most positive ones relative to rAI). No such temporal gradient was noted in the insula.
Testing Full Spectral Frequency Differences Between rAI and rIFC
While the analyses described above focused solely on broadband gamma activity, we also examined the full spectrum to evaluate possible frequency‐specific patterns differentiating the recruitment of the two ROIs. We computed the averaged time‐frequency map (averaging across electrodes within each subject) separately for failed and successful stop and compared power values across the two ROIs. The time‐frequency plots for the rIFC revealed an increase in power between 30 and 150 Hz that occurred before and after SSRT). The rAI showed an increase in power between 20 and 120 Hz (most marked in the upper beta range: 25–35 Hz) that ended around 400–600 ms after SSRT). Both ROIs also showed an increase in power in a lower frequency component, in the theta band (around 4–10 Hz). These patterns were broadly consistent regardless of the outcome of response inhibition (successful or failed stop trials). In successful trials, the rIFC showed an increase of high gamma (120–150 Hz) relative to rAI, occurring before the SSRT (P < 0.05 FDR corrected). On the other hand, rAI showed a later (post‐SSRT) and sustained increase in upper beta band (25–35 Hz between 200 and 500 ms after SSRT) with respect to the rIFC (P < 0.05 FDR corrected). These late frequency‐specific increases in the rAI were even more widespread (in low gamma, around 45–55 Hz between 200 and 600 ms) when considering failed stop trials (Fig. 5).
Figure 5.

Frequency‐specific modulations characterize the two ROIs. Time‐frequency plots averaged across electrodes and participants showing percent signal change (color scale) with respect to baseline. In each plot, the time window starts 200 ms before the SSRT and ends at around 600 ms after that (x‐axis) and the frequencies range from 4 to 180 Hz (y‐axis). The dashed vertical line shows the SSRT (used to align the signals across different subjects). For all rows, the left column shows the average of successful stop trials, the right shows failed stop trials. The upper row shows the average signal change across electrodes recording from the rIFC, the second row from the rAI and the last row shows the contrast between rIFC and rAI (rIFC–rAI). In the contrast plot (last row) the contour lines show significant time‐frequency points (P < 0.05 assessed with permutation test using 2000 permutations and FDR correction for all time‐frequency points). Black contour lines show significant time‐points related to an increase of rIFC signal change, white lines to an increase of rAI. For the same plot aligned to the stop‐signal, see Supporting Information, Figure S1. [Color figure can be viewed at http://wileyonlinelibrary.com]
DISCUSSION
These results harness the high spatio‐temporal resolution of stereo EEG recordings to show that the rIFC, in particular its posterior portion, is recruited after the stop‐signal and before the SSRT. This location is the earliest to be recruited during both successful and failed stop trials (consistent with initiation of the stop process in both cases), and activity here preceded that in other prefrontal locations (anterior rIFC) and in the anterior insula. The timing and magnitude differences challenge the idea that rIFC and rAI operate as a functional cluster [Erika‐Florence et al., 2014; Hampshire and Sharp, 2015a, 2015b]: they instead point to likely different functional roles. These findings confirm earlier electrocorticography (ECoG) studies showing rIFC activation related to successful stopping before SSRT (in two earlier papers, this was mainly reported as an increase in beta‐band power) [Swann et al., 2009; Wessel et al., 2013], and moreover point more specifically to the pars opercularis region – which was proposed as a “key” stopping locus based on aggregated results [Aron et al., 2014].
Both rIFC and rAI are Active During Response Inhibition
A BGA power increase for successful response inhibition was seen in rIFC before SSRT, consistent with the theoretical framework of inhibitory control [Aron et al., 2014], that holds that the rIFC is a key node in the stopping system. Notably, there was no detectable difference between successful and failed stop trials in BGA. This is consistent with many fMRI studies of the stop signal task [Aron and Poldrack, 2006; Cai et al., 2014; Li et al., 2006; Watanabe et al., 2015]. While the success of stopping on a particular trial is jointly determined by the speed/strength of the stop process and the speed/strength of the go process, the prefrontal trigger for stopping (viz. rIFC) does not appear to reflect such variation, at least for fMRI/BGA (it does however in lower frequency bands such as beta [Jha et al., 2015; Swann et al., 2009; Wessel et al., 2013] and downstream in the network, as in basal ganglia and M1 [Alegre et al., 2013; Fischer et al., 2017; Ray et al., 2009; Schmidt et al., 2013]).
A new finding here is that we showed increased BGA in the rAI between the stop signal and SSRT (the only other depth electrode study of insular activity during stopping focused on errors in failed stop trials) [Bastin et al., 2016]. However, the strength of recruitment of rAI was weaker than rIFC, when considering the proportion of stop‐responsive electrodes and the broad‐band gamma power difference (Figs. 3 and 5, respectively) and, as we discuss below, the rAI response was later.
The Recruitment of Ventro‐Frontal Regions Follows a Temporal Gradient
The rAI response during the stopping process occurred later than for rIFC. This relatively later rAI recruitment could fit several theories. First, the rAI may not be important for stopping as such, but might instead register the saliency of the stop signal, as supported by the sensitivity of this region to the frequency of stop‐signals with respect to go signals [Ramautar et al., 2006], or an arousal or autonomic change (stopping has been shown to affect heart rate, Jennings et al., 1992). On this view, the rAI may elicit or monitor arousal changes along with the cingulate as suggested by other studies [Bastin et al., 2016; Cai et al., 2014]. An alternative explanation is that the rAI is itself part of the action stopping network (getting input from the rIFC and relaying it downstream). However, this interpretation is unlikely given that direct structural connections are not established between the rAI and the preSMA and STN, while these have been shown for the rIFC, and their structural/functional features correlate with stopping performance [Aron et al., 2007; Coxon et al., 2012; Forstmann et al., 2012; Madsen et al., 2010; Rae et al., 2015; Swann et al., 2012; Xu et al., 2016].
Apart from the rIFC versus rAI timing differences, we observed a posterior to anterior gradient in the temporal recruitment among rIFC subregions. More posterior locations, such as the pars opercularis, were activated earlier than more anterior sections encompassing pars triangularis and its most anterior sulcal boundary. This intriguing result suggests the existence of a “cascade” or “hierarchy” of processing across ventral frontal subregions. While the overall significance of this awaits functional dissection with hypothesis‐driven task designs, we take this result, for now, to speak against the contention that there is no specific rIFC subregion for outright stopping [Erika‐Florence et al., 2014; Hampshire, 2015]. The fact that the rIFC POp region is earlier in time than other rIFC subregions and then the rAI speaks against a functional cluster of subregions and, more generally, to the importance of discerning time‐resolved activity of prefrontal subregions.
What Happens After Stopping?
Although the rAI was active before SSRT, there were some insular locations (especially dorsal) that showed an increased response on failed stop trials. This result is consistent with the higher BOLD signal amplitude reported for failed vs. successful stop trials in the anterior insula [Cai et al., 2014], which has been interpreted as evidence of error encoding and monitoring [Bastin et al., 2016], although the dorsal and anterior sections of the insula are also recruited by many other task demands [Chang et al., 2012; Nelson et al., 2010]. When compared to the rIFC across the whole time‐frequency space, the rAI showed a sustained increase in the beta and low‐gamma bands after the SSRT, especially following unsuccessful stopping. These components, unique to the rAI, might reflect the engagement of posterror routines following failed inhibition. It is also possible that rAI activity relates to scalp‐EEG signatures found following errors, conflict, and other salient events [Huster et al., 2011, 2013; Menon and Uddin, 2010; Schmueser et al., 2016].
The response classification using BGA demonstrated that several rIFC locations were also responsive to errors. This could represent feedback information regarding performance outcome arriving to both the rAI and the rIFC, potentially to prevent further erroneous responses [Zhang et al., 2017]. It should also be noted that stopping errors are like unexpected action outcomes which have been posited to recruit the stopping network to pause ongoing processes [Klein et al., 2007; Siegert et al., 2014; Wessel et al., 2012 and reviewed by Wessel and Aron, 2017]. In support of the latter scenario, RTs were slower following failed stop trials than go trials (however, exploratory analysis did not find any counterpart to this in increased rIFC activity). Yet we note that a failure in response inhibition is different from an action error (e.g., as pressing the wrong button during a go trial) and thus might constitute a different class of action outcome error.
Cortical Rhythms
While this study shows similar BGA for successful versus failed stop trials, and many fMRI studies show the same (see above), two ECoG studies showed that there is a difference for the beta frequency band (12–30 Hz) [also see Wagner et el., 2017]. Specifically, 4 out of 4 patients in each of Swann et al., 2009 and Wessel et al., 2013 showed increased beta power before SSRT for successful versus failed stop trials (but see Fonken et al., 2016 who did not, although coverage over rIFC was sparse). Unlike BGA, which reflects local activity in the rIFC, the increased power of the beta band response in rIFC for successful trials could reflect a broader network behavior [Swann et al., 2012, 2009] as beta power increases for stopping are prominent in the basal ganglia [Zavala et al., 2015]. Here we show higher beta power in the rIFC versus rAI during successful stopping (Fig. 5), although this was not statistically significant. There are several possible explanations for the discrepancy between the current results and the earlier ECoG studies showing a clear beta band modulation [Swann et al., 2009; Wessel et al., 2013]. One is that the current recording was performed with SEEG depth electrodes and the others with subdural grids (which have different electrode size thus recording characteristics). Another is that here the stopping rate was 33% whereas in Swann et al. [2009], it was effectively half of that—and there are indications that the beta response reduces with increased probability of stopping [Swann et al., 2013; Wagner et al., 2017].
Limitations
This study had some limitations. First, like all intracranial studies, these data come from patients with epilepsy. However, we did not include any data here from patients with seizure onset in, or those who underwent a subsequent resection of right lateral PFC. Moreover, we study a fairly sizeable sample, by the standards of the field, allowing for more reliable group level statistics. Second, some have raised the concern that SSRT might overestimate the “inhibition time” [De Jong et al., 1990; Raud and Huster, 2017; Salinas and Stanford, 2013; Van Den Wildenberg et al., 2010]. However, even if our estimates of SSRT are imprecise in the tens of milliseconds or longer, that would not appear to invalidate our main conclusions regarding the relative timing of recruitment of the rIFC and rAI. Third, a question may arise as to our definition of neural “activation,” that is, the time of BGA onset for the analyses in Figure 4. BGA has been shown by others [Cardin et al., 2009] to closely index local neural processing and input into the region. We used the onset of task relevant BGA to define cortical activation, analogously to previous work [Foster et al., 2015; Foster and Parvizi, 2012], although the methods for determining the exact onset BGA are many and not confined to the one(s) adopted here. Fourth, the major theoretical relevance of a timing difference for rIFC and rAI during outright stopping is for the debate about whether rIFC is a key node for stopping that is separate from other right frontal areas such as rAI, or whether these work as a cluster, or whether, indeed rAI could drive the stopping system itself. Our results appear to support the primary position of the rIFC as being related to outright stopping. This does not however bear on the question of whether the caudal sector rIFC is specialized for prefrontal inhibitory control or instead performs a more general function of which this is an instance, and/or, what is likely, many different functions.
CONCLUSION
Taken together, our results showing different timing, strength of recruitment (in terms of number of responsive loci and power) and frequency components suggests a functional dissociation between rIFC and rAI. This bears on alternative claims that the rIFC is a critical prefrontal node for outright stopping versus counter claims that there is instead an anterior insula/frontal operculum cluster, or a set of prefrontal regions all involved [Erika‐Florence et al., 2014]. Our approach and results suggest that claims based on fMRI alone have limitations. First, it does not have the temporal resolution to distinguish between regions. Second, it focuses on the changes in response amplitude alone, while it has been pointed out that the velocity more than the magnitude of the response could carry important information in stopping, also in the rIFC [Jha et al., 2015]. Our results add timing evidence to previous findings on response inhibition and specifically suggest that the posterior part of the rIFC is the driver of a prefrontally mediated network to stop responses, with rAI following closely to register other putative aspects, such as saliency/arousal and adjustments. More generally, the results contribute to the literature addressing dissociability of right frontal subregions in the stopping process, which often cannot be assessed directly using noninvasive imaging techniques.
Supporting information
Supporting Information
ACKNOWLEDGMENTS
The authors are indebted to the patients who participated in this study, the neurologists (Drs Slater, Kalamangalam, Hope, and Thomas) who provide care to these patients, and the nurses and technicians in the Epilepsy Monitoring Unit at Memorial Hermann Hospital who helped make this research possible. The authors declare no conflicts of interest.
Contributor Information
Adam R. Aron, Email: adamaron@ucsd.edu.
Nitin Tandon, Email: nitin.tandon@uth.tmc.edu.
REFERENCES
- Albert A, Anderson JAA (1984): On the existence of maximum‐likelihood estimates in logistic regression models. Biometrika [Google Scholar]
- Alegre M, Lopez‐Azcarate J, Obeso I, Wilkinson L, Rodriguez‐Oroz MC, Valencia M, Garcia‐Garcia D, Guridi J, Artieda J, Jahanshahi M, Obeso JA (2013): The subthalamic nucleus is involved in successful inhibition in the stop‐signal task: A local field potential study in Parkinson's disease. Exp Neurol 239:1–12. [DOI] [PubMed] [Google Scholar]
- Allison PD (2008): Convergence Failures in Logistic Regression. SAS Glob Forum. [Google Scholar]
- Aron AR, Herz DM, Brown P, Forstmann BU, Zaghloul K (2016): Frontosubthalamic circuits for control of action and cognition. J Neurosci 36:11489–11495. [DOI] [PMC free article] [PubMed] [Google Scholar]
- Aron AR, Robbins TW, Poldrack R. a (2014): Inhibition and the right inferior frontal cortex: One decade on. Trends Cogn Sci 18:177–185. [DOI] [PubMed] [Google Scholar]
- Aron AR, Behrens TE, Smith S, Frank MJ, Poldrack R. a (2007): Triangulating a cognitive control network using diffusion‐weighted magnetic resonance imaging (MRI) and functional MRI. J Neurosci 27:3743–3752. [DOI] [PMC free article] [PubMed] [Google Scholar]
- Aron AR, Cai W, Badre D, Robbins TW (2015): Evidence Supports Specific Braking Function for Inferior PFC. Trends in Cognitive Sciences. Elsevier Ltd. [DOI] [PubMed] [Google Scholar]
- Aron AR, Poldrack R. a (2006): Cortical and subcortical contributions to Stop signal response inhibition: Role of the subthalamic nucleus. J Neurosci 26:2424–2433. [DOI] [PMC free article] [PubMed] [Google Scholar]
- Bari A, Robbins TW (2013): Inhibition and impulsivity: Behavioral and neural basis of response control. Prog Neurobiol 108:44–79. [DOI] [PubMed] [Google Scholar]
- Bastin J, Deman P, David O, Gueguen M, Benis D, Minotti L, Hoffman D, Combrisson E, Kujala J, Perrone‐Bertolotti M, Kahane P, Lachaux J‐P, Jerbi K (2016): Direct recordings from human anterior insula reveal its leading role within the error‐monitoring network. Cereb Cortex 1–13. [DOI] [PubMed] [Google Scholar]
- Boehler CN, Appelbaum LG, Krebs RM, Hopf JM, Woldorff MG (2010): Pinning down response inhibition in the brain ‐ Conjunction analyses of the Stop‐signal task. NeuroImage 52:1621–1632. [DOI] [PMC free article] [PubMed] [Google Scholar]
- Brainard DH (1997): The psychophysics toolbox. Spat Vis 10:433–436. [PubMed] [Google Scholar]
- Brooks S, Gelman A, Jones GL, Meng X‐L (2011): Handbook of Markov Chain Monte Carlo.
- Bürkner P‐C (2016): BRMS: An R package for Bayesian generalized linear mixed models using Stan. J Stat Softw. [Google Scholar]
- Cai W, Ryali S, Chen T, Li C‐SR, Menon V (2014): Dissociable roles of right inferior frontal cortex and anterior insula in inhibitory control: Evidence from intrinsic and task‐related functional parcellation, connectivity, and response profile analyses across multiple datasets. J Neurosci 34:14652–14667. [DOI] [PMC free article] [PubMed] [Google Scholar]
- Cai W, Chen T, Ryali S, Kochalka J, Li CSR, Menon V (2016): Causal interactions within a frontal‐cingulate‐parietal network during cognitive control: Convergent evidence from a multisite‐multitask investigation. Cereb Cortex 26:2140–2153. [DOI] [PMC free article] [PubMed] [Google Scholar]
- Cardin J. a, Carlén M, Meletis K, Knoblich U, Zhang F, Deisseroth K, Tsai L‐H, Moore CI (2009): Driving fast‐spiking cells induces gamma rhythm and controls sensory responses. Nature 459:663–667. [DOI] [PMC free article] [PubMed] [Google Scholar]
- Chambers CD, Garavan H, Bellgrove MA (2009): Insights into the neural basis of response inhibition from cognitive and clinical neuroscience. Neurosci Biobehav Rev 33:631–646. [DOI] [PubMed] [Google Scholar]
- Chang LJ, Yarkoni T, Khaw MW, Sanfey AG (2012): Decoding the Role of the Insula in Human Cognition: Functional Parcellation and Large‐Scale Reverse Inference. [DOI] [PMC free article] [PubMed]
- Chen G, Saad ZS, Nath AR, Beauchamp MS, Cox RW (2012): FMRI group analysis combining effect estimates and their variances. NeuroImage 60:747–765. [DOI] [PMC free article] [PubMed] [Google Scholar]
- Chikazoe J, Jimura K, Hirose S, Yamashita K, Miyashita Y, Konishi S (2009): Preparation to inhibit a response complements response inhibition during performance of a stop‐signal task. J Neurosci 29:15870–15877. [DOI] [PMC free article] [PubMed] [Google Scholar]
- Cox R (1996): AFNI: Software for analysis and visualization of functional magnetic resonance neuroimages. Comput Biomed Res 29:162–173. [DOI] [PubMed] [Google Scholar]
- Coxon JP, Van Impe a, Wenderoth N, Swinnen SP (2012): Aging and inhibitory control of action: Cortico‐subthalamic connection strength predicts stopping performance. J Neurosci 32:8401–8412. [DOI] [PMC free article] [PubMed] [Google Scholar]
- Darvas F, Scherer R, Ojemann JG, Rao RP, Miller KJ, Sorensen LB (2010): High gamma mapping using EEG. NeuroImage 49:930–938. [DOI] [PMC free article] [PubMed] [Google Scholar]
- Destrieux C, Fischl B, Dale A, Halgren E (2010): Automatic parcellation of human cortical gyri and sulci using standard anatomical nomenclature. NeuroImage 53:1–15. [DOI] [PMC free article] [PubMed] [Google Scholar]
- Engell AD, Huettel S, McCarthy G (2012): The fMRI BOLD signal tracks electrophysiological spectral perturbations, not event‐related potentials. NeuroImage 59:2600–2606. [DOI] [PMC free article] [PubMed] [Google Scholar]
- Erika‐Florence M, Leech R, Hampshire A (2014): A functional network perspective on response inhibition and attentional control. Nat Commun 5:4073. [DOI] [PMC free article] [PubMed] [Google Scholar]
- Fischer P, Pogosyan A, Herz DM, Cheeran B, Green AL, Fitzgerald J, Aziz TZ, Hyam J, Little S, Foltynie T, Limousin P, Zrinzo L, Brown P, Tan H (2017): Subthalamic nucleus gamma activity increases not only during movement but also during movement inhibition. Elife 6:1–21. [DOI] [PMC free article] [PubMed] [Google Scholar]
- Fischl B (2012): FreeSurfer. NeuroImage [DOI] [PMC free article] [PubMed] [Google Scholar]
- Fischl B, Van Der Kouwe A, Destrieux C, Halgren E, Ségonne F, Salat DH, Busa E, Seidman LJ, Goldstein J, Kennedy D, Caviness V, Makris N, Rosen B, Dale AM (2004): Automatically parcellating the human cerebral cortex. Cereb Cortex 14:11–22. [DOI] [PubMed] [Google Scholar]
- Fonken YM, Rieger JW, Tzvi E, Crone NE, Chang E, Parvizi J, Knight RT, Krämer UM (2016): Frontal and motor cortex contributions to response inhibition: Evidence from electrocorticography. J Neurophysiol jn.00708.2015. [DOI] [PMC free article] [PubMed] [Google Scholar]
- Forstmann BU, Keuken MC, Jahfari S, Bazin PL, Neumann J, Schäfer A, Anwander A, Turner R (2012): Cortico‐subthalamic white matter tract strength predicts interindividual efficacy in stopping a motor response. NeuroImage 60:370–375. [DOI] [PubMed] [Google Scholar]
- Foster BL, Parvizi J (2012): Resting oscillations and cross‐frequency coupling in the human posteromedial cortex. NeuroImage 60:384–391. [DOI] [PMC free article] [PubMed] [Google Scholar]
- Foster BL, Rangarajan V, Shirer WR, Parvizi J (2015): Intrinsic and task‐dependent coupling of neuronal population activity in human parietal cortex. Neuron 86:578–590. [DOI] [PMC free article] [PubMed] [Google Scholar]
- Gaona CM, Sharma M, Freudenburg ZV, Breshears JD, Bundy DT, Roland J, Barbour DL, Schalk G, Leuthardt EC (2011): Nonuniform high‐gamma (60–500 Hz) power changes dissociate cognitive task and anatomy in human cortex. J Neurosci 31:2091–2100. [DOI] [PMC free article] [PubMed] [Google Scholar]
- Hampshire A (2015): Putting the brakes on inhibitory models of frontal lobe function. NeuroImage 113:340–355. [DOI] [PMC free article] [PubMed] [Google Scholar]
- Hampshire A, Sharp D (2015a): Inferior PFC subregions have broad cognitive roles. Trends Cogn Sci xx:2012. [DOI] [PubMed] [Google Scholar]
- Hampshire A, Sharp DJ (2015b): Contrasting network and modular perspectives on inhibitory control. Trends Cogn Sci 1–8. [DOI] [PubMed] [Google Scholar]
- Huster RJ, Eichele T, Enriquez‐Geppert S, Wollbrink A, Kugel H, Konrad C, Pantev C (2011): Multimodal imaging of functional networks and event‐related potentials in performance monitoring. NeuroImage 56:1588–1597. [DOI] [PubMed] [Google Scholar]
- Huster RJ, Enriquez‐Geppert S, Lavallee CF, Falkenstein M, Herrmann CS (2013): Electroencephalography of response inhibition tasks: Functional networks and cognitive contributions. Int J Psychophysiol 87:217–233. [DOI] [PubMed] [Google Scholar]
- Jahanshahi M, Obeso I, Rothwell JC, Obeso J. a (2015): A fronto‐striato‐subthalamic‐pallidal network for goal‐directed and habitual inhibition. Nat Rev Neurosci 16:719–732. [DOI] [PubMed] [Google Scholar]
- Jennings JR, van der Molen MW, Brock K, Somsen RJ (1992): On the synchrony of stopping motor responses and delaying heartbeats. J Exp Psychol Hum Percept Perform 18:422–436. [DOI] [PubMed] [Google Scholar]
- Jha A, Nachev P, Barnes G, Husain M, Brown P, Litvak V (2015): The frontal control of stopping. Cereb Cortex 25:4392–4406. [DOI] [PMC free article] [PubMed] [Google Scholar]
- De Jong R, Coles MG, Logan GD, Gratton G (1990): In search of the point of no return: The control of response processes. J Exp Psychol Hum Percept Perform 16:164–182. [DOI] [PubMed] [Google Scholar]
- Kadipasaoglu CM, Baboyan VG, Conner CR, Chen G, Saad ZS, Tandon N (2014): Surface‐based mixed effects multilevel analysis of grouped human electrocorticography. NeuroImage 101:215–224. [DOI] [PubMed] [Google Scholar]
- Kadipasaoglu CM, Conner CR, Whaley ML, Baboyan VG, Tandon N (2016): Category‐selectivity in human visual cortex follows cortical topology: A grouped icEEG study. Ed. Suliann Ben Hamed. PLoS One 11:e0157109. [DOI] [PMC free article] [PubMed] [Google Scholar]
- Klein TA, Endrass T, Kathmann N, Neumann J, von Cramon DY, Ullsperger M (2007): Neural correlates of error awareness. NeuroImage 34:1774–1781. [DOI] [PubMed] [Google Scholar]
- Li CR, Huang C, Constable RT, Sinha R (2006): Imaging response inhibition in a stop‐signal task: Neural correlates independent of signal monitoring and post‐response processing. J Neurosci 26:186–192. [DOI] [PMC free article] [PubMed] [Google Scholar]
- Logan GD, Cowan WB (1984): On the ability to inhibit thought and action. Psychol Rev 91:295–327. [DOI] [PubMed] [Google Scholar]
- Logothetis NK, Pauls J, Augath M, Trinath T, Oeltermann A (2001): Neurophysiological investigation of the basis of the fMRI signal. Nature 412:150–157. [DOI] [PubMed] [Google Scholar]
- Madsen KS, Baaré WFC, Vestergaard M, Skimminge A, Ejersbo LR, Ramsøy TZ, Gerlach C, Åkeson P, Paulson OB, Jernigan TL (2010): Response inhibition is associated with white matter microstructure in children. Neuropsychologia 48:854–862. [DOI] [PubMed] [Google Scholar]
- Maris E, Vugt MV, Kahana M (2011): Spatially distributed patterns of oscillatory coupling between high‐frequency amplitudes and low‐frequency phases in human iEEG. NeuroImage 54:836–850. [DOI] [PubMed] [Google Scholar]
- Menon V, Uddin LQ (2010): Saliency, switching, attention and control: A network model of insula function. Brain Struct Funct. [DOI] [PMC free article] [PubMed] [Google Scholar]
- Mukamel R, Gelbard H, Arieli A, Hasson U, Fried I, Malach R (2005): Coupling between neuronal firing, field potentials, and FMRI in human auditory cortex. Science 309:951–954. [DOI] [PubMed] [Google Scholar]
- Nelson SM, Dosenbach NUF, Cohen AL, Wheeler ME, Schlaggar BL, Petersen SE (2010): Role of the anterior insula in task‐level control and focal attention. Brain Struct Funct. [DOI] [PMC free article] [PubMed] [Google Scholar]
- Oldfield RC (1971): The assessment and analysis of handedness: The Edinburgh inventory. Neuropsychologia 9:97–113. [DOI] [PubMed] [Google Scholar]
- Pieters TA, Conner CR, Tandon N (2013): Recursive grid partitioning on a cortical surface model: An optimized technique for the localization of implanted subdural electrodes. J Neurosurg 118:1086–1097. [DOI] [PubMed] [Google Scholar]
- R Core Team (2016): R: A Language and Environment for Statistical Computing. R Foundation for Statistical Computing. [Google Scholar]
- Rae CL, Hughes LE, Weaver C, Anderson MC, Rowe JB (2014): Selection and stopping in voluntary action: A meta‐analysis and combined fMRI study. NeuroImage 86:381–391. [DOI] [PMC free article] [PubMed] [Google Scholar]
- Rae CL, Hughes LE, Anderson MC, Rowe XB, Rowe JB (2015): The prefrontal cortex achieves inhibitory control by facilitating subcortical motor pathway connectivity. J Neurosci 35:786–794. [DOI] [PMC free article] [PubMed] [Google Scholar]
- Ramautar JR, Slagter HA, Kok A, Ridderinkhof KR (2006): Probability effects in the stop‐signal paradigm: The insula and the significance of failed inhibition. Brain Res 1105:143–154. [DOI] [PubMed] [Google Scholar]
- Raud L, Huster RJ (2017): The temporal dynamics of response inhibition and their modulation by cognitive control. Brain Topogr 30:1–16. [DOI] [PubMed] [Google Scholar]
- Ray NJ, Jenkinson N, Brittain J, Holland P, Joint C, Nandi D, Bain PG, Yousif N, Green A, Stein JS, Aziz TZ (2009): The role of the subthalamic nucleus in response inhibition: Evidence from deep brain stimulation for Parkinson's disease. Neuropsychologia 47:2828–2834. [DOI] [PubMed] [Google Scholar]
- Ray S, Niebur E, Hsiao SS, Sinai A, Crone NE (2008): High‐frequency gamma activity (80–150Hz) is increased in human cortex during selective attention. Clin Neurophysiol 119:116–133. [DOI] [PMC free article] [PubMed] [Google Scholar]
- Saad ZS, Reynolds RC, Argall B, Japee S, Cox RW (2004): SUMA: An interface for surface‐based intra‐ and inter‐subject analysis with AFNI. Biomed Imaging Nano to Macro, 2004 IEEE Int Symp:1510–1513 Vol. 2.
- Salinas E, Stanford TR (2013): The countermanding task revisited: Fast stimulus detection is a key determinant of psychophysical performance. J Neurosci 33:5668–5685. [DOI] [PMC free article] [PubMed] [Google Scholar]
- Schmidt R, Leventhal DK, Mallet N, Chen F, Berke JD (2013): Canceling actions involves a race between basal ganglia pathways. Nat Neurosci 16:1118–1124. [DOI] [PMC free article] [PubMed] [Google Scholar]
- Schmueser L, Sebastian A, Mobascher A, Lieb K, Feige B, T??scher O (2016): Data‐driven analysis of simultaneous EEG/fMRI reveals neurophysiological phenotypes of impulse control. Hum Brain Mapp 37:3114–3136. [DOI] [PMC free article] [PubMed] [Google Scholar]
- Siegert S, Herrojo Ruiz M, Brücke C, Huebl J, Schneider G‐H, Ullsperger M, Kühn AA (2014): Error signals in the subthalamic nucleus are related to post‐error slowing in patients with Parkinson's disease. Cortex 60:103–120. [DOI] [PubMed] [Google Scholar]
- Swann NC, Cai W, Conner CR, Pieters T. a, Claffey MP, George JS, Aron AR, Tandon N (2012): Roles for the pre‐supplementary motor area and the right inferior frontal gyrus in stopping action: Electrophysiological responses and functional and structural connectivity. NeuroImage 59:2860–2870. [DOI] [PMC free article] [PubMed] [Google Scholar]
- Swann NC, Tandon N, Pieters T. a, Aron AR (2013): Intracranial electroencephalography reveals different temporal profiles for dorsal‐ and ventro‐lateral prefrontal cortex in preparing to stop action. Cereb Cortex 23:2479–2488. [DOI] [PMC free article] [PubMed] [Google Scholar]
- Swann N, Tandon N, Canolty R, Ellmore TM, McEvoy LK, Dreyer S, DiSano M, Aron AR (2009): Intracranial EEG reveals a time‐ and frequency‐specific role for the right inferior frontal gyrus and primary motor cortex in stopping initiated responses. J Neurosci 29:12675–12685. [DOI] [PMC free article] [PubMed] [Google Scholar]
- Swick D, Ashley V, Turken U (2011): Are the neural correlates of stopping and not going identical? Quantitative meta‐analysis of two response inhibition tasks. NeuroImage 56:1655–1665. [DOI] [PubMed] [Google Scholar]
- Tort ABL, Kramer M. a, Thorn C, Gibson DJ, Kubota Y, Graybiel AM, Kopell NJ (2008): Dynamic cross‐frequency couplings of local field potential oscillations in rat striatum and hippocampus during performance of a T‐maze task. Proc Natl Acad Sci USA 105:20517–20522. [DOI] [PMC free article] [PubMed] [Google Scholar]
- Verbruggen F, Logan GD (2009): Models of response inhibition in the stop‐signal and stop‐change paradigms. Neurosci Biobehav Rev. [DOI] [PMC free article] [PubMed] [Google Scholar]
- Wagner J, Wessel JR, Ghahremani A, Aron AR (2017): Establishing a right frontal beta signature for stopping action in scalp EEG: implications for testing inhibitory control in other task contexts. J Cogn Neurosci. [DOI] [PMC free article] [PubMed] [Google Scholar]
- Wang X‐J (2010): Neurophysiological and computational principles of cortical rhythms in cognition. Physiol Rev 90:1195–1268. [DOI] [PMC free article] [PubMed] [Google Scholar]
- Watanabe T, Hanajima R, Shirota Y, Tsutsumi R, Shimizu T, Hayashi T, Terao Y, Ugawa XY, Katsura M, Kunimatsu A, Ohtomo K, Hirose S, Miyashita Y, Konishi S (2015): Effects of rTMS of pre‐supplementary motor area on fronto basal ganglia network activity during stop‐signal task. J Neurosci 35:4813–4823. [DOI] [PMC free article] [PubMed] [Google Scholar]
- Wessel JR, Conner CR, Aron a. R, Tandon N (2013): Chronometric electrical stimulation of right inferior frontal cortex increases motor braking. J Neurosci 33:19611–19619. [DOI] [PMC free article] [PubMed] [Google Scholar]
- Wessel JR, Danielmeier C, Morton JB, Ullsperger M (2012): Surprise and error: Common neuronal architecture for the processing of errors and novelty. J Neurosci 32:7528–7537. [DOI] [PMC free article] [PubMed] [Google Scholar]
- Wessel JR, Aron AR (2017): On the globality of motor suppression: Unexpected events and their influence on behavior and cognition. Neuron 93:259–280. [DOI] [PMC free article] [PubMed] [Google Scholar]
- Whaley ML, Kadipasaoglu CM, Cox SJ, Tandon N (2016): Modulation of orthographic decoding by frontal cortex. J Neurosci 36:1173–1184. [DOI] [PMC free article] [PubMed] [Google Scholar]
- Wiecki TV, Frank MJ (2013): A computational model of inhibitory control in frontal cortex and basal ganglia. Psychol Rev 120:329–355. [DOI] [PubMed] [Google Scholar]
- Van Den Wildenberg WPM, Burle B, Vidal F, Van Der Molen MW, Ridderinkhof KR, Hasbroucq T (2010): Mechanisms and dynamics of cortical motor inhibition in the stop‐signal paradigm: A TMS study. J Cogn Neurosci 22:225–239. [DOI] [PubMed] [Google Scholar]
- Xu B, Sandrini M, Wang WT, Smith JF, Sarlls JE, Awosika O, Butman JA, Horwitz B, Cohen LG (2016): PreSMA stimulation changes task‐free functional connectivity in the fronto‐basal‐ganglia that correlates with response inhibition efficiency. Hum Brain Mapp 37:3236–3249. [DOI] [PMC free article] [PubMed] [Google Scholar]
- Xue G, Aron AR, Poldrack RA (2008): Common neural substrates for inhibition of spoken and manual responses. Cereb Cortex 18:1923–1932. [DOI] [PubMed] [Google Scholar]
- Zavala B, Zaghloul K, Brown P (2015): The subthalamic nucleus, oscillations, and conflict. Mov Disord 30:328–338. [DOI] [PMC free article] [PubMed] [Google Scholar]
- Zhang Y, Ide JS, Zhang S, Hu S, Valchev NS, Tang X, Li CR (2017): Distinct neural processes support post‐success and post‐error slowing in the stop signal task. Neuroscience 357:273–284. [DOI] [PMC free article] [PubMed] [Google Scholar]
Associated Data
This section collects any data citations, data availability statements, or supplementary materials included in this article.
Supplementary Materials
Supporting Information