Gene clustering is relevant in the regulation of gene expression. However, the mechanisms of gene clustering remain to be elucidated. Using a glial differentiation system, we found that the clustering of Gfap, an astrocyte-pecific gene, with Osmr enhances transcription of both genes. BRG1 and the JAK-STAT pathway are central to the clustering.
Abstract
Long-range chromatin interactions between gene loci in the cell nucleus are important for many biological processes, including transcriptional regulation. Previously, we demonstrated that several genes specifically cluster with the astrocyte-specific gene for glial fibrillary acidic protein (Gfap) during astrocyte differentiation; however, the molecular mechanisms for gene clustering remain largely unknown. Here we show that brahma-related gene 1 (BRG1), an ATP-dependent chromatin remodeling factor, and the transcription factor STAT3 are required for Gfap and oncostatin M receptor (Osmr) clustering and enhanced expression through recruitment to STAT3 recognition sequences and that gene clustering occurs prior to transcriptional up-regulation. BRG1 knockdown and JAK-STAT signaling inhibition impaired clustering, leading to transcriptional down-regulation of both genes. BRG1 and STAT3 were recruited to the same Gfap fragment; JAK-STAT signaling inhibition impaired BRG1 recruitment. Our results suggest that BRG1 and STAT3 coordinately regulate gene clustering and up-regulate Gfap and Osmr transcription.
INTRODUCTION
Chromosomes occupy distinct locations in the cell nucleus in the form of chromosome territories within which the spatial arrangement of genes is nonrandom (Cremer and Cremer, 2010). In higher eukaryotes, chromosomal regions containing active genes often extend outside of the chromosomal territories and associate with other active regions to share transcription factories. Studies utilizing chromosome conformation capture (3C) and its derivative techniques (e.g., 4C, 5C, and ChIA-PET) have suggested that gene clustering plays a role in transcriptional optimization (Fullwood et al., 2009; Wei et al., 2013; Williamson et al., 2014). However, the precise mechanisms underlying gene clustering remain largely unexplored.
Using an enhanced 4C method with minor modifications (modified e4C), we recently described the occurrence of large-scale interchromosomal interactions during the differentiation of neural precursor cells (NPCs) to astrocytes (Ito et al., 2016). In addition, we identified genes that specifically cluster with an astrocyte-specific gene, glial fibrillary acidic protein (Gfap), in NPC-derived astrocytes. These findings support the possibility that clustering of coexpressing genes is involved in astrocyte differentiation. Osmr, included among the 18 identified clustering genes, encodes the oncostatin M receptor (OSMR), which is transcriptionally activated by STAT3, as is Gfap (Tiffen et al., 2008). OSMR is essential for the activation of downstream JAK-STAT signaling pathways by OSM, a member of the interleukin (IL)-6 family of cytokines, through the formation of a heterodimer with the common signal transducer gp130 to induce transcription (Ichihara et al., 1997; Morikawa, 2005). In turn, JAK-STAT signaling is important for the induction of astrocyte differentiation in the fetal brain (Yanagisawa et al., 1999).
STAT3 recruitment to a subset of IL-6-inducible genes (Giraud et al., 2004; Ni and Bremner, 2007) is reliant upon a subunit of SWI/SNF chromatin remodeling protein complexes termed brahma-regulated gene-1 (BRG1), which utilizes energy from ATP hydrolysis to disrupt histone–DNA interactions, resulting in transcriptional activation (Trotter and Archer, 2008). BRG1 is also known as a mediator of long-range interactions of enhancer regions and transcription start sites (Kim et al., 2009). Furthermore, BRG1 is needed to repress neuronal differentiation and promote astrogenesis of mouse neural stem cells (Matsumoto et al., 2006). These findings illustrate the importance of STAT3 and BRG1 in astrogenesis. However, how these molecules participate in establishing nuclear architecture, including gene positioning, and how this gene positioning affects the transcriptional activity in developing astrocytes remains to be elucidated.
Here we present evidence for a mechanism for Gfap and Osmr gene clustering. We demonstrate that clustering of Gfap and Osmr occurs prior to transcriptional activation of both genes and that Gfap expression predominantly occurs from clustered alleles. This gene clustering is mediated by STAT3 and BRG1, and impairment of both factors leads to loss of gene clustering and transcriptional down-regulation of both genes. Collectively, our results show that BRG1 and STAT3 are required for gene clustering between Gfap and Osmr and their transcriptional enhancement.
RESULTS
Gene clustering of Gfap and Osmr occurs prior to their transcriptional activation
To determine whether Osmr clusters with Gfap not only in cultured NPC-derived astrocytes (leukocyte inhibitory factor [LIF]-stimulated cells), as described in our previous study (Ito et al., 2016), but also in vivo, we first performed DNA fluorescence in situ hybridization (FISH) using mouse brain sections (Figure 1A). To exclude the possibility that nuclear size affects gene clustering, we first measured the nuclear diameters in each type of cell (Figure 1B) and normalized the distances between Osmr and Gfap to average the nuclear diameters in each cell type. We found that the incidence of gene clustering between Gfap and Osmr was significantly increased in GFAP-positive cells in the forebrains of embryonic day (E) 17.5 fetuses and postnatal day (P) 1 mice compared with that of Nestin-positive cells of E14 brains (p = 0.002 and p = 0.030, respectively) (Figure 1C). The cumulative frequency of interprobe distances between Gfap and Osmr in GFAP-positive cells in the E17 forebrain significantly differed from that in Nestin-positive cells in the E14 forebrain throughout the entire range of distances examined, whereas the frequency in GFAP-positive cells in the P1 forebrain did not differ from that in the E14 forebrain (Figure 1D). The results demonstrate that the different incidence of gene clustering among these cell types cannot be attributed to variation in nuclear size; in addition, these cell types exhibited very similar nuclear shapes.
FIGURE 1:
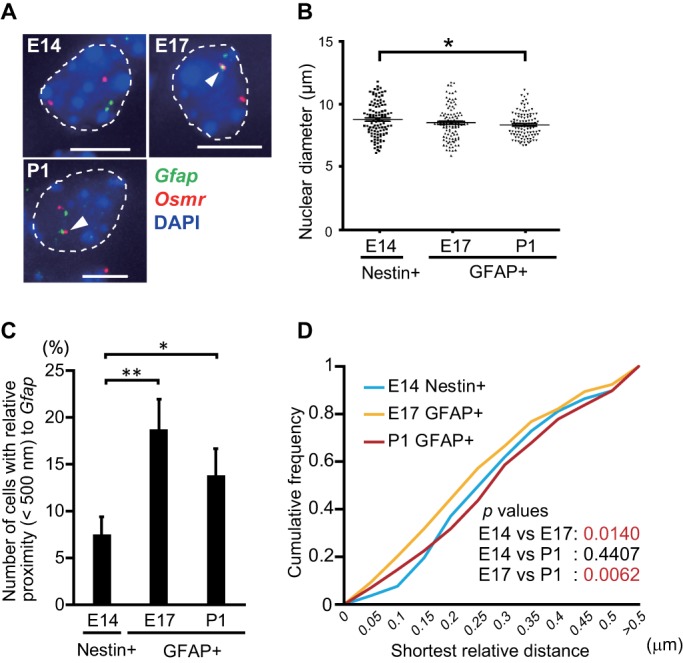
Confirmation of Gfap and Osmr gene clustering in brain sections. (A) Projected images of double-labeled DNA FISH for Gfap (green) and Osmr (red) in embryonic day (E) 14 Nestin-positive NPCs, E17 and postnatal day (P) 1 GFAP-positive astrocytes. Nuclei were counterstained with 4’,6-diamidino-2-phenylindole (DAPI) (blue). Scale bar = 5 μm. Arrowheads indicate clustering loci. (B) Nuclear diameters of E14 Nestin-positive NPCs and E17 and P1 GFAP-positive astrocytes. Nuclear diameters represent the largest diameter of each nucleus stained with DAPI. The Steel test was performed; *p < 0.05 (n = 108). (C) Clustering frequencies determined using DNA FISH for Gfap and Osmr in E14 Nestin-positive NPCs as well as E17 and P1 GFAP-positive astrocytes. Error bars: means ± SEM with three biological replicates (n = 53–54). *p < 0.05, **p < 0.01 by ANOVA with Fisher’s LSD post hoc test. (D) Cumulative frequencies of interprobe distances between Gfap and Osmr in E14 Nestin-positive NPCs as well as GFAP-positive E17 and P1 astrocytes. The Kolmogorov–Smirnov (K–S) test was performed (n = 320).
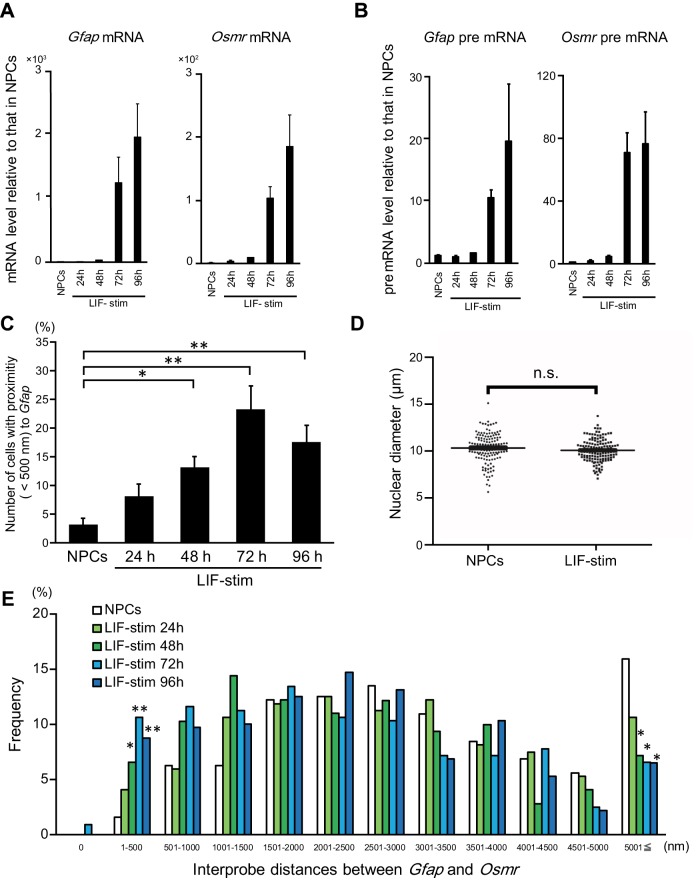
To understand the correlation between the transcriptional activation and gene clustering of Gfap and Osmr, we addressed potential temporal changes both in transcription and in clustering by assaying mRNA and pre-mRNA reverse transcription–quantitative PCR (RT-qPCR) and DNA FISH every 24 h after leukocyte inhibitory factor stimulation. The mRNAs and pre-mRNAs of both Gfap and Osmr were robustly increased at 72 h after the stimulation (Figure 2, A and B). We also found that the clustering was significantly increased at 48 h after the stimulation (Figure 2C). As there were no differences in the nuclear diameters of NPCs and LIF-stimulated cells (Figure 2D), we concluded that the increased clustering incidence was not attributable to smaller nuclei in LIF-stimulated cells. In particular, the frequencies of interprobe distances of less than 1500 nm were increased upon LIF stimulation, whereas statistical significance was only observed in the range of 1–500 nm (Figure 2E), suggesting that the Osmr and Gfap gene loci became closer. These results indicate that the timing of Gfap and Osmr gene clustering is associated with the transcriptional activation of both genes.
FIGURE 2:
Gfap and Osmr gene cluster in prior to the transcriptional activation of both genes. (A, B) Quantitative RT-PCR was performed on mRNA (A) and pre-mRNA (B) of Gfap and Osmr. The expression level of each gene was determined in NPCs alone and stimulated with LIF for the indicated time (LIF-stim). The results were normalized to Gapdh expression. Each graph represents the mean (±SEM) relative amount (compared with NPCs) of at least three experiments. (C) Clustering frequencies of Gfap and Osmr determined using DNA FISH in NPCs alone and stimulated with LIF for the indicated time (LIF-stim). Each graph represents the mean (±SEM) percentage for the number of cells with clustering alleles of at least three experiments. The Dunnett test was performed. *p < 0.05, **p < 0.01 (n = 53–54). (D) Nuclear diameters of NPCs alone and stimulated with LIF for 96 h (LIF-stim). Nuclear diameters represent the largest diameter of each nucleus stained with DAPI. The Steel test was performed (n = 138). (E) Frequencies of interprobe distances between Gfap and Osmr in NPCs; cells were stimulated with LIF for the indicated time (LIF-stim). The Dunnett test was performed for each interprobe distance. *p < 0.05, **p < 0.01.
Gene clustering of Gfap and Osmr promotes transcriptional activation of Gfap
As gene clustering has been suggested to play a role in achieving high-level transcription (Schoenfelder et al., 2010), we next performed triple color FISH for Gfap RNA and DNA and Osmr DNA in LIF-stimulated cells (96 h after the stimulation) to assess whether the gene clustering of Gfap and Osmr is related to gene expression (Figure 3A). Gfap transcripts were observed in 24.5 ± 6.2% of LIF-stimulated cells (unpublished data). Furthermore, the clustering between Gfap and Osmr in Gfap-expressing (active) alleles was significantly higher than that in nonexpressing (inactive) alleles (p = 0.029) (Figure 3B). Next, we focused on cells with single active alleles of Gfap and identified a tendency toward higher incidence of association between active Gfap alleles and Osmr loci than between inactive Gfap alleles and Osmr loci, although this did not reach statistical significance (p = 0.112) (Figure 3C). Overall, however, these results indicate that gene clustering may contribute to the transcriptional activation of Gfap.
FIGURE 3:
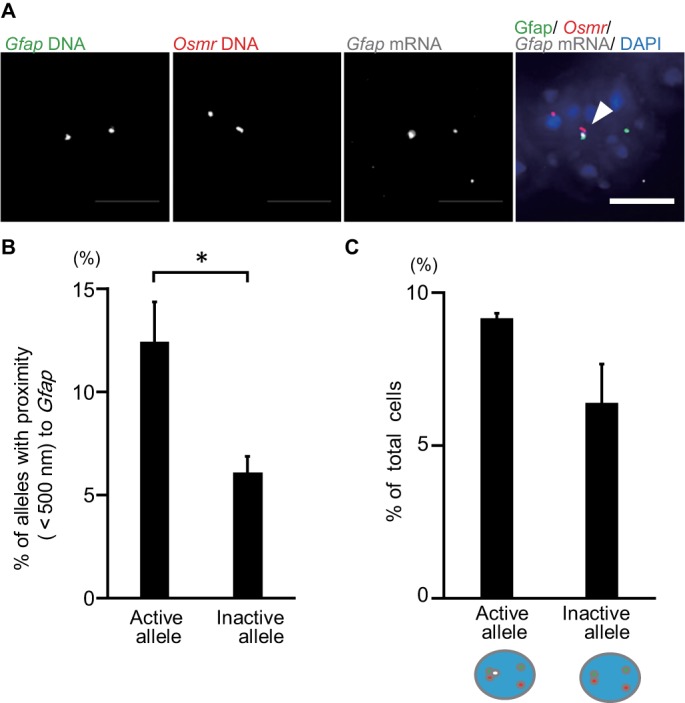
Gfap and Osmr gene clustering correlates with Gfap transcription in LIF-stimulated cells. (A) Projected images of triple-labeled RNA/DNA FISH in LIF-stimulated cells for Gfap DNA (green), Osmr DNA (red), and Gfap RNA (white). Nuclei were counterstained with DAPI (blue). Scale bar = 5 µm. Arrowhead indicates clustering alleles. (B) Clustering frequencies of Gfap active (transcribed) and inactive (not transcribed) alleles determined using RNA/DNA FISH for LIF-stimulated cells. Data represent the means ± SEM of three biological replicates (n = 72–74 for active alleles and 332–336 for inactive ones). Student’s t test was performed for statistical analysis. *p < 0.05. (C) Phenotypic analysis of cells with single active (transcribed) Gfap. Frequencies of cells with an active or inactive Gfap allele that clustered with Osmr were determined. Data are presented as the means ± SEM of three biological replicates (n = 54–55). Student’s t test was performed.
BRG1 and STAT3 are recruited to STAT3 recognition sites at Gfap and Osmr loci concurrent with gene clustering
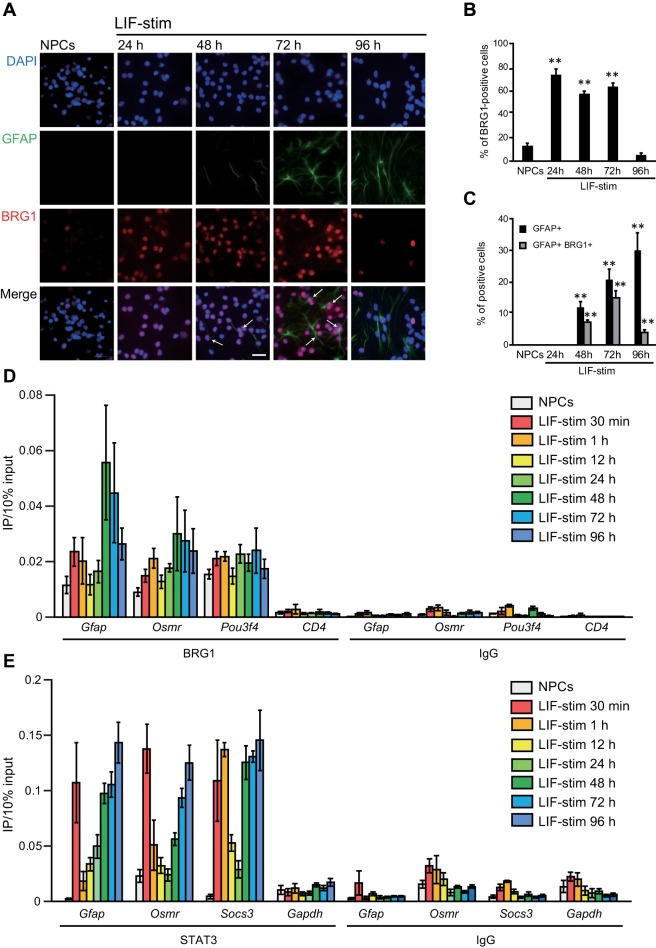
To elucidate the molecular mechanisms of Gfap and Osmr gene clustering, we focused on BRG1, as it mediates long-range interactions of transcriptional regulatory regions (Kim et al., 2009), as well as STAT3 recruitment (Ni and Bremner, 2007), and is involved in astrogenesis (Matsumoto et al., 2006). We first investigated the expression of BRG1 in NPCs at different time points. The ratio of BRG1-expressing cells to total cells was significantly increased from 24 to 72 h after LIF stimulation (NPCs: 12.4 ± 2.7%; LIF stimulation, 24 h: 72.5 ± 5.7%, p < 0.05; 48 h: 56.4 ± 3.0%, p < 0.05; 72 h: 62.7 ± 3.4%, p < 0.05; 96 h: 4.5 ± 2.2%, p > 0.05) (Figure 4, A and B). In addition, most GFAP-positive cells also expressed BRG1 at 48 and 72 h after LIF stimulation (NPCs: 0%; LIF stimulation, 24 h: 0%; 48 h: 7.2 ± 0.6%, p < 0.05; 72 h: 14.9 ± 2.2%, p < 0.05; 96 h: 3.9 ± 0.8%, p > 0.05) (Figure 4C).
FIGURE 4:
BRG1 and STAT3 are recruited to STAT3 binding sites (SBS) at Gfap and Osmr loci concurrent with gene clustering. (A) Expression of BRG1 in GFAP-positive cells. NPCs alone and stimulated with LIF for different periods of time (LIF-stim) were stained with an anti-GFAP antibody (green) and an anti-BRG1 antibody (red). Nuclei were counterstained with DAPI (blue). Scale bar = 20 µm. Arrows indicate BRG1/GFAP double-positive cells. (B) The number of BRG1-positive cells in total cells. (C) The number of GFAP-positive and GFAP/BRG1–double positive cells. (B, C) Data are presented as the means ± SEM from three biological replicates (n = 72–211). The Dunnett test was performed. **p < 0.01. (D) ChIP-qPCR for BRG1 at the SBS of Gfap and Osmr and at Pou3f4 (a positive control) and CD4 (a negative control) loci in NPCs alone and stimulated with LIF for different time periods (LIF-stim). Each graph represents the means (±SEM) of at least three experiments. (E) ChIP-qPCR for STAT3 at the SBS of Gfap and Osmr loci and for Socs3 (a positive control) and Gapdh (a negative control) in NPCs stimulated with LIF for different time periods (LIF-stim). Each graph represents the means (±SEM) of at least three experiments.
We then performed chromatin immunoprecipitation (ChIP) experiments to test for the binding of STAT3 and BRG1 at different time points after LIF stimulation to determine whether BRG1 also binds to Gfap and Osmr. We found that BRG1 could be detected at STAT3 binding sites (SBS) of both genes as well as at a known BRG1 binding gene, Pou3f4 (Ninkovic et al., 2013), as a positive control, without stimulation, and that the level of binding increased for Gfap and Osmr at later time points after stimulation, whereas binding was not detected at the negative control locus CD4 (Lessard et al., 2007; Figure 4D). In comparison, STAT3 binding to the SBS of Gfap and Osmr was transiently increased 30 min after LIF stimulation and peaked again at 48 h. The same phenomenon was observed at the SBS of Socs3, as a positive control (Figure 4E). In particular, STAT3 has been shown to be immediately phosphorylated by LIF stimulation and subsequently translocates to the nucleus to bind to its target genes (Levy and Darnell, 2002). The initial phosphorylation is transient, although under some conditions it is biphasic, which leads to a second wave of gene expression (Croker et al., 2003; Wormald et al., 2006; Wang et al., 2013). In our system, Western blot analyses showed that STAT3 phosphorylation in NPCs was induced immediately and was not biphasic; rather, it decreased, albeit with detectable levels even at later time points (from 48 to 96 h) (Supplemental Figure 1). These results suggest that the biphasic recruitment of STAT3 is due not to biphasic activation of JAK-STAT pathways, but to changes in chromatin accessibility. Consistent with this, the secondary peak of the recruitment was earlier than the peak transcriptional activation of Gfap and Osmr (Figure 2A), supporting the conclusion that the secondary recruitment is likely required for their expression.
Taken together, these results indicate that BRG1 is expressed in GFAP-expressing cells and that upon LIF stimulation it is recruited to Gfap and Osmr in a temporal manner similar to that for STAT3 to induce the transcription of both genes.
BRG1 and JAK-STAT signaling is required for the gene clustering of Gfap and Osmr
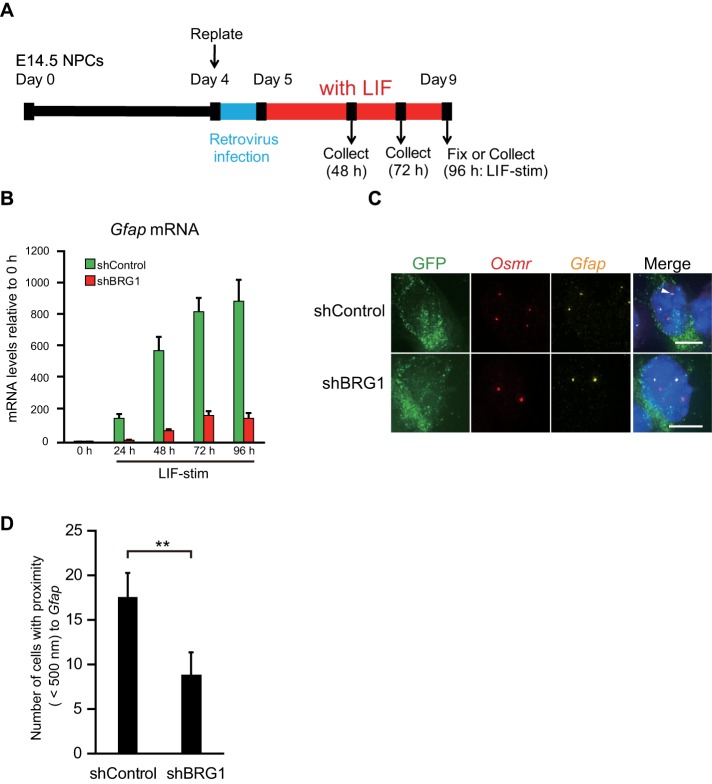
The coexpression of BRG1 and GFAP and the simultaneous binding of BRG1 and STAT3 to SBS of Gfap may indicate that BRG1 plays a role in Gfap transcriptional control and gene clustering. To determine whether BRG1 is required for Gfap expression, we knocked down BRG1 in NPCs using shRNA-retrovirus vectors (Figure 5A). The infection efficiency of the retrovirus in NPCs was 38.4 ± 7.96% for shControl and 24.8 ± 2.20% for shBRG1, respectively. Western blots indicated that BRG1 expression levels were decreased by shRNA for BRG1 at the protein level (Supplemental Figure 2, A and B). Gfap mRNA levels were also significantly decreased by BRG1 knockdown (Figure 5B). Notably, Gfap mRNA levels in BRG1 knockdown cells increased more rapidly after LIF stimulation than in cultures without viral infection (Figure 2A), which may be attributable in part to the longer in vitro culture period prior to LIF stimulation (by 1 d) required for the retrovirus infection (Figure 5A). We then determined the number of BRG1-positive cells in GFP-positive cells and found that the proportion of BRG1-positive cells in BRG1 knockdown cells (13.4 ± 1.93%) was significantly decreased compared with that in the control infection (47.7 ± 6.97%, p = 0.0012; Supplemental Figure 2, C and D). The percentage of GFAP-positive cells (38.1 ± 3.36%) in BRG1 knockdown cells was comparable to that in control cells (38.5 ± 4.34%; Figure 5), suggesting that BRG1 is required for transcriptional enhancement rather than initiation.
FIGURE 5:
BRG1 knockdown down-regulates Gfap and Osmr transcription and impairs gene clustering. (A) Scheme of cell culture and virus infection procedures. NPCs isolated from E14.5 mouse telencephalon were cultured and replated on day 4. Subsequently, the cells were infected with retroviruses that expressed EGFP alone (shControl) or EGFP together with shBRG1 and then cultured with LIF (50 ng/ml) for astrocyte differentiation. (B) Quantitative RT-PCR for Gfap mRNA in shControl- or shBRG1-treated NPCs alone or stimulated with LIF for different periods of time (LIF-stim). The results were normalized to Gapdh expression and described as fold induction relative to the levels at 0 h. Each graph represents the mean (±SEM) for the relative amount of NPCs in at least three experiments. (C) Projected images of double-labeled DNA FISH in GFP-positive (green) LIF-stimulated cells for Gfap (yellow) and Osmr (red). Nuclei were counterstained with DAPI (blue). Scale bar = 5 µm. Arrowheads indicate clustering alleles. (D) Clustering frequencies determined for Gfap and Osmr in LIF-stimulated cells expressing shControl or shBRG1. Data are presented as the means ± SEM from three biological replicates (n = 73–127). Student’s t test was performed. **p < 0.01.
We next performed DNA FISH to address whether gene clustering of Gfap and Osmr depends on BRG1. The number of BRG1 knockdown cells with close proximity of Gfap to Osmr was significantly smaller than that of the control cells (Figure 5, C and D). Additionally, no significant differences were observed in the frequencies of longer distances between the two genes in BRG1 knockdown cells (Supplemental Figure 2E). These results indicate that BRG1 is required for gene clustering of both adjacently located loci, whereas it does not affect loci separated by longer distances.
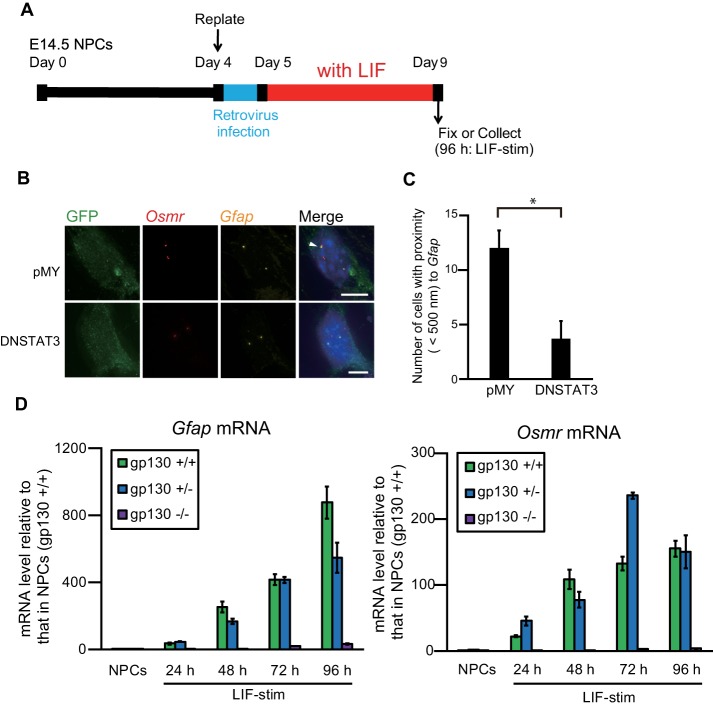
As BRG1 is known to be required for STAT3 recruitment and IL-6-induced expression at a subset of target genes (Ni and Bremner, 2007), we next sought a role of JAK-STAT signaling in gene clustering. LIF-stimulated cells were infected with a recombinant retrovirus engineered to express EGFP together with the dominant negative form of STAT3 (DN-STAT3) (Figure 6A), in which an amino acid substitution of tyrosine 705 to phenylalanine causes the modified protein to function as an inhibitory molecule against endogenous STAT3 (Kaptein et al., 1996; Minami et al., 1996). Specifically, the expression of DN-STAT3 inhibits the phosphorylation of endogenous STAT3 and thus its gene transactivation ability. As expected, the number of GFAP-positive cells was significantly decreased upon DN-STAT3 expression (Supplemental Figure 3, A and B), which is consistent with previous reports (Nakashima et al., 1999b; Takizawa et al., 2001). In addition, the frequency of clustering of Gfap and Osmr was significantly decreased in LIF-stimulated cells that expressed EGFP together with DN-STAT3 (Figure 6, B and C). In contrast, the overall distance between Gfap and Osmr was not affected by DN-STAT3 expression, which is consistent with the results following BRG1 knockdown (Supplemental Figures 2E and 3C).
FIGURE 6:
Inhibition of JAK-STAT signaling impairs the clustering of Gfap and Osmr and down-regulates their transcription. (A) Scheme of experimental procedures. NPCs isolated from E14.5 mouse telencephalon were cultured and replated on day 4. The cells were infected with retroviruses that express EGFP alone (pMY) or together with DN-STAT3, and then cultured with LIF (50 ng/ml) for 4 d to induce astrocyte differentiation. (B) Projected images of double-labeled DNA FISH for Gfap (yellow) and Osmr (red) in LIF-stimulated cells that were infected with recombinant retroviruses engineered to express EGFP alone (pMY) or together with DN-STAT3. Virus-infected cells were stained with an anti-GFP antibody (green). Nuclei were counterstained with DAPI (blue). Scale bar = 5 μm. Arrowheads indicate clustering alleles. (C) Clustering frequencies determined using DNA FISH for Gfap and Osmr in LIF-stimulated cells that were infected with retroviruses expressing EGFP alone (pMY) or together with DN-STAT3. Data are presented as the means ± SEM from three biological replicates (n = 53–54). Student’s t test was performed. *p < 0.05. (D) Quantitative RT-PCR of Gfap and Osmr mRNA in NPCs derived from gp130 +/+, +/−, and −/− mice, alone and stimulated with LIF for different periods of time (LIF-stim). The results were normalized to Gapdh expression. Each graph represents the means (±SEM) relative to the amounts in NPCs derived from gp130 +/+ mice from at least three experiments.
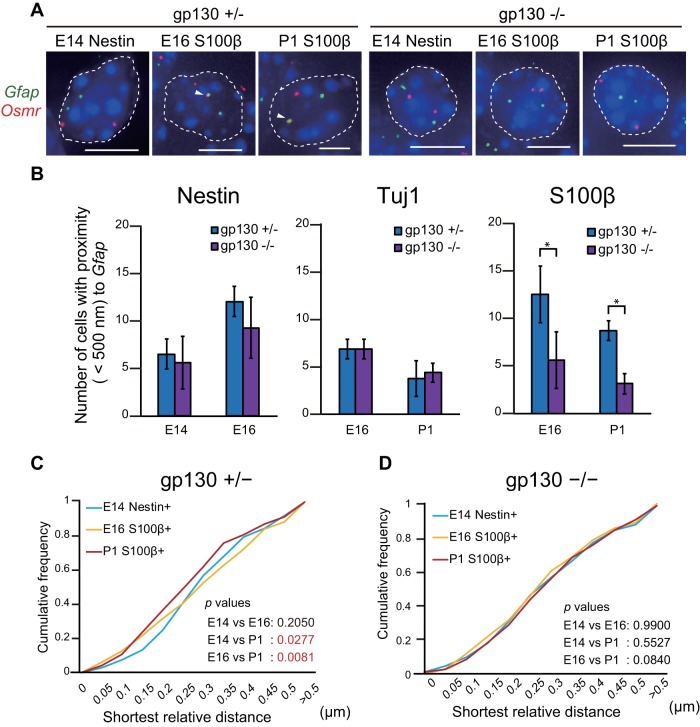
To further examine the mechanism of JAK-STAT pathway-mediated regulation of gene clustering, we examined gp130, a signal-transducing receptor component for LIF, which plays a pivotal role in LIF-mediated activation of the JAK-STAT pathway (Taga and Kishimoto, 1997). Notably, Gfap-expressing astrocytes are severely reduced in the brains of gp130 deficient mice (Yoshida et al., 1996; Nakashima et al., 1999a). In the current study, RT-qPCR using LIF-stimulated cells derived from gp130 knockout (KO) mice confirmed the decrease in mRNA levels of Gfap and Osmr (Figure 6D). We further performed DNA FISH with brain sections of gp130 KO mice (Figure 7A) using S100β as an astrocyte marker that initiates expression at earlier developmental stages than GFAP. In Nestin-positive cells, gene clustering was increased at E16 rather than at E14, whereas it decreased from E16 to P1 in the cells positive for the neuronal marker β-III Tubulin (Tuj1). In both cases, there was no significant difference between gp130 (+/−) and gp130 (−/−) (Figure 7B). In contrast, in S100β-positive cells, there was a significant increase in gene clustering at both E16 and P1 in gp130 (+/−) relative to gp130 (−/−). Furthermore, the distance distribution was significantly different between E14 Nestin–positive and P1 S100β–positive cells (Figure 7C), although such differences were not observed in gp130 (−/−) cells at the same stage (Figure 7D). Additionally, as we had normalized the shortest distance to the nuclear diameter (Supplemental Figure 4A), we could exclude the possibility that the changes in gene clustering could be attributed to different nuclear sizes in the cell types examined. These results demonstrate that the clustering of Gfap and Osmr is dependent on JAK-STAT pathway activation by gp130.
FIGURE 7:
Gene clustering of Gfap and Osmr is impaired in gp130 −/− mice. (A) Projected images of double-labeled DNA FISH for Gfap (green) and Osmr (red) in E14 Nestin-positive NPCs and in E16 and P1 S100β-positive astrocytes derived from gp130 +/− and −/− mice. Nuclei were counterstained with DAPI (blue). Scale bar = 5 μm. Arrowheads indicate clustering alleles. (B) Clustering frequencies determined using DNA FISH for Gfap and Osmr in E14 Nestin positive NPCs, E16 Nestin-, Tuj1-, and S100β- positive cells and P1 Tuj1- and S100β- positive cells derived from gp130 +/− and −/− mice. Data are presented as the means ± SEM from three biological replicates (n = 53–54). Student’s t test was performed. *p < 0.05. (C, D) Cumulative frequencies of interprobe distances between Gfap and Osmr in cells from gp130 +/− (C) and −/− (D) mice. The Kolmogorov–Smirnov (K–S) test was performed.
JAK-STAT signaling is required for BRG1 recruitment to STAT3 binding sites at Gfap and Osmr loci in concurrence with gene clustering
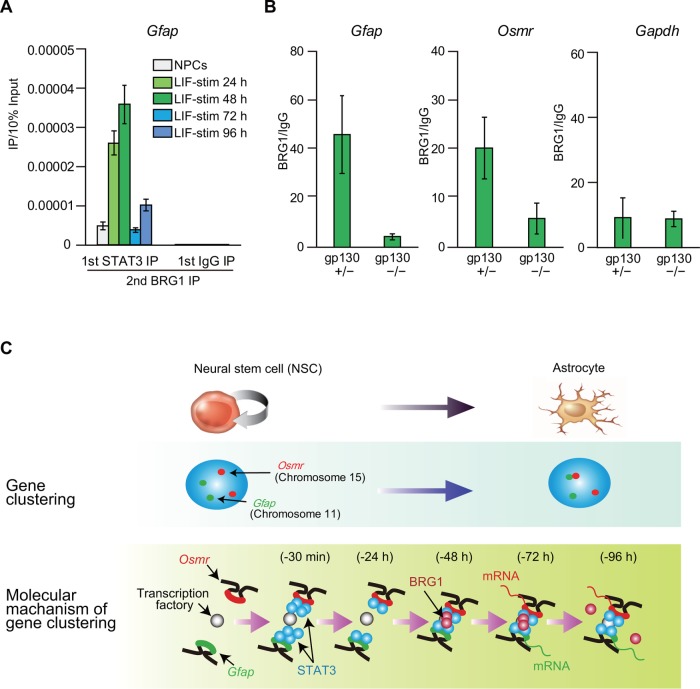
Re-ChIP analysis indicated that BRG1 and STAT3 are not only likely to coordinately mediate the gene clustering of Gfap and Osmr; they also bind to the same DNA fragments, including the SBS of the Gfap promoter region, concurrent with gene clustering (Figure 8A). In addition, the binding level of BRG1 to SBS of Gfap and Osmr decreased in LIF-stimulated cells (48 h) derived from gp130 KO (−/−) mice relative to cells derived from gp130 heterozygous (+/−) mice (Figure 8B). This is not due to reduced levels of BRG1 mRNA in gp130 KO (−/−) mice, because the expression levels were not different among gp130 mutants (Supplemental Figure 4B). These results indicate that JAK-STAT signaling is required for BRG1 recruitment to SBS and that BRG1 and STAT3 coordinately mediate gene clustering of Gfap and Osmr.
FIGURE 8:
JAK-STAT signaling is required for BRG1 recruitment to STAT3 binding sites (SBS) at Gfap and Osmr loci. (A) ChIP- and reChIP-qPCR for STAT3 and BRG1 at the SBS of Gfap in NPCs and cells stimulated with LIF for different periods of time (LIF-stim). Each graph represents the means (±SEM) of at least three experiments. (B) ChIP-qPCR for BRG1 on the SBS of Gfap, Osmr, and Gapdh (negative control) in cells stimulated with LIF for 48 h (LIF-stim 48 h). Each graph represents the means (±SEM) of at least three experiments. (C) Model depicting BRG1 as a mediator of gene clustering of Gfap and Osmr. BRG1 and STAT3 are recruited to the SBS of Gfap and Osmr within 48 h after LIF stimulation concurrent with BRG1- and STAT3-dependent Gfap and Osmr gene clustering. Transcription of both genes is enhanced after gene clustering (at 72–96 h after LIF stimulation).
DISCUSSION
In this report, we have demonstrated the significance and molecular mechanisms of Gfap and Osmr gene clustering during astrocyte differentiation. We found that clustering of these genes facilitates their transcriptional activation and that activation of the JAK-STAT signaling pathway and BRG1 recruitment are required for gene clustering and transcription.
BRG1 was originally identified as a component of chromatin-remodeling complexes that catalyze alterations in target gene chromatin structure via energy from ATP hydrolysis, resulting in transcriptional activation (Trotter and Archer, 2008). BRG1 has also been shown to bind to regulatory sequences throughout the genome and to organize chromatin looping and higher-order chromatin structure, which leads to gene expression in response to external stimuli (Euskirchen et al., 2011; Li et al., 2012). In the current study, we found that BRG1 is also required for gene clustering between Gfap and Osmr upon LIF stimulation (Figure 5, C and D). Furthermore, in addition to its demonstrated interaction with STAT3 in response to IL-6 stimulation in HepG2 and COS cells (Giraud et al., 2004; Ni and Bremner, 2007), the ChIP analyses presented here showed that BRG1 co-occupied the same Gfap gene locus with STAT3 in a gp130-dependent manner (Figure 8, A and B). As the binding of STAT3 to target genes has been shown to lead to acetylation of a core histone H3, subsequently triggering BRG1 recruitment (Giraud et al., 2004), the demonstration by ChIP analyses at different time points in the current study that STAT3 binds to both Gfap and Osmr in a biphasic manner (Figure 4E) suggested that the initial binding of STAT3 to Gfap and Osmr immediately after LIF stimulation might play a role in recruiting BRG1 by acetylating H3. Furthermore, although STAT3 recruits BRG1 to its target genes, STAT3 binding itself is facilitated by an undefined BRG1-containing complex (Ni and Bremner, 2007; Ho et al., 2011), and BRG1 has been shown to increase chromatin accessibility at STAT3 target genes in mouse embryonic stem cells (Ho et al., 2011). These findings suggest that BRG1 is central to rendering chromatin at the SBS of Gfap and Osmr loci accessible to STAT3. These observations led us to propose a model in which STAT3 and BRG1 recruitment are interdependent (Figure 8C).
In the current study, Osmr was selected from among the genes that we identified as being clustered with Gfap and expressed in NPC-derived astrocytes in our previous report (Ito et al., 2016) because it is expressed at a measurable level in NPC-derived astrocytes and is known to be important for astrocyte differentiation. A key remaining question is whether the clustering of Gfap with the other identified genes is also regulated by the same mechanism that determines Osmr and Gfap clustering. The requirement of BRG1 for STAT3 recruitment and IL-6-induced expression at only a subset of target genes (Ni and Bremner, 2007) raises the possibility that not all of the previously identified genes are clustered with Gfap via the same mechanisms. Consistent with this supposition, we have already shown that at least the two identified genes were not clustered with Gfap simultaneously (Ito et al., 2016), suggesting that the mechanism of clustering proposed in the current study may not function in a deterministic manner. This interpretation is in line with the finding based on high-throughput imaging position mapping (HIPMap) that factors involved in genome organization affect only a subset of target loci, indicating that their effects are not global (Shachar et al., 2015). Therefore, it will likely be necessary to establish the detailed clustering mechanisms of each identified gene to determine factors important for astrogenesis.
The IL-6/gp130 family of cytokines (e.g., IL-6, IL-11, LIF, and OSM) play important roles in the development and repair of the CNS (Gadient and Patterson, 1999; Turnley and Bartlett, 2000). In mice, the OSM signals through the formation of a heterodimeric complex composed of gp130 and OSMR (Ichihara et al., 1997; Morikawa, 2005). OSM and its receptor components (OSMR and gp130) are expressed in NPCs, and OSM is significant for astrocyte differentiation in the developing brain through the activation of STAT3 (Yanagisawa et al., 1999). In the current study, we found that the expression level of OSMR was increased in undifferentiated NPCs by LIF stimulation (Figure 2A) as well as in primary astrocytes, although its expression was not affected in microglia by stimulation with either OSM, HIL-6, or LIF (Hsu et al., 2015). These observations indicate that astrocytes represent a major target for OSM actions in the CNS, in accordance with the observation that OSM inhibits the proliferation of adult NPCs and induces IL-6 expression in astrocytes (Van Wagoner et al., 2000; Beatus et al., 2011). Thus, the gene clustering between Gfap and Osmr and the resulting transcriptional enhancement of these genes after LIF stimulation as shown in the present study likely play a central role in the differentiation program of astrocytes. Our current results provide a novel piece of evidence for the mechanisms underlying neural cell differentiation and interchromosomal gene clustering and further insights into brain development.
MATERIALS AND METHODS
Animals and cell culture
NPCs were prepared from the telencephala of pregnant ICR mice, purchased from Japan SLC, or those of gp130-deficient mice (ICR.129-Il6st, obtained from the Center for Animal Resources and Development Database at Kumamoto University; Yoshida et al., 1996) at E14.5, and cultured as previously described (Takizawa et al., 2001). Briefly, timed pregnant ICR mice were killed using cervical dislocation; the brains were carefully dissected out and the telencephala were obtained. The telencephala were then triturated in Hanks’ balanced salt solution by gently pipetting with 1-ml pipette tips. Dissociated cells were cultured in N2-supplemented DMEM with F12 containing 10 ng/ml basic fibroblast growth factor (bFGF; R&D Systems) on culture dishes (Corning) that were precoated with poly-l-ornithine and fibronectin (Sigma-Aldrich). For astrocyte differentiation, the cells were replated on fibronectin/poly-l-lysine–coated glass coverslips (MATSUNAMI) or culture dishes that were precoated with poly-l-ornithine and fibronectin after 4 d of culture and were stimulated for 4 d in the presence of LIF (50 ng/ml; Millipore). All animal procedures were conducted with the approval of the Gunma University Animal Care and Use Committee and were in full compliance with the Committee’s guidelines.
Immunohistochemistry and immunocytochemistry
For immunohistochemistry, mouse embryos were fixed in a 4% paraformaldehyde (PFA) in phosphate-buffered saline (PBS) solution for 24 h and subsequently submerged in PBS containing 20% sucrose at 4°C for 24 h. The tissue was cut into 10-μm-thick sections using a cryostat (Leica). For immunocytochemistry, cells cultured on coated glass coverslips were fixed in 4% PFA in PBS and washed with PBS as described previously (Takizawa et al., 2008). A mouse monoclonal antibody (mAb) against GFAP (Sigma, #G-6171; 1:400), a rabbit mAb against BRG1 (Abcam, #ab110641; 1:400), and a chicken polyclonal antibody against GFP (Aves Lab, #GFP-1020; 1:200) were used as primary antibodies. Alexa 488-, Alexa 555-, or Alexa 647-conjugated secondary antibodies (Invitrogen; 1:400) were used for visualization. For simultaneous labeling experiments, immunostaining was performed after FISH.
Fluorescence in situ hybridization
Probes for DNA FISH were generated by nick translation of BAC clones (BACPAC Resources) covering the Gfap (RP24–155G1) or Osmr (RP23–198P20) genes. FISH was essentially performed as described previously (Takizawa et al., 2008). Briefly, cells were fixed with 4% PFA and stored in PBS at 4°C until use. The cells were permeabilized with 0.5% Triton X-100/PBS and treated for 10 min with 0.1 N HCl. Cells were then held for 30 min at room temperature in 50% formamide with 2 × SSC and denatured for 10 min at 85°C. Hybridization was performed overnight at 37°C with dinitrophenyl (DNP) or digoxigenin (DIG) or biotin- labeled probes and detected with Alexa 488-conjugated anti-DNP (Invitrogen), rhodamine-conjugated anti-DIG antibody (Roche), or Alexa 647-conjugated streptavidin (Invitrogen). For Gfap RNA FISH, the Gfap exonic sequence was amplified using a GFAP expression vector (pcDNA3-mGF) as a template and transcribed in vitro, and then the RNA was further reverse-transcribed with biotin-labeled dUTP (Invitrogen). The single-strand biotin-cDNA probe was used for Gfap mRNA detection. Cells were fixed with 4% PFA containing 10% acetic acid and stored in 70% EtOH at −30°C until use. The ssDNA probe against Gfap cDNA was hybridized after cytoplasm digestion with 0.05% pepsin/0.01N HCl and dehydration through an ethanol gradient. RNA was detected with Alexa598-conjugated tyramide using the TSA kit (Invitrogen) and DNA FISH was performed following RNase treatment.
Microscopy and image analysis
A DeltaVision microscope (CORNES Technologies) was used to analyze the results of DNA FISH. We obtained three-dimensional images from serial Z-sections of thickness 8.0 μm at 0.1-μm intervals. For clustering analysis, the shortest distances between two FISH signals were examined by softWoRx Explorer1.3 (Applied Precision). For in vivo clustering analysis, the shortest distances were normalized by average nuclear diameters. Genes were considered associated when they were positioned within 500 nm of Gfap.
Quantitative RT-PCR
Total RNAs were extracted using the ToTALLY RNA total RNA isolation kit and then treated with DNaseI (Life Technologies). cDNAs were synthesized from 2 μg total RNA using Superscript II (Life Technologies). Quantitative RT-PCR (RT-qPCR) was performed using an Applied Biosystems 7900HT fast real-time PCR system (Life Technologies) with the KAPA SYBR fast qPCR kit (Kapa Biosystems). The PCR protocol consisted of initial activation at 95°C for 3 min followed by 40 cycles at 95°C for 15 s and at 60°C for 34 s. Expression of the target genes was normalized to that of glyceraldehyde-3-phosphate dehydrogenase (Gapdh). Primer sequences are listed in Supplemental Table 1.
Chromatin immunoprecipitation (ChIP) and re-ChIP assay
For STAT3 ChIP and re-ChIP analyses, cells were cross-linked using 1% formaldehyde for 5 min at room temperature. For the BRG1 ChIP assay, cells were cross-linked using 1% formaldehyde for 15 min at room temperature. The ChIP assay was basically performed as described (Sailaja et al., 2012). Cells were prepared by incubation and Dounce homogenization in Swelling buffer (25 M HEPES [pH 7.8], 1.5 mM MgCl2, 10 mM KCl, 0.1% NP-40, 1 mM dithiothreitol [DTT], 0.5 mM phenylmethylsulfonyl fluoride [PMSF], and 100 μM protease inhibitor cocktail [Nacalai Tesque]) after cross-linking and were lysed and sonicated in 1% SDS-containing sonication buffer (50 mM HEPES [pH 8.0], 140 mM NaCl, 1 mM EDTA, 1% Triton X-100, 0.1% Na deoxycholate, and 1% SDS) and diluted 10-fold using SDS (−) sonication buffer prior to immunoprecipitation. Following initial overnight immunoprecipitation, the re-ChIP assay was performed as described by Truax and Greer (2012). The following antibodies were used: rabbit anti-STAT3 (Santa Cruz #sc-482X; 2 μg), rabbit anti-BRG1 (Abcam, #ab110641; 1 μg), and rabbit normal IgG (Santa Cruz#sc-2027; 2 μg (for STAT3 ChIP) or 1 μg (for BRG1 ChIP). Primer sequences are listed in Supplemental Table 1.
Recombinant retrovirus construction and infection
A dominant negative form of STAT3 (DN-STAT3) carrying a Y705F substitution was cloned into the expression vector pMY, which contains an internal ribosome entry site followed by the region upstream of the EGFP gene (Morita et al., 2000). ShControl and shBRG1 (Shi et al., 2013) were prepared with LMN shRNA retroviral vectors (MSCV-miR30-shRNA-PGKp-NeoR-IRES-GFP). The Plat-E packaging cell line was transiently transfected with the retrovirus DNA using the PEI Max transfection regent (Polysciences; Morita et al., 2000). On the following day, the culture medium used for transfection was replaced with N2/DMEM/bFGF and the cells were cultured for an additional 1 d. The resultant medium containing viruses was collected and centrifuged at 6000 × g for 16 h, and the supernatant was added to E14.5 NPCs that had been cultured for 1 d. On the following day, cells were cultured in N2/DMEM/bFGF.
Immunoblotting
Cells were lysed using NP40 lysis buffer (1% NP-40, 50 mM Tris-HCl [pH 7.5], 150 mM NaCl, 5 mM EDTA, 0.2% SDS, and 100 μM protease inhibitor cocktail [Nacalai Tesque]). Lysates were subjected to SDS–PAGE and subsequent immunoblotting. The following antibodies were used: rabbit anti-STAT3 (Santa Cruz, #sc-482; 1:2000), rabbit anti-tyrosine-phosphorylated STAT3 (Cell Signaling Technology, #9145; 1:2000), rabbit anti-BRG1 (Abcam, #ab110641; 1:2500), and rabbit anti-β-Actin (MBL, #PM053–7; 1:2000). Band intensities were quantified by ImageJ software (National Institutes of Health).
Statistical analyses
To calculate p values, the analysis of variance (ANOVA) with Fisher’s latest significant difference (LSD) post hoc test, Dunnett’s test, Student’s t test for parametric analyses, and the Steel test and Mann–Whitney U test for nonparametric analyses were used as indicated in the figure legends. Fisher’s exact test and the Kolmogorov–Smirnov (K-S) test were also employed. All of the statistical analyses were performed using R (Core Team R, 2013) or Excel software (Microsoft).
Supplementary Material
Acknowledgments
We thank T. Kitamura (Tokyo University) for the pMY vector and Plat-E cells. We also thank C. R. Vakoc (Cold Spring Harbor Laboratory) for kindly providing shControl and shBRG1 retroviral vectors. We also thank all members of the Department of Pediatrics for their critical help and advice. This work was supported by Japan Society for the Promotion of Science Grant-in-Aid for Scientific Research on Innovative Areas JP23114714 and a grant from the JST Strategic International Research Cooperative Program, SICP.
Abbreviations used:
- BRG1
brahma-related gene 1
- FISH
fluorescence in situ hybridization
- Gfap
glial fibrillary acidic protein
- NPCs
neural precursor cells
- Osmr
oncostatin M receptor.
Footnotes
This article was published online ahead of print in MBoC in Press (http://www.molbiolcell.org/cgi/doi/10.1091/mbc.E17-05-0271) on November 15, 2017.
REFERENCES
- Beatus P, Jhaveri DJ, Walker TL, Lucas PG, Rietze RL, Cooper HM, Morikawa Y, Bartlett PF. Oncostatin M regulates neural precursor activity in the adult brain. Dev Neurobiol. 2011;71:619–633. doi: 10.1002/dneu.20871. [DOI] [PubMed] [Google Scholar]
- Core Team R. R: A Language and Environment for Statistical Computing. Vienna: 2013. R Foundation for Statistical Computing. [Google Scholar]
- Cremer T, Cremer M. Chromosome territories. Cold Spring Harb Perspect Biol. 2010;2:a003889. doi: 10.1101/cshperspect.a003889. [DOI] [PMC free article] [PubMed] [Google Scholar]
- Croker BA, Krebs DL, Zhang JG, Wormald S, Willson TA, Stanley EG, Robb L, Greenhalgh CJ, Förster I, Clausen BE, et al. SOCS3 negatively regulates IL-6 signaling in vivo. Nat Immunol. 2003;4:540–545. doi: 10.1038/ni931. [DOI] [PubMed] [Google Scholar]
- Euskirchen GM, Auerbach RK, Davidov E, Gianoulis TA, Zhong G, Rozowsky J, Bhardwaj N, Gerstein MB, Snyder M. Diverse roles and interactions of the SWI/SNF chromatin remodeling complex revealed using global approaches. PLoS Genet. 2011;7:e1002008. doi: 10.1371/journal.pgen.1002008. [DOI] [PMC free article] [PubMed] [Google Scholar]
- Fullwood MJ, Liu MH, Pan YF, Liu J, Xu H, Mohamed YB, Orlov YL, Velkov S, Ho A, Mei PH, et al. An oestrogen-receptor-alpha-bound human chromatin interactome. Nature. 2009;462:58–64. doi: 10.1038/nature08497. [DOI] [PMC free article] [PubMed] [Google Scholar]
- Gadient RA, Patterson PH. Leukemia inhibitory factor, Interleukin 6, and other cytokines using the GP130 transducing receptor: roles in inflammation and injury. Stem Cells. 1999;17:127–137. doi: 10.1002/stem.170127. [DOI] [PubMed] [Google Scholar]
- Giraud S, Hurlstone A, Avril S, Coqueret O. Implication of BRG1 and cdk9 in the STAT3-mediated activation of the p21waf1 gene. Oncogene. 2004;23:7391–7398. doi: 10.1038/sj.onc.1207972. [DOI] [PubMed] [Google Scholar]
- Ho L, Miller EL, Ronan JL, Ho WQ, Jothi R, Crabtree GR. esBAF facilitates pluripotency by conditioning the genome for LIF/STAT3 signalling and by regulating polycomb function. Nat Cell Biol. 2011;13:903–913. doi: 10.1038/ncb2285. [DOI] [PMC free article] [PubMed] [Google Scholar]
- Hsu MP, Frausto R, Rose-John S, Campbell IL. Analysis of IL-6/gp130 family receptor expression reveals that in contrast to astroglia, microglia lack the oncostatin M receptor and functional responses to oncostatin M. Glia. 2015;63:132–141. doi: 10.1002/glia.22739. [DOI] [PubMed] [Google Scholar]
- Ichihara M, Hara T, Kim H, Murate T, Miyajima A. Oncostatin M and leukemia inhibitory factor do not use the same functional receptor in mice. Blood. 1997;90:165–173. [PubMed] [Google Scholar]
- Ito K, Sanosaka T, Igarashi K, Ideta-Otsuka M, Aizawa A, Uosaki Y, Noguchi A, Arakawa H, Nakashima K, Takizawa T. Identification of genes associated with the astrocyte-specific gene Gfap during astrocyte differentiation. Sci Rep. 2016;6:23903. doi: 10.1038/srep23903. [DOI] [PMC free article] [PubMed] [Google Scholar]
- Kaptein A, Paillard V, Saunders M. Dominant negative stat3 mutant inhibits interleukin-6-induced Jak-STAT signal transduction. J Biol Chem. 1996;271:5961–5964. doi: 10.1074/jbc.271.11.5961. [DOI] [PubMed] [Google Scholar]
- Kim SI, Bultman SJ, Kiefer CM, Dean A, Bresnick EH. BRG1 requirement for long-range interaction of a locus control region with a downstream promoter. Proc Natl Acad Sci USA. 2009;106:2259–2264. doi: 10.1073/pnas.0806420106. [DOI] [PMC free article] [PubMed] [Google Scholar]
- Lessard J, Wu JI, Ranish JA, Wan M, Winslow MM, Staahl BT, Wu H, Aebersold R, Graef IA, Crabtree GR. An essential switch in subunit composition of a chromatin remodeling complex during neural development. Neuron. 2007;55:201–215. doi: 10.1016/j.neuron.2007.06.019. [DOI] [PMC free article] [PubMed] [Google Scholar]
- Levy DE, Darnell JE., Jr Stats: transcriptional control and biological impact. Nat Rev Mol Cell Biol. 2002;3:651–662. doi: 10.1038/nrm909. [DOI] [PubMed] [Google Scholar]
- Li G, Ruan X, Auerbach RK, Sandhu KS, Zheng M, Wang P, Poh HM, Goh Y, Lim J, Zhang J, et al. Extensive promoter-centered chromatin interactions provide a topological basis for transcription regulation. Cell. 2012;148:84–98. doi: 10.1016/j.cell.2011.12.014. [DOI] [PMC free article] [PubMed] [Google Scholar]
- Matsumoto S, Banine F, Struve J, Xing R, Adams C, Liu Y, Metzger D, Chambon P, Rao MS, Sherman LS. Brg1 is required for murine neural stem cell maintenance and gliogenesis. Dev Biol. 2006;289:372–383. doi: 10.1016/j.ydbio.2005.10.044. [DOI] [PubMed] [Google Scholar]
- Minami M, Inoue M, Wei S, Takeda K, Matsumoto M, Kishimoto T, Akira S. STAT3 activation is a critical step in gp130-mediated terminal differentiation and growth arrest of a myeloid cell line. Proc Natl Acad Sci USA. 1996;93:3963–3966. doi: 10.1073/pnas.93.9.3963. [DOI] [PMC free article] [PubMed] [Google Scholar]
- Morikawa Y. Oncostatin M in the development of the nervous system. Anat Sci Int. 2005;80:53–59. doi: 10.1111/j.1447-073x.2005.00100.x. [DOI] [PubMed] [Google Scholar]
- Morita S, Kojima T, Kitamura T. Plat-E: an efficient and stable system for transient packaging of retroviruses. Gene Ther. 2000;7:1063–1066. doi: 10.1038/sj.gt.3301206. [DOI] [PubMed] [Google Scholar]
- Nakashima K, Wiese S, Yanagisawa M, Arakawa H, Kimura N, Hisatsune T, Yoshida K, Kishimoto T, Sendtner M, Taga T. Developmental requirement of gp130 signaling in neuronal survival and astrocyte differentiation. J Neurosci. 1999a;19:5429–5434. doi: 10.1523/JNEUROSCI.19-13-05429.1999. [DOI] [PMC free article] [PubMed] [Google Scholar]
- Nakashima K, Yanagisawa M, Arakawa H, Kimura N, Hisatsune T, Kawabata M, Miyazono K, Taga T. Synergistic signaling in fetal brain by STAT3-Smad1 complex bridged by p300. Science. 1999b;284:479–482. doi: 10.1126/science.284.5413.479. [DOI] [PubMed] [Google Scholar]
- Ni Z, Bremner R. Brahma-related gene 1-dependent STAT3 recruitment at IL-6-inducible genes. J Immunol. 2007;178:345–351. doi: 10.4049/jimmunol.178.1.345. [DOI] [PubMed] [Google Scholar]
- Ninkovic J, Steiner-Mezzadri A, Jawerka M, Akinci U, Masserdotti G, Petricca S, Fischer J, von Holst A, Beckers J, Lie CD, et al. The BAF complex interacts with Pax6 in adult neural progenitors to establish a neurogenic cross-regulatory transcriptional network. Cell Stem Cell. 2013;13:403–418. doi: 10.1016/j.stem.2013.07.002. [DOI] [PMC free article] [PubMed] [Google Scholar]
- Sailaja BS, Takizawa T, Meshorer E. Chromatin immunoprecipitation in mouse hippocampal cells and tissues. Methods Mol Biol. 2012;809:353–364. doi: 10.1007/978-1-61779-376-9_24. [DOI] [PubMed] [Google Scholar]
- Schoenfelder S, Sexton T, Chakalova L, Cope NF, Horton A, Andrews S, Kurukuti S, Mitchell JA, Umlauf D, Dimitrova DS, et al. Preferential associations between co-regulated genes reveal a transcriptional interactome in erythroid cells. Nat Genet. 2010;42:53–61. doi: 10.1038/ng.496. [DOI] [PMC free article] [PubMed] [Google Scholar]
- Shachar S, Voss TC, Pegoraro G, Sciascia N, Misteli T. Identification of gene positioning factors using high-throughput imaging mapping. Cell. 2015;162:911–923. doi: 10.1016/j.cell.2015.07.035. [DOI] [PMC free article] [PubMed] [Google Scholar]
- Shi J, Whyte WA, Zepeda-Mendoza CJ, Milazzo JP, Shen C, Roe JS, Minder JL, Mercan F, Wang E, Eckersley-Maslin MA, et al. Role of SWI/SNF in acute leukemia maintenance and enhancer-mediated Myc regulation. Genes Dev. 2013;27:2648–2662. doi: 10.1101/gad.232710.113. [DOI] [PMC free article] [PubMed] [Google Scholar]
- Taga T, Kishimoto T. Gp130 and the interleukin-6 family of cytokines. Annu Rev Immunol. 1997;15:797–819. doi: 10.1146/annurev.immunol.15.1.797. [DOI] [PubMed] [Google Scholar]
- Takizawa T, Gudla PR, Guo L, Lockett S, Misteli T. Allele-specific nuclear positioning of the monoallelically expressed astrocyte marker GFAP. Genes Dev. 2008;22:489–498. doi: 10.1101/gad.1634608. [DOI] [PMC free article] [PubMed] [Google Scholar]
- Takizawa T, Nakashima K, Namihira M, Ochiai W, Uemura A, Yanagisawa M, Fujita N, Nakao M, Taga T. DNA methylation is a critical cell-intrinsic determinant of astrocyte differentiation in the fetal brain. Dev Cell. 2001;1:749–758. doi: 10.1016/s1534-5807(01)00101-0. [DOI] [PubMed] [Google Scholar]
- Tiffen PG, Omidvar N, Marquez-Almuina N, Croston D, Watson CJ, Clarkson RW. A dual role for oncostatin M signaling in the differentiation and death of mammary epithelial cells in vivo. Mol Endocrinol. 2008;22:2677–2688. doi: 10.1210/me.2008-0097. [DOI] [PMC free article] [PubMed] [Google Scholar]
- Trotter KW, Archer TK. The BRG1 transcriptional coregulator. Nucl Recept Signal. 2008;6:e004. doi: 10.1621/nrs.06004. [DOI] [PMC free article] [PubMed] [Google Scholar]
- Truax AD, Greer SF. ChIP and Re-ChIP assays: investigating interactions between regulatory proteins, histone modifications, and the DNA sequences to which they bind. Methods Mol Biol. 2012;809:175–188. doi: 10.1007/978-1-61779-376-9_12. [DOI] [PubMed] [Google Scholar]
- Turnley AM, Bartlett PF. Cytokines that signal through the leukemia inhibitory factor receptor-beta complex in the nervous system. J Neurochem. 2000;74:889–899. doi: 10.1046/j.1471-4159.2000.0740889.x. [DOI] [PubMed] [Google Scholar]
- Van Wagoner NJ, Choi C, Repovic P, Benveniste EN. Oncostatin M regulation of interleukin-6 expression in astrocytes: biphasic regulation involving the mitogen-activated protein kinases ERK1/2 and p38. J Neurochem. 2000;75:563–575. doi: 10.1046/j.1471-4159.2000.0750563.x. [DOI] [PubMed] [Google Scholar]
- Wang Y, van Boxel-Dezaire AH, Cheon H, Yang J, Stark GR. STAT3 activation in response to IL-6 is prolonged by the binding of IL-6 receptor to EGF receptor. Proc Natl Acad Sci USA. 2013;110:16975–16980. doi: 10.1073/pnas.1315862110. [DOI] [PMC free article] [PubMed] [Google Scholar]
- Wei Z, Gao F, Kim S, Yang H, Lyu J, An W, Wang K, Lu W. Klf4 organizes long-range chromosomal interactions with the oct4 locus in reprogramming and pluripotency. Cell Stem Cell. 2013;13:36–47. doi: 10.1016/j.stem.2013.05.010. [DOI] [PubMed] [Google Scholar]
- Williamson I, Berlivet S, Eskeland R, Boyle S, Illingworth RS, Paquette D, Dostie J, Bickmore WA. Spatial genome organization: contrasting views from chromosome conformation capture and fluorescence in situ hybridization. Genes Dev. 2014;28:2778–2791. doi: 10.1101/gad.251694.114. [DOI] [PMC free article] [PubMed] [Google Scholar]
- Wormald S, Zhang JG, Krebs DL, Mielke LA, Silver J, Alexander WS, Speed TP, Nicola NA, Hilton DJ. The comparative roles of suppressor of cytokine signaling-1 and -3 in the inhibition and desensitization of cytokine signaling. J Biol Chem. 2006;281:11135–11143. doi: 10.1074/jbc.M509595200. [DOI] [PubMed] [Google Scholar]
- Yanagisawa M, Nakashima K, Taga T. STAT3-mediated astrocyte differentiation from mouse fetal neuroepithelial cells by mouse oncostatin M. Neurosci Lett. 1999;269:169–172. doi: 10.1016/s0304-3940(99)00447-4. [DOI] [PubMed] [Google Scholar]
- Yoshida K, Taga T, Saito M, Suematsu S, Kumanogoh A, Tanaka T, Fujiwara H, Hirata M, Yamagami T, Nakahata T, et al. Targeted disruption of gp130, a common signal transducer for the interleukin 6 family of cytokines, leads to myocardial and hematological disorders. Proc Natl Acad Sci USA. 1996;93:407–411. doi: 10.1073/pnas.93.1.407. [DOI] [PMC free article] [PubMed] [Google Scholar]
Associated Data
This section collects any data citations, data availability statements, or supplementary materials included in this article.


