Abstract
Exercise alone is often ineffective for treating obesity despite the associated increase in metabolic requirements. Decreased nonexercise physical activity has been implicated in this resistance to weight loss, but the mechanisms responsible are unclear. We quantified the metabolic cost of nonexercise activity, or “off-wheel” activity (OWA), and voluntary wheel running (VWR) and examined whether changes in OWA during VWR altered energy balance in chow-fed C57BL/6J mice (n = 12). Energy expenditure (EE), energy intake, and behavior (VWR and OWA) were continuously monitored for 4 days with locked running wheels followed by 9 days with unlocked running wheels. Unlocking the running wheels increased EE as a function of VWR distance. The metabolic cost of exercise (kcal/m traveled) decreased with increasing VWR speed. Unlocking the wheel led to a negative energy balance but also decreased OWA, which was predicted to mitigate the expected change in energy balance by ∼45%. A novel behavioral circuit involved repeated bouts of VWR, and roaming was discovered and represented novel predictors of VWR behavior. The integrated analysis described here reveals that the weight loss effects of voluntary exercise can be countered by a reduction in nonexercise activity.
Introduction
Physical exercise alone generally fails to result in meaningful weight loss in obese populations (1,2). Similarly, numerous reports suggest that the same is true regarding the effectiveness of voluntary wheel running (VWR) for inducing weight loss in mice (3–5). The ineffectiveness of voluntary exercise for weight loss is, at least in part, due to compensatory feedback mechanisms that counterbalance increased energy expenditure (EE) and preserve energy balance. Chronic compensation to exercise (>2 weeks) includes increased food intake (6,7), reduced resting metabolic rate (8–10), and decreased nonexercise physical activity (11). Acute compensation to exercise (<2 weeks) in mice can be independent of increased food intake (12), suggesting that a decline in nonexercise physical activity may help offset exercise-induced EE in accordance with a “constrained” model of EE (13). Indeed, mice engaged in VWR have decreased nonexercise physical activity, termed off-wheel activity (OWA) (14–16). The metabolic impact of decreased OWA with VWR has not been previously reported.
There are limited data regarding the contributions of VWR and OWA to EE in mice. This is because VWR and OWA are voluntary and typically are performed at low to moderate intensity, thus requiring sensitive instrumentation to detect an increase in EE (17). Only one report to date (18) has demonstrated an acute (within minutes) effect of VWR on EE and was performed in outbred deer mice. O’Neal et al. (14) were able to detect a contribution of VWR to the daily energy budget in male C57 mice during a short-duration (3 days) study and observed a diminishing contribution of VWR to EE during a longer-duration (21 days) study. Surprisingly, however, the increase in EE from VWR observed by O’Neal et al. (14) during their chronic study was not positively correlated with VWR distance. Brown et al. (19) observed a distance-dependent increase in daily Vo2 in female C57BL/6N mice, but a caveat to this study is that female mice run much farther than male mice (20). Although a few studies have directly measured EE during VWR, no studies to date have been able to detect the independent contribution of OWA to EE (21); thus, potential interactions between VWR and OWA and their impact on EE and energy balance have not been addressed.
There is significant variability in voluntary physical activity patterns in mice, even within an inbred strain (14). Skeletal muscle (SkM) mitochondria are the primary source of ATP during low- to moderate-intensity exercise, and exercise training has been shown to improve SkM mitochondrial efficiency (22). Recent work (23) has revealed that muscle mitochondrial efficiency also acutely increases as a function of metabolic demand, suggesting that this variable may be a novel factor explaining differences in VWR behavior between mice.
The purpose of the studies described here was to combine indirect calorimetry, context-specific behavioral mapping, and mitochondrial energetics in C57BL/6J mice to 1) quantify the metabolic contributions of VWR and OWA to EE, 2) examine whether reduced OWA is a mechanism to preserve energy balance in response to VWR, and 3) identify behavioral and metabolic factors that explain variance in VWR between mice.
Research Design and Methods
Animal Housing and Study Design
Vanderbilt University Animal Care and Use Committee approved all experiments. Twelve-week-old male C57BL/6J mice (n = 12) were purchased from The Jackson Laboratory and were housed in the Vanderbilt University Mouse Metabolic Phenotyping Center. Mice were singly housed starting at 15 weeks of age. Indirect calorimetry studies were performed from 19 to 21 weeks of age. At 23 weeks of age, after a 4-h fast and under isoflurane inhalation, the red gastrocnemius muscle was excised for mitochondrial energetics assays.
Indirect Calorimetry and Voluntary Physical Activity Behavior
Mice were singly housed in a Promethion Metabolic Analyzer (Sable Systems, North Las Vegas, NV) at ambient temperature (20–22°C). Cages contained Pure-O’Cel Bedding (The Andersons Inc., Maumee, OH), and mice had ad libitum access to 5L0D chow diet (LabDiet, St. Louis, MO) and water throughout the study. Running wheels were present for the entire time period, but were locked for the first 4 days. O2 and CO2 were continuously monitored for assessment of EE. Mouse cage behavior, including roaming (XYZ beam breaks), food and water intake, and VWR were monitored continuously with second-to-second resolution. Contextual behavioral mapping was achieved by integrating XYZ beam break data with mass measurement modules for food intake, water intake, and body weight. Additional technical information is provided in the Supplementary Data.
Behavior mapping analysis for each animal was performed for the last dark phase (12 continuous hours) of each condition (locked or unlocked wheel) using ExpeData Software (Sable Systems). This analysis yielded a complete sequential list of behaviors. For each behavior, the duration and frequency were measured. From the sequential list of behaviors, time budgets were generated as percentages. Time budget data were analyzed with two-dimensional hierarchical clustering (x-axis = animal, y-axis = behavior) and visualized as heat maps representing individual behavior budgets for individual mice relative to the group mean. Behavioral transitions were determined for the last continuous 24 h of data for each condition, and probability matrices were visualized as a Markov chain.
SkM Mitochondrial O2 Consumption, ATP Production, and Oxidative Efficiency
Mitochondrial ATP production, O2 consumption, and oxidative phosphorylation efficiency (ATP/O) were measured in permeabilized myofiber bundles from red gastrocnemius muscle as previously described (23).
Calculations
The contributions of OWA or VWR to total EE (EEtotal) were determined from time-matched behavior and metabolic data collected every 5 min over the last 72 h (435 data points/mouse) of each period (i.e., wheel locked or unlocked). Individual data points were binned based on OWA or VWR activity speed. The EE at rest (i.e., activity = 0) was determined then subtracted from EE during OWA or VWR. The remaining EE was multiplied by the percentage of time spent active at a given speed to determine the absolute contribution of OWA to EE (EEOWA) or the absolute contribution of VWR to EE (EEVWR). To determine EEOWA in mice with an unlocked running wheel, frequency distributions of OWA speed were generated as described above. Notably, however, the fraction of EE above rest in mice with a locked wheel was used instead of that measured when the wheel was unlocked. This was done because VWR typically occurred in concert with OWA, thereby convoluting the specific contribution of OWA to EE. This calculation relies on the assumption that the energetic cost of OWA at a given speed does not change when the wheel was unlocked. The metabolic cost of exercise (MCE) of VWR was calculated by dividing the total number of kilocalories expended at a given binned speed by the total distance traveled at that speed. The average energy cost of VWR across all speeds was used to calculate the MCE in kilocalories per meter for each individual mouse.
Energy intake (in kcal) = food intake (g) * 2.91 (kcal/g). The 2.91 kcal/g value represents the metabolizable energy obtained from the diet based on manufacturer data. Daily energy balance = energy intake (kcal/day) − EE (kcal/day). ΔOWA, ΔEE, Δenergy intake, and Δenergy balance were each calculated as (unlocked wheel − locked wheel).
Statistics
A paired Student t test was used to compare data when the wheel was locked versus unlocked. One-way ANOVA with Tukey post hoc test was used to examine rate-dependent metabolic responses. Simple linear regression analysis was used to generate correlation coefficients (r) or coefficients of determination (r2), as appropriate. An F test was used to determine the statistical significance of linear regressions. Unless otherwise indicated, all data are presented as the mean ± SD. Statistical significance was defined as P < 0.05.
Results
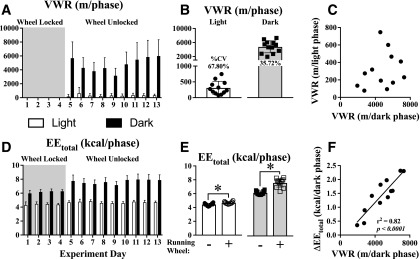
Daily light- and dark-phase VWR for the entire experimental period is shown in Fig. 1A, and the average from days 11 to 13 (shown in Fig. 1B) was used for subsequent analyses. There was no significant relationship between VWR distances during the light phase and the dark phase (Fig. 1C). The EEtotal for the entire experimental period is shown in Fig. 1D. The EEtotal increased during both light and dark phases when the running wheel was unlocked (Fig. 1E). The change in dark-phase EEtotal (ΔEEtotal) closely correlated with VWR distance (Fig. 1F).
Figure 1.
VWR elicits a distance-dependent increase in EE. VWR was measured during the light (open boxes and circles) and dark (closed boxes and squares) phases over the entire experimental period (A) and averaged over the final 3 days (B). %CV = coefficient of variation. No relationship was observed between light-phase and dark-phase VWR (C). EEtotal was measured during the light phases (open boxes) and dark phases (closed boxes) over the entire experimental period (D). EEtotal increased in both the light (circles) and dark (squares) phases of mice with access to a running wheel (E). The change in EEtotal (ΔEEtotal) after unlocking the wheel was tightly correlated with VWR distance (F). N = 12 mice; *P < 0.05 between bracketed groups using the paired Student t test. Regression lines are shown for relationships with P < 0.05 with the F test.
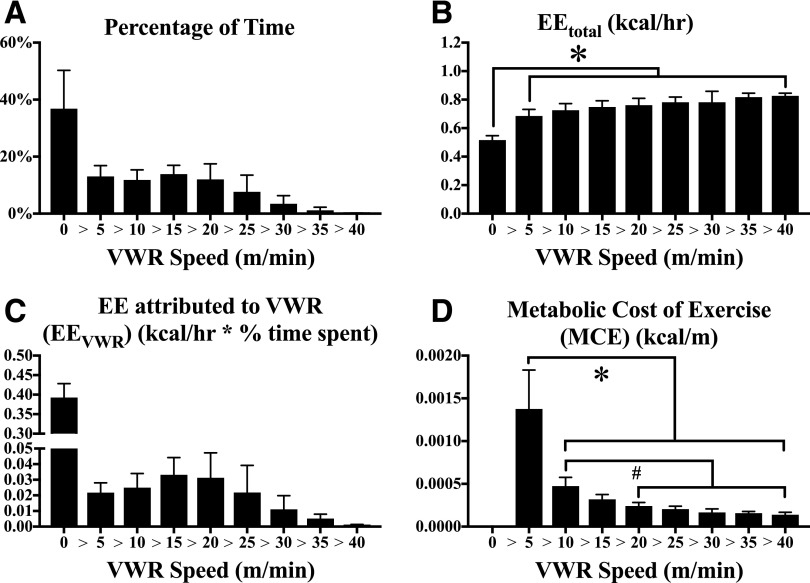
The relative amount of time mice spent at rest or performing VWR at different speeds is shown in Fig. 2A. EEtotal normalized to time (kcal/h) was significantly elevated when VWR was performed at any speed relative to inactivity (Fig. 2B). The EEtotal linearly increased as a function of VWR speed (r2 = 0.96, P < 0.0001; slope = 3.0 ± 0.4 kcal/km [mean ± SEM]). The EEVWR at a given speed is shown in Fig. 2C. Summing these individual contributions, we concluded that VWR accounted for 26.6 ± 7.7% of EEtotal. MCE (kcal/m) (Fig. 2D) decreased as VWR speed increased and tightly fit a one-phase exponential decay curve (r2 > 0.98 for all 12 mice). MCE at <5 m/min was positively correlated with VWR distance (r2 = 0.47, P < 0.05), but MCE at higher speeds of VWR was not significantly correlated. These data reinforce the observation made in Fig. 1 that VWR is a direct contributor to EE and implicate MCE at low VWR speeds as a predictive indicator of VWR behavior.
Figure 2.
Acute changes in EE and metabolic efficiency as a function of VWR speed. Real-time data from each mouse (435 data points/mouse) over the final three dark phases of the experimental period were separated based on running speed over each 5-min interval. The fraction of time mice spent inactive (VWR = 0) or running at different VWR speeds was measured (A). EEtotal of mice during inactivity or at various VWR speeds was determined (B). The fraction of EEtotal attributed to VWR at a given speed (active EE − inactive EE) was multiplied by the time spent at that speed to determine the contribution of VWR to EEtotal (EEVWR) (C). MCE (kcal/m traveled) was determined by dividing EEVWR by the distance traveled at each speed (D). N = 12 mice; * or #P < 0.05 between bracketed groups. hr, hour.
We hypothesized that SkM oxidative phosphorylation efficiency would be positively related to physical activity, thus providing a link between efficient aerobic metabolism and the motivation to exercise. Rates of ATP production (JATP) and O2 consumption (JO2) by permeabilized muscle fibers, as well as the resulting ATP/O values measured as a function of ADP concentration, are provided in the Supplementary Data. Surprisingly, plotting ATP/O at each ADP concentration studied (5, 20, 75, and 200 μmol/L) against VWR distance, ΔEEtotal, or MCE did not reveal any significant relationships (r2 < 0.1 for all ATP/O values tested). These data suggest that SkM mitochondrial oxidative efficiency is not associated with VWR performed over a relatively brief period of time.
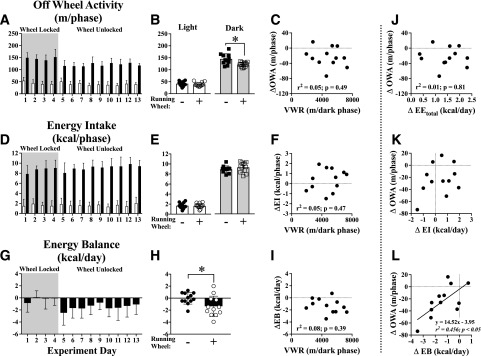
Dark-phase OWA was decreased in mice with an unlocked running wheel (Fig. 3A and B), but this was not related to VWR distance (Fig. 3C) or time spent performing VWR (r2 = 0.10, P = 0.31). Energy intake was not different in the light or dark phases when the running wheel was unlocked (Fig. 3D and E) or related to VWR (Fig. 3F). Daily energy balance became negative when the running wheel was unlocked (Fig. 3G and H), but changes in energy balance were not significantly related to dark-phase VWR distance (Fig. 3I).
Figure 3.
Energy balance is a determinant of the compensatory reduction in physical OWA in mice performing voluntary exercise. OWA was measured over the entire experimental period during light (open boxes) and dark (closed boxes) phases (A). Average dark-phase OWA decreased in mice with an unlocked running wheel (B) but was not correlated with VWR distance (C). Energy intake was measured over the entire experimental period (D) and was not different when the running wheel was unlocked (E) or correlated with VWR distance (F). Daily energy balance (energy intake − EE) was measured over the entire experimental period (G). Average daily energy balance became negative in mice performing VWR (H) but was not correlated with VWR distance (I). The change in OWA when the running wheel was unlocked (ΔOWA) was not correlated to ΔEE (J) or Δenergy intake (ΔEI) (K) but was positively related to Δenergy balance (ΔEB) (L). N = 12 mice. *P < 0.05 between bracketed groups using the paired Student t test. Regression lines are shown for relationships with P < 0.05 with the F test.
To explore how unlocking the running wheel might lead to decreased OWA, we compared the decline in OWA (ΔOWA) to changes in key metabolic variables. ΔOWA was not related to ΔEEtotal (Fig. 3J) or Δenergy intake (Fig. 3K) but was positively associated with Δenergy balance (Fig. 3L). These data suggest that reduced OWA may partially offset negative energy balances in response to the increased EE of VWR.
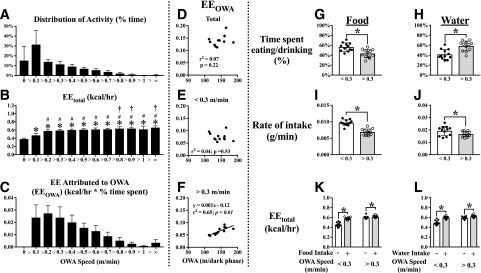
Frequency distributions of OWA speed (Fig. 4A), EEtotal as a function of OWA rate (Fig. 4B), and EEOWA (Fig. 4C) binned in 0.1 m/min increments were calculated. EEOWA was not related to total OWA distance (Fig. 4D). EEOWA measured at speeds <0.3 m/min also failed to correlate with OWA distance (Fig. 4E). EEOWA at speeds >0.3 m/min was positively correlated with OWA distance (Fig. 4F). We next examined food intake and water intake as they related to OWA and EE. The percentage of time spent eating was greater at low OWA (Fig. 4G), whereas time spent drinking was greater at high OWA (Fig. 4H). The rates of food and water intake were both greater, as expected, at low OWA compared with high OWA (Fig. 4I and J). Food intake corresponded to an ∼30% increase in EEtotal during low OWA but only an ∼3% increase during high OWA (Fig. 4K). Similar effects were observed for water intake (Fig. 4L). These data demonstrate for the first time that OWA is an independent contributor to EEtotal in mice. Since the contribution of OWA to EEtotal was observed only at OWA speeds >0.3 m/min, it is reasonable to conclude, as others have (21), that OWA at low speeds is not a direct contributor to EE.
Figure 4.
OWA is an independent contributor to EE in mice. Time spent performing OWA at various speeds (A), EEtotal when performing OWA (B), and EEOWA (C) were determined from 435 data points collected during three consecutive dark phases of data (days 2–4). OWA distance was plotted against total EEOWA (D), EEOWA with OWA <0.3 m/min (E), and EEOWA with OWA >0.3 m/min (F). Time spent eating (G) was greater when OWA was low (<0.3 m/min) compared with high (>0.3 m/min), whereas the opposite was true for time spent drinking (H). Average intake rates of food (I) and water (J) were both greater during low OWA compared with high OWA. EEtotal during food intake (K) and water intake (L) were both increased at both high and low rates of OWA, but the effect on EE was much larger at low rates of OWA. In panel B, *P < 0.05 compared with OWA = 0, #P < 0.05 compared with OWA <0.1 m/min, †P < 0.05 compared with OWA <0.3 m/min using ordinary one-way ANOVA with Tukey post hoc test; in all other panels, *P < 0.05 between bracketed group using paired Student t test. hr, hour.
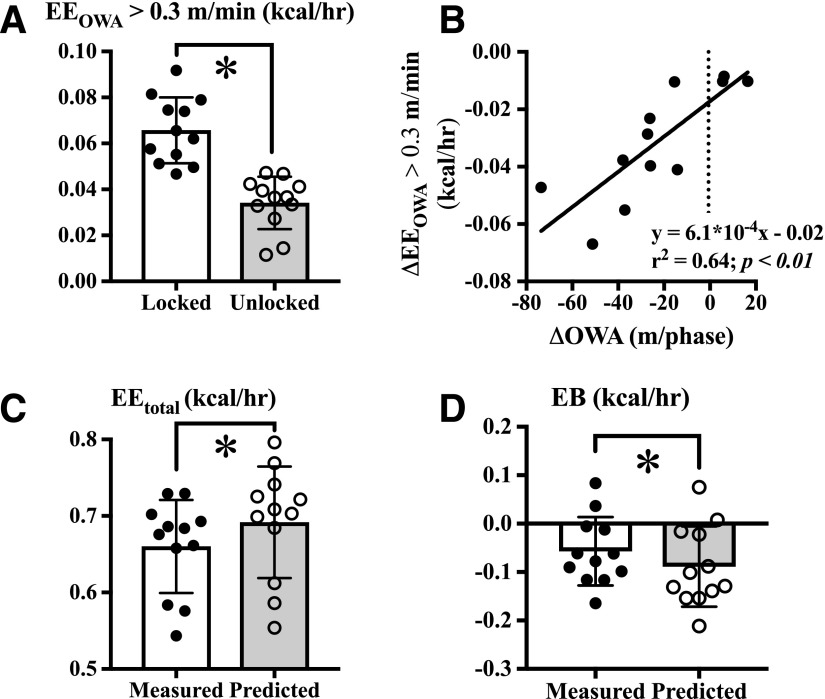
EEOWA when OWA was >0.3 m/min decreased when running wheels were unlocked (Fig. 5A). This decrease in EEOWA was linearly related to the decrease in OWA distance (Fig. 5B), confirming that it represents a change in the direct contribution of OWA to EEtotal. We next compared the measured EEtotal in mice with an unlocked running wheel to the predicted EEtotal if OWA were not reduced. The formula for this calculation was as follows: predicted EEtotal = measured EEtotal + (EEOWA locked − EEOWA unlocked). This calculation predicts that, if OWA was not reduced, EEtotal would be reduced ∼5% (Fig. 5C) and energy balance would be ∼45% less negative (Fig. 5D). These data are the first to demonstrate a direct impact of reduced nonexercise physical activity on exercise metabolism.
Figure 5.
Reduced OWA mitigates negative energy balance in mice performing VWR exercise. A: EEOWA when OWA >0.3 m/min decreased in mice with an unlocked running wheel. B: ΔEEOWA when OWA >0.3 m/min was positively related to the change in OWA distance when the wheel was unlocked. If OWA was not decreased, it is predicted that EEtotal would be ∼5% greater (C) and energy balance (EB) would be ∼45% more negative (D) than measured. N = 12 mice. *P < 0.05 between groups using paired Student t test. hr, hour.
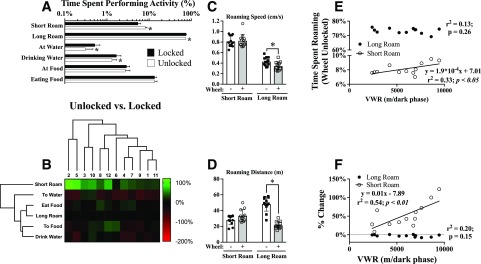
Since OWA impacts EEtotal and energy balance, we sought to define which OWA behaviors are altered by VWR. A behavioral analysis approach that quantifies the relative amount of time a mouse spends performing various activities was used. When the wheel was unlocked, mice spent 17.71 ± 5.4% (mean ± SD) of their time on the wheel. Time spent running was positively correlated with VWR distance (r2 = 0.86; P < 0.0001) and negatively correlated with time spent roaming (r2 = 0.92; P < 0.0001). Notably, however, the change in time spent roaming (unlocked − locked) was not correlated with the change in OWA distance (r2 = 0.11, P = 0.29), suggesting more intricate remodeling of OWA in response to VWR. To first examine the changes in OWA elicited by unlocking the wheel, independent of wheel-running behavior, the time spent running was removed as a variable. As a group, mice spent more time performing short roaming and less time performing long roaming (Fig. 6A) when the wheel was unlocked. The relative change in behavioral frequency for each mouse (unlocked/locked) was visualized as a two-dimensional hierarchical cluster (Fig. 6B), revealing a consistent increase in time performing short roaming. Mice performed long roaming at a slower speed when the wheel was unlocked with no change in short-roaming speed (Fig. 6C). The total distance traveled during long roaming was reduced ∼65% when the running wheel was unlocked (Fig. 6D). Despite a decrease in long-roaming distance, VWR distance was correlated with time performing short roaming, but not long roaming (Fig. 6E). Plotting the percentage change in short roaming in response to an unlocked wheel against VWR distance revealed an even stronger relationship (Fig. 6F). These findings demonstrate that the impact of VWR on OWA is intricate and multifaceted.
Figure 6.
Reduced duration of episodic inactivity after wheel access predicts VWR distance. A: Behavior frequency was determined for 12 consecutive hours during the last dark phase with the wheel locked or unlocked. B: The response of individual mice to an unlocked wheel (unlocked/locked) was analyzed using two-dimensional hierarchical clustering (mouse, x-axis; behavior, y-axis) and visualized as a heat map. C: The average speed of long or short roaming was measured in mice with a locked or unlocked wheel. D: The total distance traveled during short or long roaming was determined in mice with a locked or unlocked wheel. E: Time spent short roaming (open circles) when the wheel was unlocked was positively associated with VWR. F: The response in short roaming to the wheel being unlocked revealed an even stronger positive association with VWR. N = 12 mice. *P < 0.05 between groups using paired Student t test.
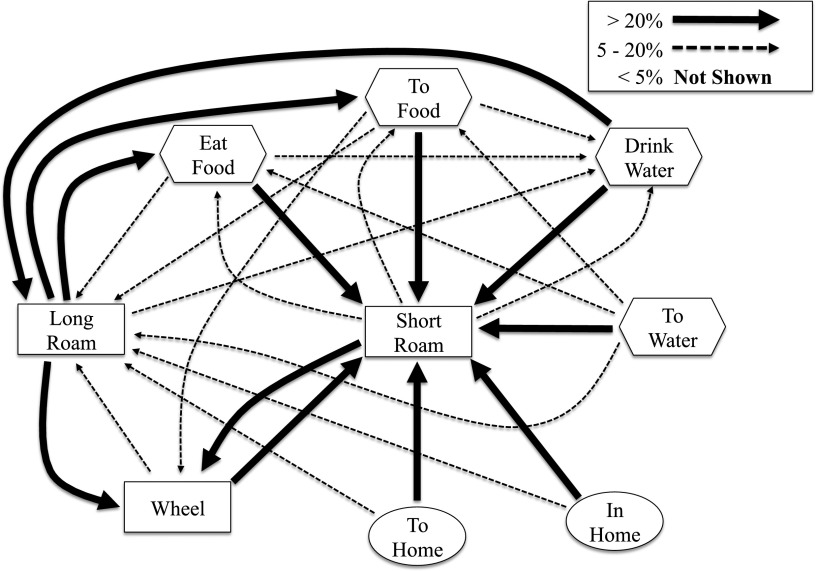
We further investigated the relationship between short roaming and VWR using behavioral transition matrices. With this approach, we tested the hypothesis that short roaming and VWR constitute a repeated behavioral circuit that predicts VWR distance. Behavioral transitions (data provided in Supplementary Data) were visualized as a Markov chain (Fig. 7). Consistent with our hypothesis, short roaming was the most common behavior preceding VWR, occurring 39% of the time, and VWR was the most common behavior that preceded short roaming, occurring 86% of the time. Bouts of short roaming adjacent to (before or after) VWR bouts were performed at a higher speed than other short-roaming bouts (0.91 ± 0.14 vs. 0.62 ± 0.15 cm/s, P < 0.0001). The frequency with which short roaming preceded VWR was a positive predictor of VWR distance (r2 = 0.54, P < 0.01). These findings led us to hypothesize that the number of repeated running bouts would predict VWR distance. Surprisingly, the total number of repeated running bouts did not predict VWR distance (r2 = 0.23, P = 0.12). The average VWR bout duration was tightly correlated with VWR distance (r2 = 0.59, P < 0.01). Long, repeated VWR bouts (>100 s) positively predicted VWR distance (r2 = 0.72, P < 0.001), whereas no relationship was observed between VWR distance and the number of short repeated running bouts (<100 s) (r2 < 0.1). These data demonstrate functional interactions between VWR and OWA that more comprehensively describe voluntary exercise behavior.
Figure 7.
Duration and rapid successive bouts predict VWR distance. Mouse behavior transitions were continuously monitored for the last 24 h with the wheel unlocked. The coupling of behaviors in sequence was mapped using a Markov chain plot that revealed “short roaming → VWR” and “VWR → short roaming” as prominent behavioral transitions. Lines represent the group mean for N = 12 mice.
Discussion
In this report, we characterize metabolic and behavioral remodeling that occurs in mice engaged in VWR. We have quantified the direct contributions of VWR and OWA to EE and found that decreased OWA can preserve energy balance in response to VWR. Remodeling of OWA is complex and includes both gross reductions in OWA distance and time spent roaming, but also changes in the duration and context of roaming behavior. These intricate and assorted modifications in cage behavior suggest an important interplay between VWR and OWA in the regulation of energy balance and provide a framework for assessing mouse metabolism in the context of both exercise and nonexercise behavior.
VWR contributing to EEtotal (Fig. 1D–F) is consistent with previous work in outbred mice (18,24), as well as a recent study in C57BL/6 mice (14), but is at odds with another report (21). We refine our understanding of the relationship between VWR and EEtotal by showing a strong positive linear correlation between dark-phase EEtotal and VWR distance (Fig. 1F). One reason a relationship between VWR and EEtotal has been difficult to detect may relate to the interval of metabolic gas sampling. For example, Chappell et al. (18) used a fast sampling interval (90 s) and demonstrated a speed-dependent contribution of VWR to EEtotal. In the current study, a 5-min sampling interval was used, and we observed a similar relationship between VWR and EEtotal. O’Neal et al. (14) used 13-min intervals and observed an increase in daily EEtotal when mice had an unlocked wheel, but the rise in EEtotal was not correlated with VWR distance. Finally, Virtue et al. (21) used 18-min intervals and failed to detect a contribution of VWR to EEtotal in mice. Thus, sampling rate is a critical factor in the ability to resolve the contribution of VWR to EEtotal.
We were also able to detect the acute (5 min) contribution of VWR to EEtotal (Fig. 2A). From these data, we found that MCE decreased as a function of VWR speed (Fig. 2D) and was positively related to VWR distance. This observation suggests that metabolic efficiency may be a predictor of voluntary physical activity behavior and warrants further investigation. SkM mitochondrial oxidative efficiency was not related to VWR measured over this relatively brief time period (Supplementary Data), suggesting that differences in MCE may be primarily due to biomechanic or cardiovascular differences as opposed to variations in oxidative metabolism per se.
As far as we are aware, this is the first study to report an independent contribution of OWA to EEtotal. From these data, we also provide a potential explanation for why previous reports have been unable to do so. For example, Virtue et al. (21) found a linear relationship between EEtotal and low speeds of OWA. Examining only low OWA rates to determine EEOWA, they found no significant relationship between EEOWA and OWA speed and thus concluded that the independent contribution of OWA to EEtotal was essentially zero. Our data show the same poor relationship between EEOWA at low OWA speeds (<0.3 m/min) and total OWA distance (Fig. 4E), likely due to the concurrent intake of food and/or water (Fig. 4K and L). However, we demonstrate that EEOWA at >0.3 m/min is positively correlated with OWA distance (Fig. 4F) where food/water intake have a minimal effect on EE. These data collectively suggest that food and water intake explain, at least in part, why previous reports have been unable to detect an independent contribution of OWA to EEtotal.
A primary goal of the experiments performed was to define the impact of decreased OWA on energy balance in mice performing VWR. In these experiments, an unlocked wheel decreased energy balance (Fig. 3G and H) independent of VWR distance (Fig. 3I) and changes in energy intake (Fig. 3F). A lack of change in energy intake has been reported in mice that engage in VWR for brief periods of time (14). The negative energy balance observed with an unlocked wheel was associated with a decrease in OWA (Fig. 3L) but not VWR distance (Fig. 3I), EEtotal (Fig. 3J), or energy intake (Fig. 3K). These findings collectively suggest that energy balance may be a determinant of OWA in mice performing VWR.
We observed a reduction in EEOWA at high OWA speeds (i.e., >0.3 m/min) when the running wheel was unlocked compared with when it was locked (Fig. 5A). This change in EEOWA was linearly related to the change in OWA distance resulting from the wheel being unlocked (Fig. 5B), reflecting a decrease in the direct contribution of OWA to EEtotal. The decrease in EEOWA when the wheel was unlocked is estimated to reduce EEtotal by ∼5% and consequently mitigate the drop in daily energy balance by ∼45% (Fig. 5C and D). This difference in energy balance, specifically due to reduced OWA, translates to a decrease in weight loss of 0.4 g of fat per week. These data are consistent with a “constrained” model of EEtotal where reduced nonexercise activity serves to maintain a ceiling for EE (13,25). Human studies examining whether nonexercise physical activity decreases with exercise are somewhat inconsistent (reviewed in the study by Melanson [26]), so it is possible that our approach can be coupled with mouse genetic engineering to better understand these variable responses.
VWR behavior is highly variable between individual mice, even within an inbred strain (14). OWA behavior of the C57BL/6J mice studied here dramatically changed when they were allowed to run on a wheel. For example, mice spent less time roaming when given access to a wheel. Specifically, long roaming was performed less often (Fig. 6A) and at a slower speed (Fig. 6C) in mice with an unlocked wheel. These changes resulted in an ∼65% decrease in distance traveled during long roaming (Fig. 6D). Meijer and Robbers (27) recently showed that wild mice run significant distances on a wheel placed in their natural environment for no clear reason, so it is interesting to consider whether this observation could be explained by VWR and long roaming being functionally similar behaviors associated with foraging.
Mice performing VWR engaged in a distinct behavioral circuit consisting of repeated bouts of short roaming and VWR (Fig. 7). Engaging in this circuit was found to be a positive predictor of VWR distance, suggesting it may be a tractable mechanism for better understanding voluntary exercise behavior. One possible explanation for the existence of this circuit may be to avoid overexertion incurred by longer bouts. These findings provide valuable insight into our understanding of why mice, and potentially humans, have such broad variability in their willingness to engage in voluntary exercise and present new behaviors to interrogate.
The findings described here should be considered with the following caveats. The ability to assess activity-induced changes in EE was limited by the temporal resolution of gas analysis (5-min intervals). These studies examined a relatively acute time frame for VWR, and it is unknown whether these behavioral changes persist over longer periods of time. Chow-fed male mice were studied, so it is unknown whether obese mice in positive energy balance would respond similarly. Finally, it is unknown whether female mice have the same behavioral and metabolic responses to VWR.
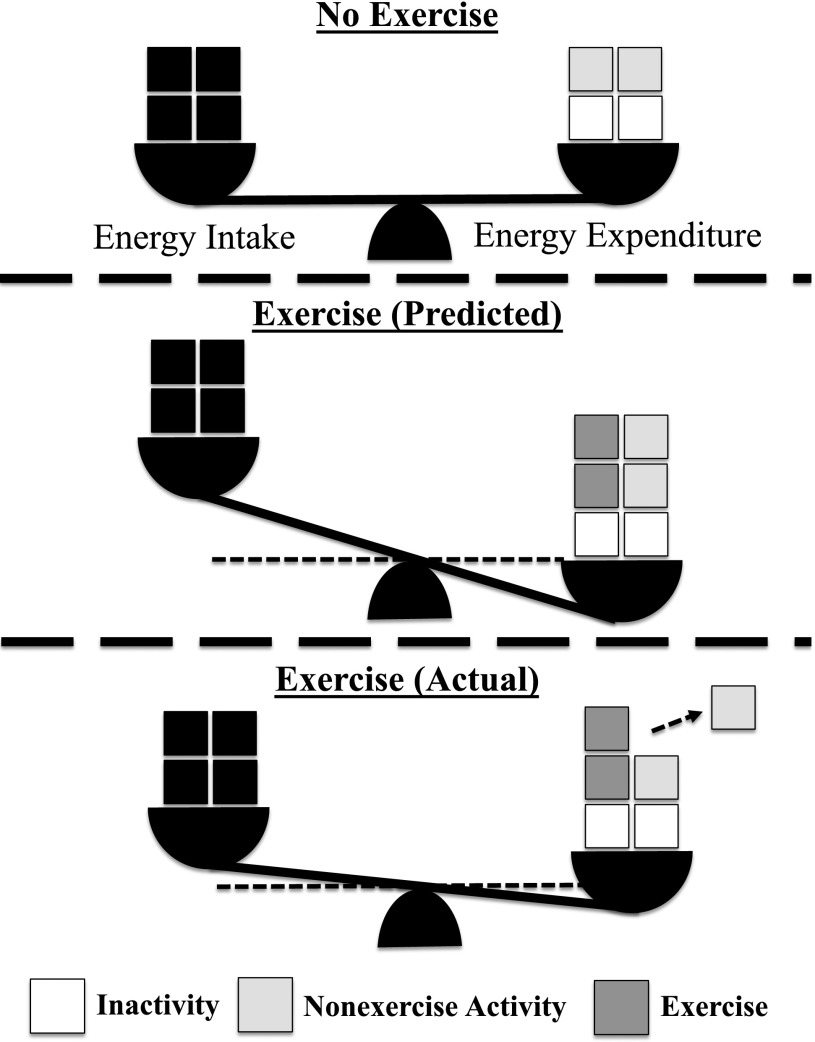
The use of rodent models to study voluntary metabolic and behavioral responses to VWR has been constrained by an inability to detect the contributions of VWR and OWA to EE, distinguish between context-specific behaviors, and account for individual variability in VWR performance within a group of animals. By addressing these gaps in our understanding of voluntary exercise metabolism and behavior, our findings (summarized in Fig. 8) provide the most comprehensive assessment to date of the metabolic and behavioral response to voluntary exercise and provide a framework for deconstructing the complex regulation of energy balance in mice.
Figure 8.
Reduced nonexercise physical activity preserves energy balance in response to exercise. Top: In the absence of exercise, energy intake is matched with EE and the resulting maintenance of body mass over time. Middle: Voluntary exercise increases EE that would be predicted to be additive for EE and thereby induces a pronounced negative energy balance. Bottom: The change in energy balance with voluntary exercise is less than predicted because of a reduction in nonexercise physical activity.
Supplementary Material
Article Information
Acknowledgments. The authors thank Dr. Owen McGuinness (Vanderbilt University) for valuable feedback on the manuscript.
Funding. Financial support for this work was provided by the National Institute of Diabetes and Digestive and Kidney Diseases (NIDDK) Mouse Metabolic Phenotyping Centers (www.mmpc.org) under MICROMouse Program grant DK-076169 (GRU2558 to D.S.L.), an American Heart Association postdoctoral fellowship (16POST299100001 to D.S.L.), and National Institutes of Health/NIDDK grants R01-DK-054902 and R01-DK-059637 (to D.H.W.).
Duality of Interest. J.R.B.L. is President and Chief Technology Officer of Sable Systems International, which designs, manufactures, and supports the Promethion metabolic and behavioral phenotyping system used in this study. No other potential conflicts of interest relevant to this article were reported.
Author Contributions. D.S.L. designed and executed studies and analyzed data. J.R.K., M.N.J., and F.D.J. executed studies and analyzed data. P.M.M. and J.R.B.L. analyzed data. L.L. and D.H.W. designed studies. All authors contributed to the writing of the manuscript and have approved the final version. D.S.L. is the guarantor of this work and, as such, had full access to all the data in the study and takes responsibility for the integrity of the data and the accuracy of the data analysis.
Prior Presentation. Parts of this study were presented in abstract form at the 77th Scientific Sessions of the American Diabetes Association, San Diego, CA, 9–13 June 2017.
Footnotes
This article contains Supplementary Data online at http://diabetes.diabetesjournals.org/lookup/suppl/doi:10.2337/db17-1293/-/DC1.
References
- 1.Byrne NM, Wood RE, Schutz Y, Hills AP. Does metabolic compensation explain the majority of less-than-expected weight loss in obese adults during a short-term severe diet and exercise intervention? Int J Obes (Lond) 2012;36:1472–1478 [DOI] [PubMed] [Google Scholar]
- 2.Shaw K, Gennat H, O’Rourke P, Del Mar C. Exercise for overweight or obesity. Cochrane Database Syst Rev 2006;(4):CD003817. [DOI] [PMC free article] [PubMed] [Google Scholar]
- 3.Jung AP, Luthin DR. Wheel access does not attenuate weight gain in mice fed high-fat or high-CHO diets. Med Sci Sports Exerc 2010;42:355–360 [DOI] [PMC free article] [PubMed] [Google Scholar]
- 4.Ma H, Torvinen S, Silvennoinen M, et al. . Effects of diet-induced obesity and voluntary wheel running on bone properties in young male C57BL/6J mice. Calcif Tissue Int 2010;86:411–419 [DOI] [PubMed] [Google Scholar]
- 5.Ma H, Turpeinen T, Silvennoinen M, et al. . Effects of diet-induced obesity and voluntary wheel running on the microstructure of the murine distal femur. Nutr Metab (Lond) 2011;8:1. [DOI] [PMC free article] [PubMed] [Google Scholar]
- 6.Swallow JG, Koteja P, Carter PA, Garland T Jr. Food consumption and body composition in mice selected for high wheel-running activity. J Comp Physiol B 2001;171:651–659 [DOI] [PubMed] [Google Scholar]
- 7.Stubbs RJ, Sepp A, Hughes DA, et al. . The effect of graded levels of exercise on energy intake and balance in free-living women. Int J Obes Relat Metab Disord 2002;26:866–869 [DOI] [PubMed] [Google Scholar]
- 8.Schwartz A, Doucet E. Relative changes in resting energy expenditure during weight loss: a systematic review. Obes Rev 2010;11:531–547 [DOI] [PubMed] [Google Scholar]
- 9.Hopkins M, Gibbons C, Caudwell P, et al. . The adaptive metabolic response to exercise-induced weight loss influences both energy expenditure and energy intake. Eur J Clin Nutr 2014;68:581–586 [DOI] [PubMed] [Google Scholar]
- 10.Leibel RL, Rosenbaum M, Hirsch J. Changes in energy expenditure resulting from altered body weight. N Engl J Med 1995;332:621–628 [DOI] [PubMed] [Google Scholar]
- 11.Herrmann SD, Willis EA, Honas JJ, Lee J, Washburn RA, Donnelly JE. Energy intake, nonexercise physical activity, and weight loss in responders and nonresponders: the Midwest Exercise Trial 2. Obesity (Silver Spring) 2015;23:1539–1549 [DOI] [PMC free article] [PubMed] [Google Scholar]
- 12.King NA, Tremblay A, Blundell JE. Effects of exercise on appetite control: implications for energy balance. Med Sci Sports Exerc 1997;29:1076–1089 [DOI] [PubMed] [Google Scholar]
- 13.Pontzer H. Constrained total energy expenditure and the evolutionary biology of energy balance. Exerc Sport Sci Rev 2015;43:110–116 [DOI] [PubMed] [Google Scholar]
- 14.O’Neal TJ, Friend DM, Guo J, Hall KD, Kravitz AV. Increases in physical activity result in diminishing increments in daily energy expenditure in mice. Curr Biol 2017;27:423–430 [DOI] [PMC free article] [PubMed] [Google Scholar]
- 15.Copes LE, Schutz H, Dlugosz EM, Acosta W, Chappell MA, Garland T Jr. Effects of voluntary exercise on spontaneous physical activity and food consumption in mice: results from an artificial selection experiment. Physiol Behav 2015;149:86–94 [DOI] [PubMed] [Google Scholar]
- 16.de Carvalho FP, Benfato ID, Moretto TL, Barthichoto M, de Oliveira CA. Voluntary running decreases nonexercise activity in lean and diet-induced obese mice. Physiol Behav 2016;165:249–256 [DOI] [PubMed] [Google Scholar]
- 17.Lighton JR. Limitations and requirements for measuring metabolic rates: a mini review. Eur J Clin Nutr 2017;71:301–305 [DOI] [PubMed] [Google Scholar]
- 18.Chappell MA, Garland T Jr, Rezende EL, Gomes FR. Voluntary running in deer mice: speed, distance, energy costs and temperature effects. J Exp Biol 2004;207:3839–3854 [DOI] [PubMed] [Google Scholar]
- 19.Brown JD, Naples SP, Booth FW. Effects of voluntary running on oxygen consumption, RQ, and energy expenditure during primary prevention of diet-induced obesity in C57BL/6N mice. J Appl Physiol (1985) 2012;113:473–478 [DOI] [PubMed] [Google Scholar]
- 20.McMullan RC, Kelly SA, Hua K, et al. . Long-term exercise in mice has sex-dependent benefits on body composition and metabolism during aging. Physiol Rep 2016;4:e13011. [DOI] [PMC free article] [PubMed] [Google Scholar]
- 21.Virtue S, Even P, Vidal-Puig A. Below thermoneutrality, changes in activity do not drive changes in total daily energy expenditure between groups of mice. Cell Metab 2012;16:665–671 [DOI] [PMC free article] [PubMed] [Google Scholar]
- 22.Gibala MJ, Little JP, van Essen M, et al. . Short-term sprint interval versus traditional endurance training: similar initial adaptations in human skeletal muscle and exercise performance. J Physiol 2006;575:901–911 [DOI] [PMC free article] [PubMed] [Google Scholar]
- 23.Lark DS, Torres MJ, Lin CT, Ryan TE, Anderson EJ, Neufer PD. Direct real-time quantification of mitochondrial oxidative phosphorylation efficiency in permeabilized skeletal muscle myofibers. Am J Physiol Cell Physiol 2016;311:C239–C245 [DOI] [PMC free article] [PubMed] [Google Scholar]
- 24.Rezende EL, Gomes FR, Chappell MA, Garland T Jr. Running behavior and its energy cost in mice selectively bred for high voluntary locomotor activity. Physiol Biochem Zool 2009;82:662–679 [DOI] [PubMed] [Google Scholar]
- 25.Pontzer H, Durazo-Arvizu R, Dugas LR, et al. . Constrained total energy expenditure and metabolic adaptation to physical activity in adult humans. Curr Biol 2016;26:410–417 [DOI] [PMC free article] [PubMed] [Google Scholar]
- 26.Melanson EL. The effect of exercise on non-exercise physical activity and sedentary behavior in adults. Obes Rev 2017;18(Suppl. 1):40–49 [DOI] [PMC free article] [PubMed] [Google Scholar]
- 27.Meijer JH, Robbers Y. Wheel running in the wild. Proc Biol Sci 2014;281:20140210. [DOI] [PMC free article] [PubMed] [Google Scholar]
Associated Data
This section collects any data citations, data availability statements, or supplementary materials included in this article.


