Abstract
Specific circulating metabolites have emerged as important risk factors for the development of diabetes. The acylcarnitines (acylCs) are a family of metabolites known to be elevated in type 2 diabetes (T2D) and linked to peripheral insulin resistance. However, the effect of acylCs on pancreatic β-cell function is not well understood. Here, we profiled circulating acylCs in two diabetes cohorts: 1) women with gestational diabetes mellitus (GDM) and 2) women with recent GDM who later developed impaired glucose tolerance (IGT), new-onset T2D, or returned to normoglycemia within a 2-year follow-up period. We observed a specific elevation in serum medium-chain (M)-acylCs, particularly hexanoyl- and octanoylcarnitine, among women with GDM and individuals with T2D without alteration in long-chain acylCs. Mice treated with M-acylCs exhibited glucose intolerance, attributed to impaired insulin secretion. Murine and human islets exposed to elevated levels of M-acylCs developed defects in glucose-stimulated insulin secretion and this was directly linked to reduced mitochondrial respiratory capacity and subsequent ability to couple glucose metabolism to insulin secretion. In conclusion, our study reveals that an elevation in circulating M-acylCs is associated with GDM and early stages of T2D onset and that this elevation directly impairs β-cell function.
Introduction
Gestational diabetes mellitus (GDM) and type 2 diabetes (T2D) are complex metabolic disorders characterized by defects in insulin action (insulin resistance) and/or insulin secretion (β-cell dysfunction). GDM is actually the single greatest risk factor for the development of T2D, with 20–50% of women with GDM developing T2D within 5–10 years of the index pregnancy (1–4), suggesting that these diseases are closely linked. In recent years, advances in metabolomics research have enabled the comprehensive screening of circulating metabolites associated with diabetes, leading to the discovery of several circulating metabolites associated with the disease. One such family of metabolites is the circulating acylcarnitines (acylCs) (5–9). AcylCs are intermediate oxidative metabolites consisting of a fatty acid esterified to a carnitine moiety that facilitates its transport across the mitochondrial membrane for β-oxidation (10). Elevated circulating levels of free carnitine and several short-chain (S)- (C2, C3, C4, C5), medium-chain (M)- (C6, C8, C10, C10:1), and long-chain (L)- (C14:1, C16, C18, C18:1) acylCs are reported in established cases of T2D (7–11). However, to our knowledge, the acylC profile has not been investigated in populations of subjects who recently progressed from GDM to T2D.
Previous studies suggest that elevated levels of acylCs, particularly L-acylCs, are linked to the development of peripheral insulin resistance (7–12). Importantly, whether alterations in acylCs have any direct effect on β-cell function is less well understood. An elegant study recently found that an accumulation of L-acylCs, in particular stearoylcarnitine, induces an impairment in insulin synthesis (13), suggesting a potential direct link between altered acylC levels and β-cell dysfunction. Thus far, L-acylCs have been shown to be associated with T2D, but M-acylCs have not been studied in this context. M-acylCs begin to rise ahead of L-acylCs when the production of acetyl-CoA, the end product of mitochondrial β-oxidation, exceeds the capacity of the tricarboxylic acid (TCA) cycle (14–17). Altered levels of M-acylCs may therefore be an early sign of mitochondrial dysfunction, possibly contributing to β-cell dysfunction and the onset of diabetes, but this relationship has not been explored.
In this study, we profiled acylC species in two populations with diabetes and investigated their effects on β-cell function. Circulating acylCs were examined in one cohort of women with GDM and in another distinct cohort of postpartum women with recent GDM, who later developed impaired glucose tolerance (IGT), new-onset T2D, or returned to normal glucose tolerance (NGT) during a 2-year follow-up. We further explored how elevating acylCs affect pancreatic β-cell function and the potential underlying mechanism. Our findings provide new insights into the relationship between acylCs and β-cell function, complementing the premise that higher circulating acylCs may play a causal role in the development of diabetes.
Research Design and Methods
AcylC Profiling
AcylCs were measured in two major study populations: 1) a Canadian cross-sectional GDM pregnancy cohort, and 2) the Study of Women, Infant Feeding and Type 2 Diabetes after GDM pregnancy (SWIFT) prospective GDM postpartum cohort. The GDM pregnancy cohort was as described previously (18). Fasting plasma samples were collected from women who were at 24–28 weeks’ gestation at the time of GDM screening. GDM diagnosis was determined by first using a glucose challenge test, followed by a 3-h 100 g glucose oral glucose tolerance test (OGTT). Butylester forms of acylCs were measured in two independent subcohorts with 12 samples/group/cohort (a total of n = 24/group) using semiquantitative selected reaction monitoring mass spectroscopy (SRM-MS) (performed by Metabolon, Inc.), as previously described (19). Each subcohort was matched for age, race, prepregnancy BMI, and family history of diabetes (18). In both subcohorts, the family of M-acylCs was profiled overall (n = 24/group), whereas in one subcohort, subspecies of M-acylCs were measured (n = 12/group). All women provided written informed consent for their participation, and the protocol was approved by the Mount Sinai Hospital Research Ethics Board. The SWIFT GDM postpartum cohort was as described previously (20–22). SWIFT is a longitudinal prospective cohort of women with recent GDM who were regularly screened via 2-h OGTTs from early postpartum up to 2 years later for progression to IGT and T2D. Those who developed IGT or T2D were matched by age, BMI, and race to women who returned to NGT (Supplementary Table 1). Butylester forms of acylCs were measured in fasting plasma samples obtained at the time of the postpartum diagnosis from post-GDM Hispanic women who developed IGT (n = 13), T2D (n = 12), or returned to NGT (n = 11), using quantitative SRM-MS (performed by the Analytical Facility for Bioactive Molecules of the Centre for the Study of Complex Childhood Diseases, The Hospital for Sick Children, Toronto, Ontario, Canada). The study design and all procedures were approved by the Kaiser Permanente Northern California Institutional Review Board for the Protection of Human Subjects.
M-acylC Preparation and Animal Studies
Hexanyolcarnitine (C6) (H1232; Sigma-Aldrich, St. Louis, MO) and octanyolcarnitine (C8) (0605; TOCRIS, Minneapolis, MN) were dissolved in endotoxin-free water (Sigma-Aldrich) to a stock concentration of 100 μmol/L and diluted with sterile saline for injection. CD1 mice (10 weeks old) were injected intraperitoneally (i.p.) once daily for 2 weeks. Blood samples were collected several times within the first 24 h after the first injection to evaluate the serum concentrations achieved through the selected dose, and thereafter 24 h after the previous administration (and before the next injection) at the selected times to evaluate whether there was an accumulation of M-acylCs in the serum with long-term administration. Serum M-acylC levels were quantified by MS. The dose that provided a ∼1.5-fold peak increase, as observed in GDM compared with NGT subjects (a mixture of 10 ng/g C6-acylC and 20 ng/g C8-acylC) was selected and administered to mice by daily i.p. injection for 2 weeks. The day after the final injection, an intraperitoneal glucose tolerance test (IPGTT) or insulin tolerance test (IPITT) was performed, as described previously (18,23). All experiments were approved by the University of Toronto Animal Care Committee, and animals were handled according to the Canadian Council of Animal Care guidelines.
Human/Mouse Islet Isolation and In Vitro Islet Treatment
Human islets from review board–approved healthy donors were obtained from the Islet Core and Clinical Islet Laboratory (University of Alberta, Edmonton, Alberta, Canada) and from the University Health Network Islet Isolation Program (Toronto, Ontario, Canada). Human islet picking and mouse islet isolation were performed as described previously (18,23,24). Briefly, human islets were picked into low glucose DMEM media (GIBCO, reference number 11885-084) with 10% FBS, 1% penicillin/streptomycin, and 1% L-glutamine, and cultured overnight before use. Murine islets were hand-picked three times and allowed to recover overnight in RPMI 1640 (Sigma-Aldrich) supplemented with 10% FBS and 1% penicillin/streptomycin before experiments. Islets were then treated for 28 h at 37°C with M-acylCs at physiological or pathological concentrations. Based on previously reported normal concentrations (11,25–27), we used 0.16 μmol/L C6-acylC and 0.23 μmol/L C8-acylC as physiological concentrations (M-acylCs Physio), and concentrations equivalent to 1.5-fold of the physiological concentration (0.24 μmol/L C6-acylC and 0.35 μmol/L C8-acylC) were used as pathological concentrations (M-acylCs Patho). This 1.5-fold increase was based on the increases in circulating M-acylCs seen in our GDM population.
Static and Dynamic Glucose-Stimulated Insulin Secretion Assays
After M-acylC treatment, human and murine islets were assessed by static (30 islets per condition) and dynamic (100 islets per condition) insulin secretion assays. Static glucose-stimulated insulin secretion (GSIS) assays were performed as previously described (18,23), in which 2 and 11 mmol/L glucose were used as the low glucose (LG) and high glucose (HG) conditions, respectively, and 11 mmol/L methylpyruvate (Sigma-Aldrich) was used for pyruvate-stimulated insulin secretion. An equal volume of supernatant (500 μL) was used in each condition for the static secretion assay and was collected for insulin measurement.
At the completion of the GSIS assay experiment, islets were lysed in acid ethanol and collected for DNA quantification. Dynamic insulin secretion assays were performed, as previously described (28), using a PERI4.2 perifusion system (Biorep Technologies, Miami, FL). Perifusion was maintained at a flow rate of 100 µL/min under temperature-controlled conditions, and after each cycle, the supernatant was collected for insulin measurement. After static and dynamic GSIS assays, insulin content in secretion samples was evaluated using an insulin homogenous time-resolved fluorescence assay, according to the manufacturer’s instructions (Cisbio, Bedford, MA), and was quantified using the BMG PHERAstar plate reader (BMG Labtech, Cary, NC).
Measurements of 2-[14C(U)]-Deoxy-d-Glucose Uptake/Calcium Influx
Glucose uptake assays were performed as previously described (23). For calcium influx measurements, isolated dispersed islets were loaded with Fura-2 acetoxymethyl dye (25 µg/mL for 60 min) in 2 mmol/L glucose imaging buffer (130 mmol/L NaCl, 5 mmol/L KCl, 2 mmol/L CaCl2, 1 mmol/L MgCl2, 5 mmol/L NaHCO3, and 10 mmol/L HEPES). Islets were washed and placed in imaging chambers containing imaging buffer with 2 mmol/L glucose. Images were taken at 3-s intervals at ex = 340 nm by an Olympus IX70 inverted epi-fluorescence microscope in combination with an UltraPixel camera and a computer with Photon Technology International (PTI) imaging software. After basal measurements, glucose was added to a final concentration of 11 mmol/L to observe the corresponding calcium influx. Finally, 25 mmol/L KCl was added to induce membrane depolarization and maximum calcium influx.
ATP Measurements and Caspase-3/7 Assay
ATP (50 islets per condition) was measured as previously described (18), using the StayBrite Highly Stable ATP Bioluminescence Assay Kit (BioVision, Milpitas, CA) according to the manufacturer’s protocol. Cleaved caspase-3/7 activity assay (30 islets per condition) was performed according to the manufacturers’ instructions (G8091; Promega, Madison WI).
Mitochondrial Membrane Potential, Reactive Oxygen Species, and Seahorse Metabolic Flux Assay
Mitochondrial membrane potential (MMP) and reactive oxygen species (ROS) measurements were performed, as described previously (18,23). For the Seahorse metabolic flux assay, 100 dispersed murine islets were seeded into Seahorse XF24 islet plates (Agilent, Santa Clara, CA) and incubated in 2 mmol/L glucose Krebs Ringer buffer without bicarbonate for 1 h before being loaded into the Seahorse XF24 metabolic flux analyzer (Agilent). Oxygen consumption rate (OCR) was measured at 2 mmol/L glucose, followed by 11 mmol/L glucose or 11 mmol/L α-ketoisocaproic acid (KIC) (Sigma-Aldrich) to measure substrate utilization. All islets were then treated with 5 μmol/L oligomycin, 2 μmol/L carbonylcyanide-4-(trifluoromethoxy)-phenylhydrazone, and 5 μmol/L rotenone with 5 μmol/L antimycin A. Raw traces were normalized to protein, and metabolic parameters were calculated according to the manufacturer’s instruction.
Gene Expression Analysis and Western Blotting
Total RNA was extracted from 100 murine islets using the RNeasy Mini Plus kit (Qiagen, Hilden, Germany), and reverse transcription and quantitative PCR were performed as described previously (19). Primer sequences used in quantitative PCR are listed in Supplementary Table 2. Mitochondrial gene array (Qiagen) was performed according to the manufacturer’s instructions. Western blotting was performed as previously described (18,23). Briefly, the membranes were probed with the antibodies listed in Supplementary Table 3 and imaged using the Kodak Imager 4000 Pro (Carestream).
Statistics
Homogeneity of variance was analyzed using the Levene test. Samples with the same variance were assessed for statistical significance using the Student t test or one-way or two-way ANOVA for repeated measures, followed by a Bonferroni, Dunnett, and Tukey posttest comparison where required. Samples with different variance were assessed using a Mann-Whitney U test. P < 0.05 was considered significant. All data are presented as mean ± SEM.
Results
M-acylCs Are Elevated in GDM and New-Onset T2D Without an Alteration in L-acylCs
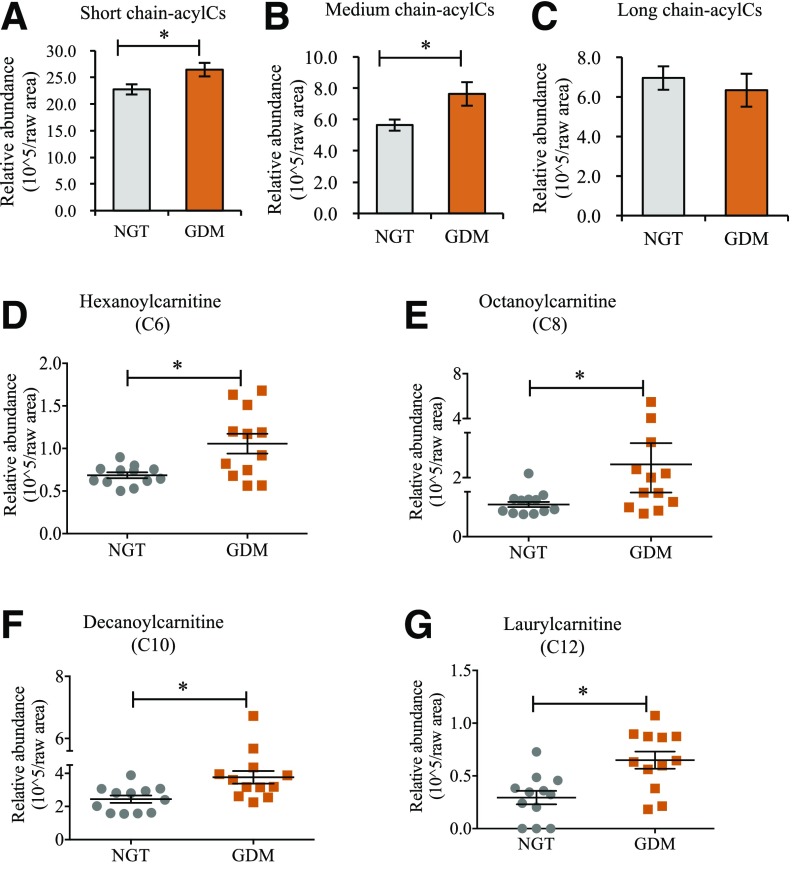
We first profiled circulating acylCs in serum samples from pregnant women with newly diagnosed GDM and non-GDM pregnant control subjects and found a significant increase in S-acylCs (Fig. 1A and Supplementary Fig. 1A) and M-acylCs (Fig. 1B) in GDM compared with NGT control subjects. Interestingly, there was no significant difference in L-acylCs (Fig. 1C and Supplementary Fig. 1A), which were previously shown to be elevated in overt T2D and associated with insulin resistance. Given that the current study population represents new-onset diabetes, this suggests that this distinct alteration in the acylC profile may reflect an early metabolic signature in diabetes development. Because M-acylCs are not well understood in diabetes onset, we further examined individual subspecies of M-acylCs. In a distinct cohort of GDM women, there was a significant increase in hexanoylcarnitine (C6-acylC), octanoylcarnitine (C8-acylC), decanoylcarnitine (C10-acylC), and laurylcarnitine (C12-acylC) compared with pregnant NGT control subjects (Fig. 1D–G).
Figure 1.
M-acylCs are significantly increased in subjects with GDM. Fasting plasma samples were collected from pregnant women at the time of diagnosis, and relative abundance of S-acylCs (C2) (A), M-acylCs (C6, C8, C10, and C12) (B), and L-acylCs (C14, C16, and C18) (C) were profiled using semiquantitative SRM-MS (n = 24/group). D–G: M-acylC subspecies were subsequently profiled (n = 12/group). Data are presented as mean ± SEM. *P < 0.05.
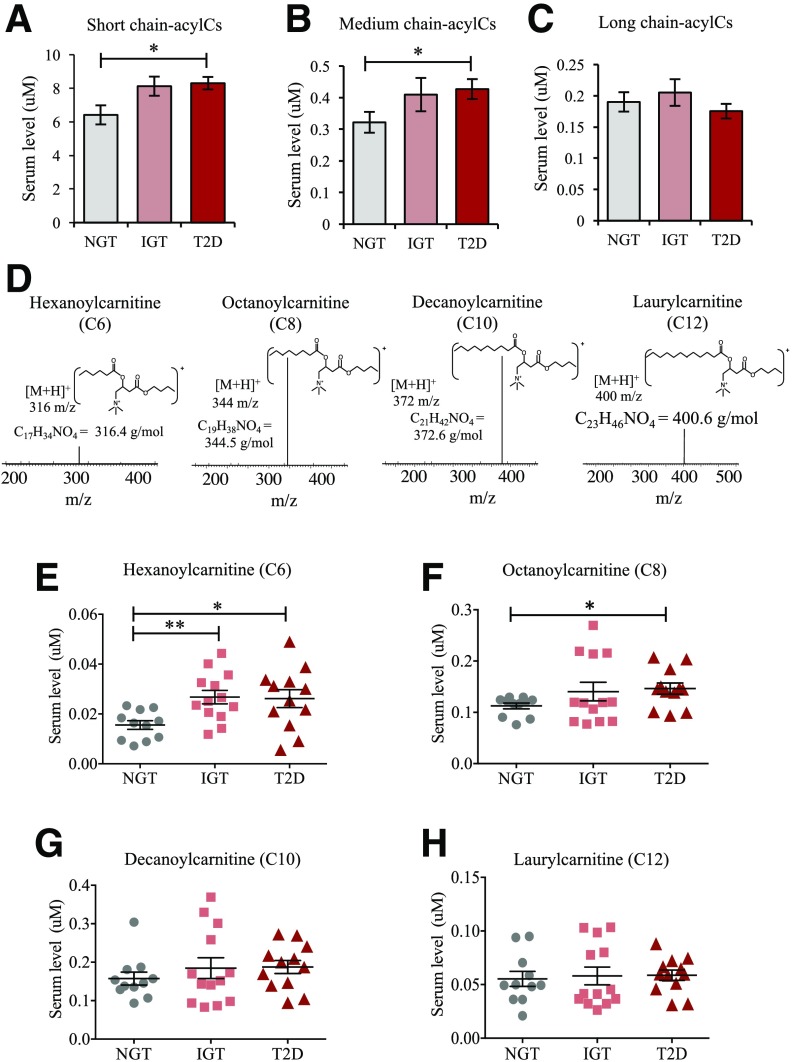
To verify that this alteration was associated with early diabetes, we used a second cohort, SWIFT, wherein women with recent GDM were monitored for 2 years postpartum. Consistent with an elevation in M-acylCs being a signature of early diabetes, we found that they were significantly higher in post-GDM women who developed new-onset T2D compared to post-GDM women who returned to NGT (Fig. 2A–C). Further targeted profiling of M-acylCs (Fig. 2D) by SRM-MS determined that C6-acylC and C8-acylC were elevated in women who transitioned to IGT and T2D after a GDM pregnancy (Fig. 2E–H). Overall, this evidence indicates that M-acylCs increase in new-onset diabetes, possibly before an elevation in L-acylCs that has been observed in established diabetes.
Figure 2.
C6- and C8-acylCs were elevated in patients with new-onset T2D. Fasting plasma samples were obtained from women with recent GDM who developed IGT or T2D or returned to NGT during a 2-year postpartum follow-up. Circulating S-acylCs (C2, C3, C4, and C5) (A), M-acylCs (C6, C8, C10, and C12) (B), and L-acylCs (C14, C16, and C18) (C) were profiled in their respective butylester form by quantitative SRM-MS (n = 11 for NGT, n = 13 for IGT, and n = 12 for T2D group) (D). E–H: M-acylC subspecies were subsequently profiled (n = 11 for NGT, n = 13 for IGT, and n = 12 for T2D group). Data are presented as mean ± SEM. *P < 0.05, **P < 0.01.
Elevated M-acylCs Impair Glucose Tolerance and GSIS
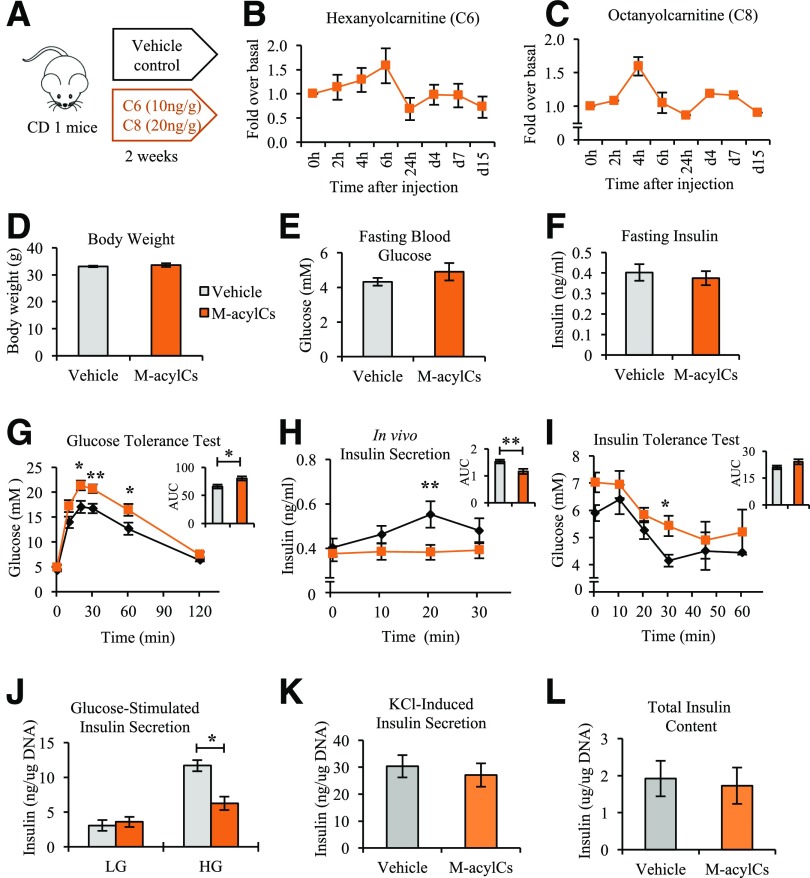
To investigate whether M-acylCs affect glucose tolerance in vivo, C6-acylC and C8-acylC were administered to mice daily for 2 weeks (Fig. 3A). Serum C6-acylC and C8-acylC reached the ∼1.5-fold increase observed in GDM at 4- to 6-h after the i.p. injection and were cleared from circulation within 24 h. Furthermore, there was no subsequent accumulation during the 2 weeks of treatment, as determined by SRM-MS (Fig. 3B and C). During this time, no change was observed in body weight, fasting blood glucose, or fasting insulin level between vehicle- and M-acylC–treated groups (Fig. 3D–F). In IPGTT, M-acylC treatment significantly decreased glucose tolerance, corresponding to an impairment in in vivo insulin secretion (Fig. 3G and H). Consistent with the known association between acylCs and insulin resistance, we found evidence of insulin resistance by IPITT (Fig. 3I), which warrants future investigation; however, here we focused on investigating the role of M-acylC on β-cell dysfunction. To determine whether the impairment in insulin secretion observed during IPGTT was due to inherent β-cell dysfunction, we isolated islets from mice treated with M-acylCs or vehicle control to measure GSIS ex vivo. Indeed, there was a significant reduction in insulin release in response to glucose stimulation in the islets isolated from M-acylC–treated mice compared with the islets of the control mice (Fig. 3J). Insulin secretion after KCl stimulation and total insulin content were unchanged between the two groups (Fig. 3K and L). Taken together, these results suggest that M-acylCs induce β-cell dysfunction, causing an impairment in GSIS without inducing an overall defect in insulin biosynthesis or maximal secretory capacity.
Figure 3.
An elevation in M-acylCs impairs glucose tolerance, insulin tolerance, and insulin secretion. During 2 weeks of M-acylC treatment administrated by i.p. injection (A), serum concentrations of C6-acylC (B) and C8-acylC (C) were measured by SRM-MS several times within the first 24 h after the first injection and thereafter 24 h after the previous injection (n = 4). We measured body weight (n = 9/group) (D), fasting blood glucose (n = 9/group) (E), and fasting insulin (n = 9/group) (F) after the 2-week treatment and performed IPGTT (n = 9/group) (G–H) and IPITT (n = 4/group) (I). G–I: Area under the curve (AUC) is shown as an inset. Islets were isolated from these mice and ex vivo GSIS (J), KCl-induced insulin secretion (K), and total insulin content (L) were also determined (n = 8/group). Data are presented as mean ± SEM. *P < 0.05, **P < 0.01.
Elevated M-acylCs Impair First- and Second-Phase Insulin Release
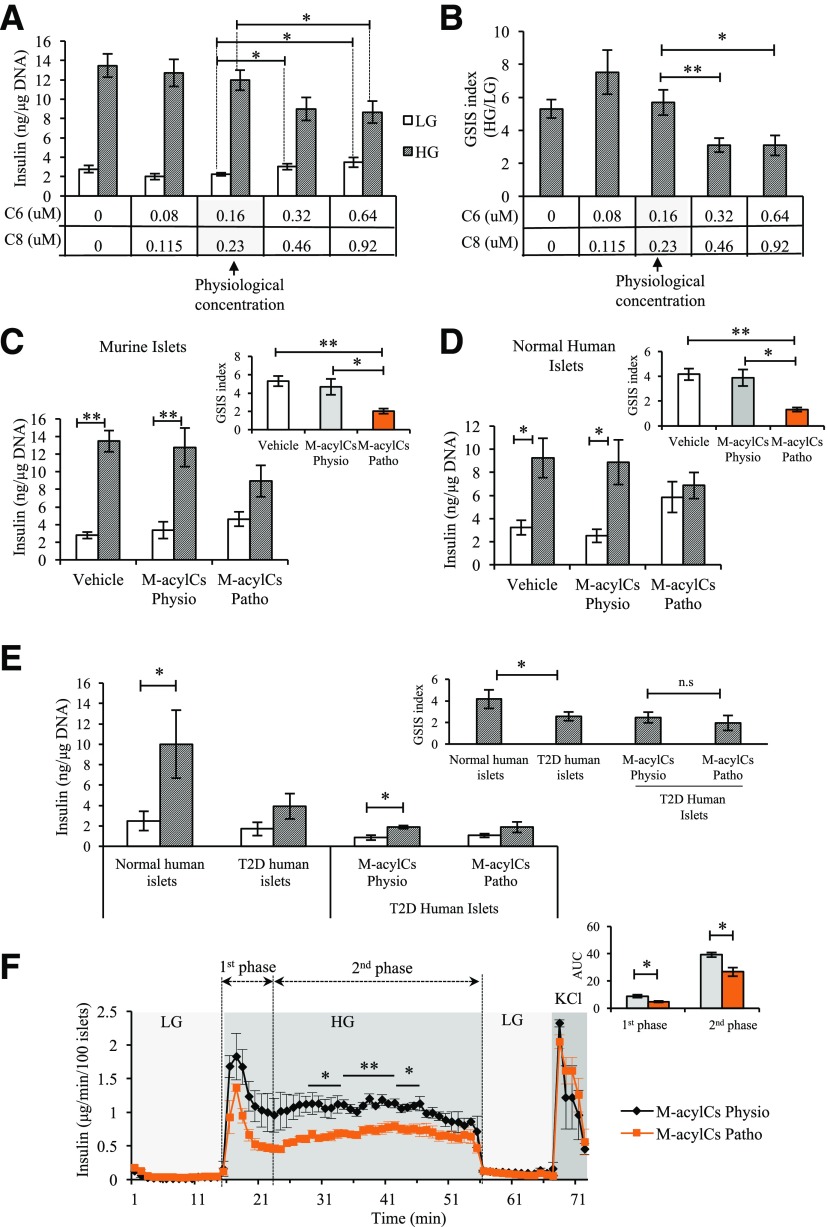
To determine the direct effect of M-acylCs on GSIS, insulin secretory function was assessed in islets treated with M-acylCs in vitro through static GSIS assay. Basal insulin secretion was significantly elevated in islets treated with two- or four-times the physiological concentration of M-acylCs compared with islets treated with the physiological concentration (Fig. 4A). After glucose stimulation, insulin secretion was impaired in islets treated with these elevated M-acylC levels (Fig. 4A and B). Based on the increases in circulating M-acylCs seen in our GDM population, we chose a concentration equivalent to 1.5-fold of the physiological concentration of C6-acylC and C8-acylC (11,25–27) as a pathological concentration for further in vitro testing. In murine and human islets, basal (LG) insulin secretion tended to be elevated with the treatment of a pathological concentration of M-acylCs compared with islets treated with a physiological concentration (Fig. 4C and D). Consistent with the in vivo and ex vivo findings, insulin release in response to HG stimulation was also suppressed in islets treated with pathological M-acylCs in vitro (Fig. 4C and D). Because the GSIS capacity is already decreased in islets from patients with T2D, we questioned whether M-acylCs could further exacerbate the impairment of GSIS in T2D human islets. Interestingly, this was not the case (Fig. 4E), suggesting that an elevation in M-acylCs does not further impair GSIS in established T2D.
Figure 4.
Elevated M-acylCs impair first- and second-phase insulin release in isolated islets. M-acylC effect on GSIS was assessed in vitro by determining its dose-dependent effect on murine islets and is shown by insulin level (A) and fold response (B) to HG (n = 5/group). Insulin secretion in murine islets (n = 6/group) (C) and normal human islets (n = 4/group) (D) after a 28-h treatment with vehicle control or M-acylCs Physio and M-acylC Patho concentrations in vitro was assessed. The fold response to HG is shown as an inset. E: Insulin secretion in normal and T2D human islets (n = 5/group) was measured. Subsequently, T2D human islets were treated with M-acylCs Physio and M-acylCs Patho concentrations and insulin secretion assay was performed (n = 3/group). Fold response is shown as an inset. F: Dynamic insulin secretion was assessed in murine islets treated with M-acylCs Physio and M-acylCs Patho concentrations in vitro (n = 3/group). Area under the curve (AUC) is shown as an inset. Data are presented as mean ± SEM. *P < 0.05, **P < 0.01; n.s, not significant.
The release of insulin from β-cells in response to glucose is a dynamic process that can logistically be separated to two phases. To evaluate this dynamic release, we measured dynamic islet insulin secretion via perifusion. There was a significant reduction in first- and second-phase insulin secretion from islets treated with M-acylCs at a pathological concentration (Fig. 4F), indicating that M-acylCs cause a defect that impairs both phases of insulin secretion.
Elevated M-acylCs Impair Glucose-Induced ATP Generation Without Altering Upstream Glucose Uptake and Glycolysis
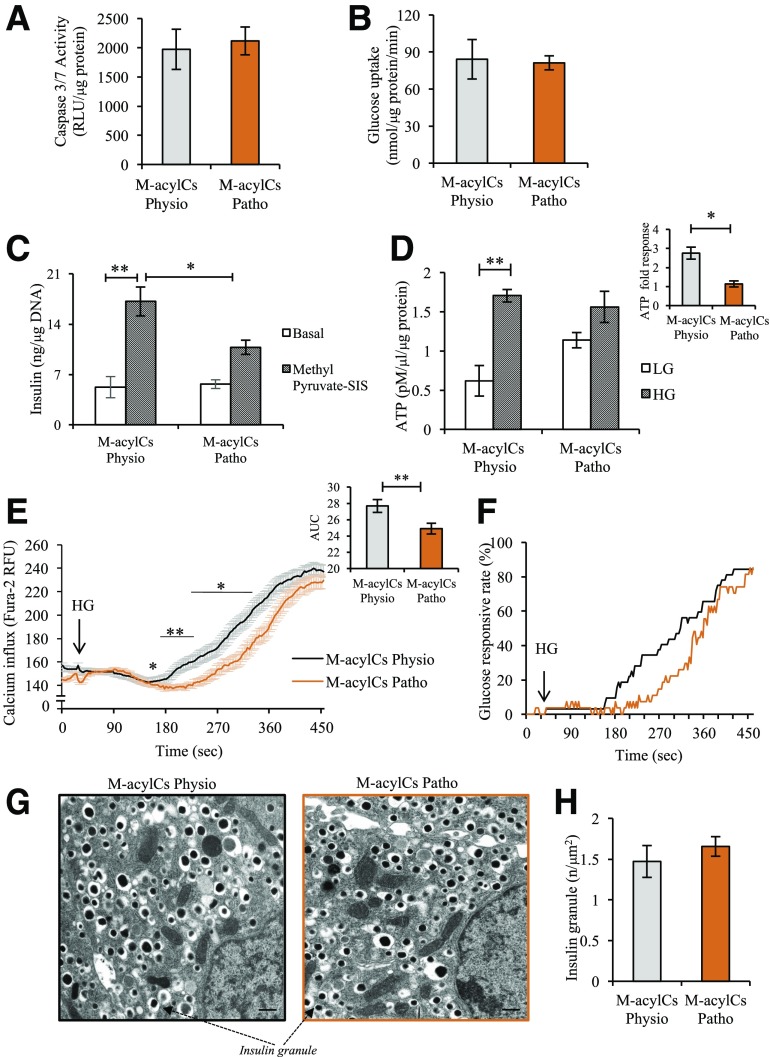
To determine how M-acylCs induce β-cell dysfunction, we first evaluated whether elevated M-acylCs simply increase islet apoptosis. Using a caspase-3/7 activity assay, we determined that there was no change between these two groups (Fig. 5A), suggesting a defect in β-cell functionality. To identify the mechanism through which M-acylCs impair GSIS, we began by analyzing glucose uptake, because this is the initial step in the insulin secretory pathway. Although there was a trend toward increased gene expression of Glut2 (Supplementary Fig. 2A) after a pathological level of M-acylC treatment, Western blot analysis showed no change in the protein level of Glut2 compared with the control group (Supplementary Fig. 2B). Consistent with this finding, there was no difference in glucose uptake between the two groups (Fig. 5B). Once inside the β-cell, glucose undergoes glycolysis, where it is converted into pyruvate. To evaluate whether an elevation in M-acylCs affects glycolysis, a methyl pyruvate–stimulated insulin secretion assay was performed. Similar to what was observed with glucose stimulation, methyl pyruvate–stimulated insulin secretion was decreased in islets treated with the pathological M-acylC concentrations compared with controls (Fig. 5C). Because the ability to metabolize pyruvate is equally compromised compared with glucose, this suggests that generation of pyruvate is not likely to be the limiting factor in impaired GSIS. Taken together, impairment in glucose uptake or glycolysis is not responsible for the M-acylC–induced impairment to insulin secretion.
Figure 5.
Elevated M-acylCs impair glucose-stimulated ATP generation. We assessed caspase-3/7 activity (n = 3/group) (A), glucose uptake (n = 3/group) (B), methyl pyruvate–stimulated insulin secretion (SIS) assay (n = 5/group) (C), and steady-state ATP level (n = 3/group) (D) in intact murine islets treated with M-acylCs Physio and M-acylCs Patho concentrations in vitro. Calcium influx imaging was performed in dispersed murine islet cells treated with M-acylCs in vitro (n = 68 and n = 84 individual cells for M-acylCs Physio and M-acylCs Patho, respectively) and presented as average calcium influx, along with area under the curve (AUC) (E), and glucose responsive rate (F), where the cells with an increase in calcium influx >1.2 times of basal calcium were counted as glucose-responsive cells. Electron microscopic imaging was performed in intact murine islets treated with M-acylCs in vitro and is presented as a representative electron microscopic image (G) and insulin granule number (n = 10/group) (H). Scale bar, 500 nm. Data are presented as mean ± SEM. *P < 0.05, **P < 0.01. RFU, relative fluorescence units; RLU, relative luminescence units.
ATP is the end product of glucose metabolism, and its concentration is critical for GSIS. Thus, we next quantified ATP accumulation in response to glucose stimulation. The ATP concentration under basal (LG) conditions tended to be higher in islets treated with an elevated concentration of M-acylCs compared with controls (Fig. 5D) than those treated with a physiological concentration, consistent with the previously observed increase in basal insulin secretion (Fig. 4A–D). Upon glucose stimulation, islets treated with an elevated concentration of M-acylCs increased their ATP concentration to similar levels as controls, as assessed by this assay; however, the fold response was significantly reduced in islets treated with a pathological level of M-acylCs compared with the treatment with a physiological concentration (Fig. 5D). Because the impaired induction of ATP accumulation in the presence of glucose suggests impaired stimulus-secretion coupling, we assessed whether M-acylCs also influence cytosolic calcium influx after glucose stimulation in dispersed murine islet cells. Average calcium influx and its area under the curve were decreased after M-acylC treatment at a pathological concentration compared with the physiological concentration (Fig. 5E), as was the glucose response rate (Fig. 5F), although there was no change to the number of the glucose-responsive cells (Supplementary Fig. 2C). Lastly, we assessed insulin granule content and found no difference between the groups (Fig. 5G and H), which is consistent with the previous observation of no difference in total insulin content. Altogether, these data suggest that a pathological concentration of M-acylCs reduces the fold response in ATP production upon glucose stimulation in the pancreatic β-cell, leading to impaired calcium influx and ultimately resulting in reduced GSIS.
Elevated M-acylCs Induce Mitochondrial Dysfunction, Resulting in Decreased Respiratory Capacity Without Structural Alteration
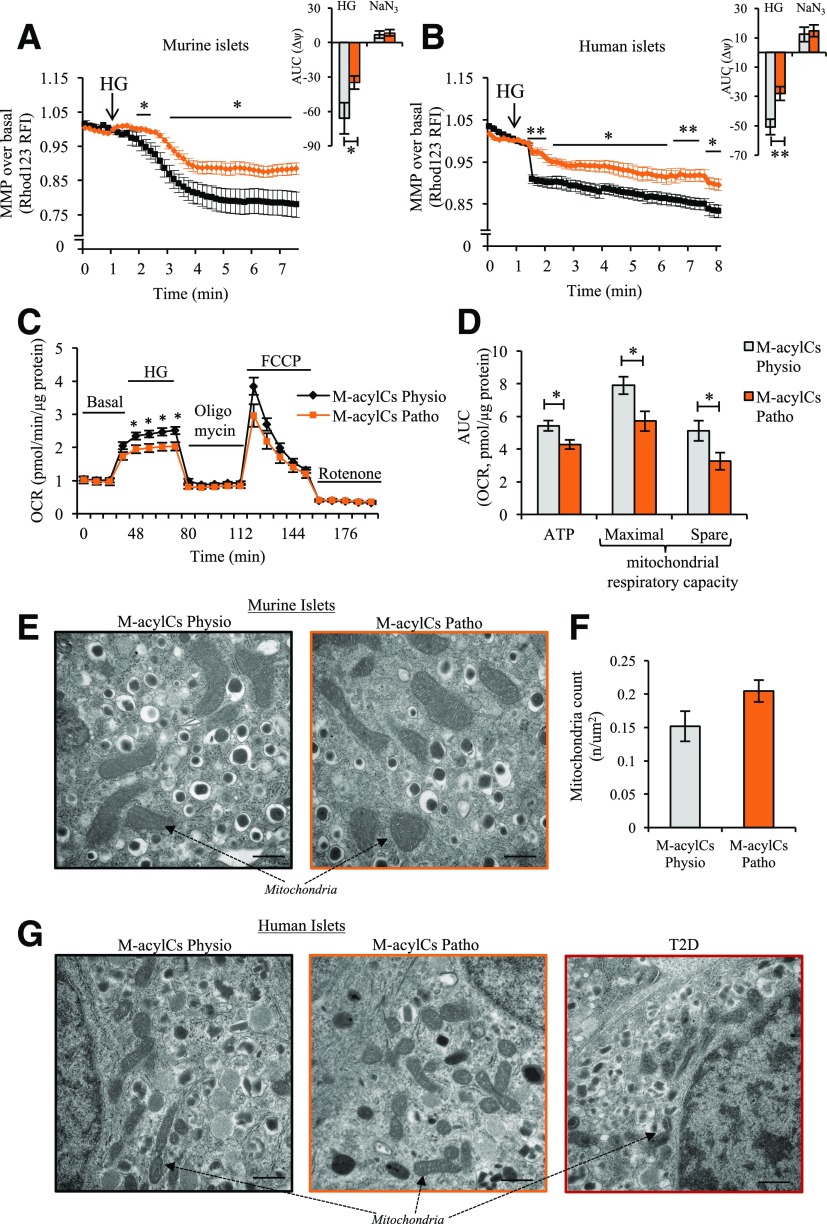
Oxidative phosphorylation produces a proton gradient across the inner mitochondrial membrane that hyperpolarizes the mitochondrial membrane and drives ATP production (29,30). We therefore further assessed mitochondrial function by measuring changes in MMP (Δψm) using rhodamine 123 (Rh123) under HG stimulation in murine and human islets. Islets treated with a physiological concentration of M-acylCs exhibited a hyperpolarization of MMP upon glucose stimulation, whereas the Δ change was significantly reduced in murine (Fig. 6A) and human (Fig. 6B) islets treated with a pathological concentration of M-acylCs. We also evaluated the oxygen consumption rate (OCR) in murine islets using a Seahorse metabolic flux analyzer. Consistent with changes in MMP, the OCR in response to glucose was significantly reduced in islets treated with the pathological concentration of M-acylCs compared with islets treated with the physiological concentration (Fig. 6C). Further evaluation showed that HG-induced ATP production, mitochondrial maximal respiration, and spare respiratory capacity (Fig. 6D) were all significantly reduced in islets treated with elevated M-acylCs, suggesting an increase in M-acylCs impairs the ability of the mitochondria to adequately respond to increased energy demand.
Figure 6.
Elevated M-acylCs cause mitochondrial dysfunction. We measured MMP in intact murine (n = 10/group) (A) and human (n = 6/group) islets (B) treated with M-acylCs Physio and M-acylCs Patho concentrations in vitro. Area under the curve (AUC) is shown as an inset. OCR was measured by Seahorse metabolic flux analyzer (C), and mitochondrial functional parameters were calculated (n = 7/group) (D). Finally mitochondrial structure was evaluated in murine islets (E) along with the mitochondrial count (n = 10/group) (F) and in human islets treated with M-acylCs Physio and M-acylCs Patho concentrations in vitro and islets from patients with T2D (G). Scale bar, 500 nm. Data are presented as mean ± SEM. *P < 0.05, **P < 0.01. FCCP, carbonylcyanide-4-(triflouromethoxy)-phenylhydrazone; RFI, relative fluorescence intensity.
To evaluate whether altered OCR was due to changes in structure and number of mitochondria, we performed electron microscopic imaging on islets treated in vitro and observed no visual anatomical changes to the mitochondria (Fig. 6E) and no differences in total mitochondrial number (Fig. 6F). These results were consistently observed in human islets (Fig. 6G). Altogether, M-acylCs cause a functional alteration in mitochondria as shown by a decreased respiratory capacity and therefore limited ability to respond to glucose stimulation without affecting mitochondrial structure and number.
Elevated M-acylCs Cause Post-TCA Cycle Defects, Including the Downregulation of Mitochondrial Complex V Abundance
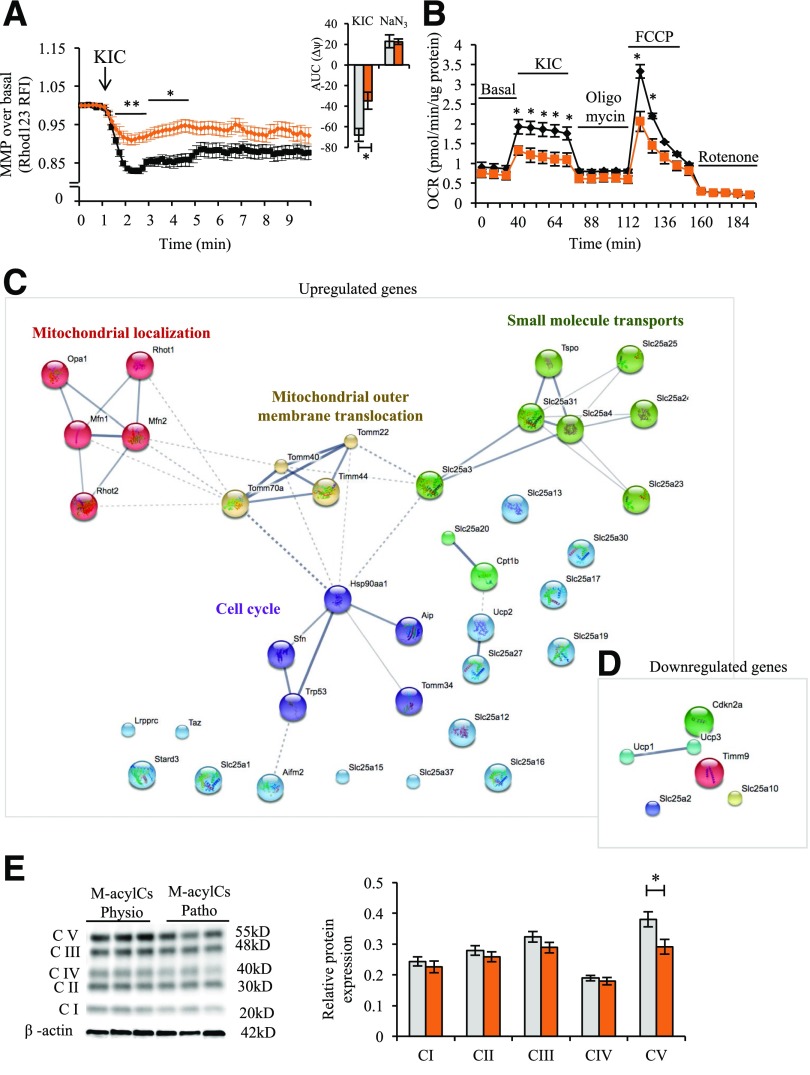
To determine where the M-acylC–induced mitochondrial defect resides, we performed MMP measurements and metabolic flux analysis using KIC as a substrate instead of glucose. Unlike glucose, KIC is metabolized exclusively in the mitochondria and enters the TCA cycle directly to produce ATP and subsequently stimulate insulin secretion. In islets treated with a physiological concentration of M-acylCs, there was hyperpolarization of the MMP with KIC stimulation, whereas the hyperpolarization was diminished in islets treated with a pathological concentration of M-acylC (Fig. 7A). Consistent with these results, the Seahorse metabolic flux analysis showed a reduction in OCR upon KIC stimulation in islets treated with pathological levels of M-acylCs (Fig. 7B). These results indicate that the mitochondrial defect caused by elevated M-acylCs lies post-TCA cycle. Next, to find possible molecular targets of elevated M-acylCs, we used a mitochondria-targeted gene array that enables analysis of the expression of 87 genes related to mitochondrial function. Pathway enrichment analysis showed five prominent clusters, including the upregulation of genes that are involved in the processes of mitochondrial localization, mitochondrial outer membrane translocation, cell cycle, and small molecule transport (Fig. 7C) and the downregulation of genes involved in mitochondrial uncoupling (Fig. 7D and Supplementary Fig. 4A and B). In addition, we further explored the effect of M-acylCs by evaluating mitochondrial complex abundance. We observed a significant reduction in protein expression of complex V, also known as ATP synthase (Fig. 7E). The reduction in mitochondrial complex V abundance, together with alterations in a subset of small molecule transporters, may explain the decreased mitochondrial respiratory capacity and insufficient production of ATP in response to glucose, resulting in impaired GSIS.
Figure 7.
M-acylCs decrease mitochondrial complex V expression. KIC-stimulated MMP (n = 3 for M-acylCs Physio and n = 4 for M-acylCs Patho group) (A) and KIC-stimulated OCR (n = 3/group) (B) were measured in murine islets after 28-h treatment with M-acylCs. The area under the curve (AUC) is shown as an inset. Mitochondrial gene array was performed in murine islets treated with M-acylCs in vitro, and the genes upregulated (C) and downregulated (D) >1.2 times are shown in a cluster (n = 3/group). Protein expression of oxidative phosphorylation was evaluated in murine islets treated with M-acylCs in vitro and is presented as a representative Western blot of mitochondrial complex (E) and its quantification (n = 6/group). Data are presented as mean ± SEM. *P < 0.05, **P < 0.01. FCCP, carbonylcyanide-4-(trifluoromethoxy)-phenylhydrazone; RFI, relative fluorescence intensity.
Discussion
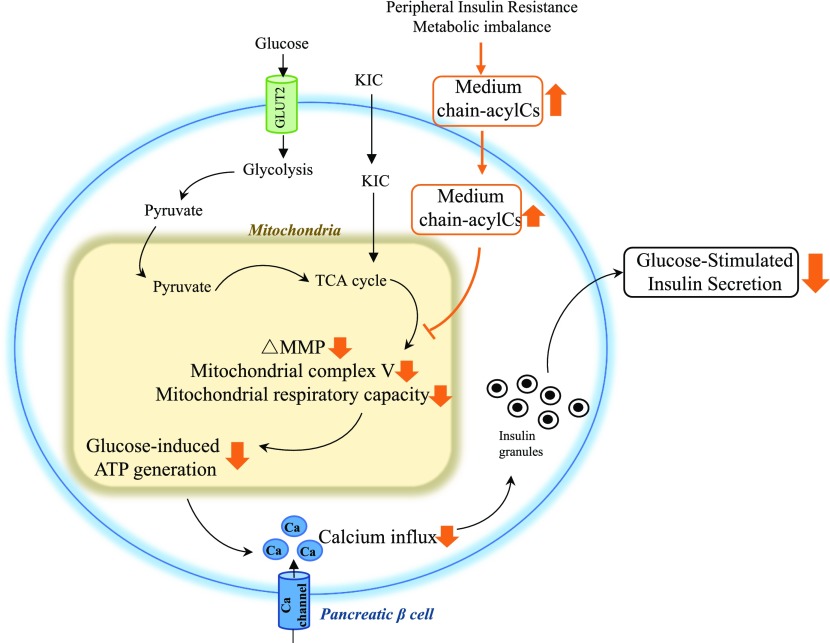
In this study, we provide a comprehensive examination of plasma acylCs in women with GDM and postpartum women with recent GDM who later developed new-onset IGT or T2D compared with women who returned to NGT. We also explored their potential role in pancreatic β-cell dysfunction (Fig. 8). AcylC metabolism has been widely examined in the context of T2D. A previous study reported elevated plasma acylCs, including M-acylCs (C6, C8, C10) and L-acylCs (C14, C18: 1) in African American women with T2D (7), and another study showed that patients with T2D present with higher levels of circulating free carnitine and several S-acylCs (C3, C4, C5), M-acylCs (C6, C8, C10:1), and L-acylCs (C14:1, C16, C18, C18:1) (9). However, a complete profiling of acylCs in patients with GDM has been studied to a lesser extent. Our study found most of the altered acylCs in GDM and newly diagnosed T2D were M-acylCs without alteration in L-acylCs. We speculate that in early diabetes, cells are minimally compromised, thus L-acylCs can be reduced to M-acylCs and S-acylCs, which causes these acylCs to be the first to accumulate. As the impairment progresses, L-acylCs are no longer able to be metabolized, causing an elevation in L-acylCs in overt diabetes. With further profiling of M-acylC subspecies in our cohorts, C6-acylC and C8-acylC were consistently increased in both groups with diabetes, whereas the increase in C6-acylC started in the prediabetes (IGT) stage. This change observed in IGT patients was not consistent with a previous study that had shown no change in M-acylCs (11). The conflicting result between our study and the previous study might be due to difference in the sex and ethnicity of the study population. Our study focused on women; thus, whether a change in M-acylCs is seen in men remains to be investigated. Considering that a history of GDM is the top risk factor for future development of T2D in women during the childbearing years (1–4), our findings provide insight into the early stages of T2D development in relatively healthy young women with few comorbidities.
Figure 8.
Diagram of M-acylC effect on β-cell function. M-acylCs act directly on the β-cell, decreasing MMP, mitochondrial complex V expression, and mitochondrial respiratory capacity, ultimately reducing glucose-induced ATP production. This results in insufficient calcium flux, suppressing GSIS.
A number of studies have reported an association between the accumulation of acylCs, particularly L-acylCs, and insulin resistance (5–7,31,32). Therefore, major attention has been directed to L-acylCs. In contrast, the current study found no significant change in L-acylCs in women with GDM, IGT, or T2D compared with their respective NGT control groups. A number of studies have explained the underlying relationship between acylCs and insulin resistance is due to increased ROS (33–37); however, the effect of M-acylCs observed in our study is likely occurring through a different mechanism, because ROS levels were unchanged between islets treated with physiological or pathological concentrations of M-acylCs (Supplementary Fig. 2D). Based on our observation that M-acylCs are significantly increased in GDM and new-onset T2D, presumably before the rise in L-acylCs seen in established T2D, we hypothesize that M-acylCs may be an early marker and driver of β-cell dysfunction during the transition from GDM to T2D. Supporting our hypothesis, 2 weeks of treatment with M-acylCs IGT and corresponding insulin secretion in mice. As mentioned above, acylCs are known to induce insulin resistance; as such, this effect of glucose intolerance could be due to an indirect effect on β-cell function. However, in vitro treatment of isolated human and murine islets with pathological concentrations of M-acylCs decreases GSIS in the first and second phases, indicating that M-acylCs may directly affect the capacity of β-cells to release insulin upon glucose stimulation. Furthermore, a recent study showed that one L-acylC, stearoylcarnitine, impaired insulin synthesis in β-cells (13), whereas our study found that M-acylCs impair GSIS without altering insulin synthesis. The failure of insulin secretion in response to glucose is an early indicator of β-cell dysfunction in new-onset diabetes, and eventually, insulin synthesis is impaired as the disease progresses over time.
Previous studies have reported a lower mitochondrial number and volume and reduced substrate oxidation capacity in T2D (38–43). Thus, most discussions on the association between increased acylCs and diabetes have centered on incomplete mitochondrial oxidation due to peripheral tissue insulin resistance, resulting in L-acylC accumulation. However, our findings suggest that higher M-acylCs may have a causal role by directly affecting pancreatic β-cell function. Mechanistically, using Seahorse metabolic flux analysis, we demonstrate an impaired capacity of islets to increase ATP production upon glucose stimulation when treated with an elevated concentration of M-acylCs. Higher basal ATP levels in islets, as determined by static ATP assay after M-acylC treatment at pathological concentrations, is probably responsible for the observed higher basal insulin release, a phenomenon also observed in patients with diabetes. In T2D, there is often inappropriately elevated basal insulin secretion and blunted GSIS (44–47). M-acylCs seem to have this dual effect on insulin secretion. The fact that the mitochondrial maximal respiratory capacity and spare respiratory capacity are decreased after pathological M-acylC treatment suggests that the mitochondria has less capacity to cope with the increased energy demand, shown as reduced ATP production upon glucose stimulation, and is thus unable to respond properly when stimulated with HG. In addition, the decreases in MMP and OCR in response to KIC stimulation with elevated M-acylC treatment indicates that the mitochondrial defect may reside after the TCA cycle and may be linked to the downregulation of mitochondrial complex V expression. This supports the previous observation that an accumulation of L-acylCs is negatively correlated with metabolites produced through oxidative phosphorylation (13). The alteration in complex V that we observed may not be sufficient to affect ATP production at the basal level but decreases the mitochondrial responsive capacity when the energy demand is increased, such as under HG conditions. This is supported by the mitochondrial functional assays performed with the Seahorse metabolic flux analyzer.
In summary, we have revealed that women with GDM and new-onset T2D that we have studied here have elevated circulating M-acylCs without alterations in their L-acylC profile. An equivalent elevation in M-acylCs impairs glucose tolerance in vivo in a murine model. Mechanistically, M-acylCs can act directly on pancreatic β-cells, decreasing glucose-induced ATP production and mitochondrial capacity to keep up with energy demand, resulting in suppression of GSIS. Our study thus provides a novel link between circulating M-acylCs and pancreatic β-cell dysfunction.
Supplementary Material
Article Information
Acknowledgments. The authors thank the Islet Core and Clinical Islet Laboratory (Alberta Islet Distribution Program, University of Alberta) and the Multi-Organ Transplant/University Health Network Islet Isolation Program (University Health Network, Toronto, Ontario, Canada) for providing the human islets from review board–approved donors. The authors also thank Drs. Lisa Strug and Weili Li (Centre for Applied Genomics, The Hospital for Sick Children, Toronto, Ontario, Canada) for their helpful consultations regarding the statistical analysis.
Funding. B.B. and H.M. were supported by Banting & Best Diabetes Center postdoctoral fellowship awards. K.J.P. was supported by a Canadian Institutes of Health Research doctoral research award. J.A.E. was supported by Banting & Best Diabetes Center and Ontario Graduate Scholarships. This study was funded by a Canadian Institutes of Health Research operating grant (FDN-143219) to M.B.W. The SWIFT study was funded by the Eunice Kennedy Shriver National Institute of Child Health and Human Development (R01-HD-050625, R01-HD-050625-03S1, and R01-HD-050625-05S). This project was also partly supported by the National Institutes of Health National Center for Research Resources University of California, San Francisco–Clinical & Translational Science Institute (UL1-RR-024131) and the Kaiser Permanente Community Benefit Program (Northern California). Some of the equipment used in this study was provided by the Diabetes Core Lab funded by the Canadian Foundation for Innovation and Ontario Research Fund (project number 30961).
Duality of Interest. No potential conflicts of interest relevant to this article were reported.
Author Contributions. B.B. conducted experiments, acquired data, analyzed data, and wrote and edited the manuscript. B.B., E.P.G., Y.L., and M.B.W. designed the study. D.A.R. analyzed data and reviewed and edited the manuscript. K.J.P. reviewed and edited the manuscript and contributed to the discussion. J.A.E., E.B., H.M., A.B., and Y.L. conducted experiments and reviewed and edited the manuscript. E.P.G. and M.B.W. reviewed and edited the manuscript and contributed to the study design, interpretation of the findings, and discussion. B.B. is the guarantor of this work and, as such, had full access to all the data in the study and takes responsibility for the integrity of the data and the accuracy of the data analysis.
Footnotes
This article contains Supplementary Data online at http://diabetes.diabetesjournals.org/lookup/suppl/doi:10.2337/db17-1150/-/DC1.
References
- 1.Kim C, Newton KM, Knopp RH. Gestational diabetes and the incidence of type 2 diabetes: a systematic review. Diabetes Care 2002;25:1862–1868 [DOI] [PubMed] [Google Scholar]
- 2.Ferrara A. Increasing prevalence of gestational diabetes mellitus: a public health perspective. Diabetes Care 2007;30(Suppl. 2):S141–S146 [DOI] [PubMed] [Google Scholar]
- 3.Pastore I, Chiefari E, Vero R, Brunetti A. Postpartum glucose intolerance: an updated overview. Endocrine 2018;59:481–494 [DOI] [PubMed] [Google Scholar]
- 4.Bellamy L, Casas JP, Hingorani AD, Williams D. Type 2 diabetes mellitus after gestational diabetes: a systematic review and meta-analysis. Lancet 2009;373:1773–1779 [DOI] [PubMed] [Google Scholar]
- 5.Boden G. Effects of free fatty acids (FFA) on glucose metabolism: significance for insulin resistance and type 2 diabetes. Exp Clin Endocrinol Diabetes 2003;111:121–124 [DOI] [PubMed] [Google Scholar]
- 6.Samuel VT, Shulman GI. Mechanisms for insulin resistance: common threads and missing links. Cell 2012;148:852–871 [DOI] [PMC free article] [PubMed] [Google Scholar]
- 7.Adams SH, Hoppel CL, Lok KH, et al. Plasma acylcarnitine profiles suggest incomplete long-chain fatty acid beta-oxidation and altered tricarboxylic acid cycle activity in type 2 diabetic African-American women. J Nutr 2009;139:1073–1081 [DOI] [PMC free article] [PubMed] [Google Scholar]
- 8.Möder M, Kiessling A, Löster H, Brüggemann L. The pattern of urinary acylcarnitines determined by electrospray mass spectrometry: a new tool in the diagnosis of diabetes mellitus. Anal Bioanal Chem 2003;375:200–210 [DOI] [PubMed] [Google Scholar]
- 9.Mihalik SJ, Goodpaster BH, Kelley DE, et al. Increased levels of plasma acylcarnitines in obesity and type 2 diabetes and identification of a marker of glucolipotoxicity. Obesity (Silver Spring) 2010;18:1695–1700 [DOI] [PMC free article] [PubMed] [Google Scholar]
- 10.Reuter SE, Evans AM. Carnitine and acylcarnitines: pharmacokinetic, pharmacological and clinical aspects. Clin Pharmacokinet 2012;51:553–572 [DOI] [PubMed] [Google Scholar]
- 11.Mai M, Tönjes A, Kovacs P, Stumvoll M, Fiedler GM, Leichtle AB. Serum levels of acylcarnitines are altered in prediabetic conditions. PLoS One 2013;8:e82459. [DOI] [PMC free article] [PubMed] [Google Scholar]
- 12.Björntorp P, Bergman H, Varnauskas E. Plasma free fatty acid turnover rate in obesity. Acta Med Scand 1969;185:351–356 [DOI] [PubMed] [Google Scholar]
- 13.Aichler M, Borgmann D, Krumsiek J, et al. N-acyl taurines and acylcarnitines cause an imbalance in insulin synthesis and secretion provoking β cell dysfunction in type 2 diabetes. Cell Metab 2017;25:1334–1347.e4 [DOI] [PubMed] [Google Scholar]
- 14.Koves TR, Ussher JR, Noland RC, et al. Mitochondrial overload and incomplete fatty acid oxidation contribute to skeletal muscle insulin resistance. Cell Metab 2008;7:45–56 [DOI] [PubMed] [Google Scholar]
- 15.Schulz H. Beta oxidation of fatty acids. Biochim Biophys Acta 1991;1081:109–120 [DOI] [PubMed] [Google Scholar]
- 16.Balaban RS. Regulation of oxidative phosphorylation in the mammalian cell. Am J Physiol 1990;258:C377–C389 [DOI] [PubMed] [Google Scholar]
- 17.Idell-Wenger JA, Grotyohann LW, Neely JR. Coenzyme A and carnitine distribution in normal and ischemic hearts. J Biol Chem 1978;253:4310–4318 [PubMed] [Google Scholar]
- 18.Prentice KJ, Luu L, Allister EM, et al. The furan fatty acid metabolite CMPF is elevated in diabetes and induces β cell dysfunction. Cell Metab 2014;19:653–666 [DOI] [PubMed] [Google Scholar]
- 19.Allister EM, Robson-Doucette CA, Prentice KJ, et al. UCP2 regulates the glucagon response to fasting and starvation. Diabetes 2013;62:1623–1633 [DOI] [PMC free article] [PubMed] [Google Scholar]
- 20.Gunderson EP, Hurston SR, Ning X, et al.; Study of Women, Infant Feeding and Type 2 Diabetes After GDM Pregnancy Investigators . Lactation and progression to type 2 diabetes mellitus after gestational diabetes mellitus: a prospective cohort study. Ann Intern Med 2015;163:889–898 [DOI] [PMC free article] [PubMed] [Google Scholar]
- 21.Gunderson EP, Matias SL, Hurston SR, et al. Study of Women, Infant Feeding, and Type 2 diabetes mellitus after GDM pregnancy (SWIFT), a prospective cohort study: methodology and design. BMC Public Health 2011;11:952. [DOI] [PMC free article] [PubMed] [Google Scholar]
- 22.Allalou A, Nalla A, Prentice KJ, et al. A predictive metabolic signature for the transition from gestational diabetes mellitus to type 2 diabetes. Diabetes 2016;65:2529–2539 [DOI] [PMC free article] [PubMed] [Google Scholar]
- 23.Liu Y, Prentice KJ, Eversley JA, et al. Rapid elevation in CMPF may act as a tipping point in diabetes development. Cell Reports 2016;14:2889–2900 [DOI] [PubMed] [Google Scholar]
- 24.Luu L, Dai FF, Prentice KJ, et al. The loss of Sirt1 in mouse pancreatic beta cells impairs insulin secretion by disrupting glucose sensing. Diabetologia 2013;56:2010–2020 [DOI] [PubMed] [Google Scholar]
- 25.Psychogios N, Hau DD, Peng J, et al. The human serum metabolome. PLoS One 2011;6:e16957. [DOI] [PMC free article] [PubMed] [Google Scholar]
- 26.Bene J, Márton M, Mohás M, et al. Similarities in serum acylcarnitine patterns in type 1 and type 2 diabetes mellitus and in metabolic syndrome. Ann Nutr Metab 2013;62:80–85 [DOI] [PubMed] [Google Scholar]
- 27.Bene J, Komlósi K, Gasztonyi B, Juhász M, Tulassay Z, Melegh B. Plasma carnitine ester profile in adult celiac disease patients maintained on long-term gluten free diet. World J Gastroenterol 2005;11:6671–6675 [DOI] [PMC free article] [PubMed] [Google Scholar]
- 28.Massumi M, Pourasgari F, Nalla A, et al. An abbreviated protocol for in vitro generation of functional human embryonic stem cell-derived beta-like cells. PLoS One 2016;11:e0164457. [DOI] [PMC free article] [PubMed] [Google Scholar]
- 29.Heart E, Corkey RF, Wikstrom JD, Shirihai OS, Corkey BE. Glucose-dependent increase in mitochondrial membrane potential, but not cytoplasmic calcium, correlates with insulin secretion in single islet cells. Am J Physiol Endocrinol Metab 2006;290:E143–E148 [DOI] [PubMed] [Google Scholar]
- 30.Mai N, Chrzanowska-Lightowlers ZM, Lightowlers RN. The process of mammalian mitochondrial protein synthesis. Cell Tissue Res 2017;367:5–20 [DOI] [PMC free article] [PubMed] [Google Scholar]
- 31.Bomba-Opon D, Wielgos M, Szymanska M, Bablok L. Effects of free fatty acids on the course of gestational diabetes mellitus. Neuroendocrinol Lett 2006;27:277–280 [PubMed] [Google Scholar]
- 32.Holland WL, Knotts TA, Chavez JA, Wang LP, Hoehn KL, Summers SA. Lipid mediators of insulin resistance. Nutr Rev 2007;65:S39–S46 [DOI] [PubMed] [Google Scholar]
- 33.Paolisso G, Gambardella A, Tagliamonte MR, et al. Does free fatty acid infusion impair insulin action also through an increase in oxidative stress? J Clin Endocrinol Metab 1996;81:4244–4248 [DOI] [PubMed] [Google Scholar]
- 34.Anderson EJ, Lustig ME, Boyle KE, et al. Mitochondrial H2O2 emission and cellular redox state link excess fat intake to insulin resistance in both rodents and humans. J Clin Invest 2009;119:573–581 [DOI] [PMC free article] [PubMed] [Google Scholar]
- 35.Houstis N, Rosen ED, Lander ES. Reactive oxygen species have a causal role in multiple forms of insulin resistance. Nature 2006;440:944–948 [DOI] [PubMed] [Google Scholar]
- 36.Nakamura S, Takamura T, Matsuzawa-Nagata N, et al. Palmitate induces insulin resistance in H4IIEC3 hepatocytes through reactive oxygen species produced by mitochondria. J Biol Chem 2009;284:14809–14818 [DOI] [PMC free article] [PubMed] [Google Scholar]
- 37.Chen L, Na R, Gu M, et al. Reduction of mitochondrial H2O2 by overexpressing peroxiredoxin 3 improves glucose tolerance in mice. Aging Cell 2008;7:866–878 [DOI] [PMC free article] [PubMed] [Google Scholar]
- 38.Petersen KF, Dufour S, Befroy D, Garcia R, Shulman GI. Impaired mitochondrial activity in the insulin-resistant offspring of patients with type 2 diabetes. N Engl J Med 2004;350:664–671 [DOI] [PMC free article] [PubMed] [Google Scholar]
- 39.Morino K, Petersen KF, Dufour S, et al. Reduced mitochondrial density and increased IRS-1 serine phosphorylation in muscle of insulin-resistant offspring of type 2 diabetic parents. J Clin Invest 2005;115:3587–3593 [DOI] [PMC free article] [PubMed] [Google Scholar]
- 40.Kelley DE, He J, Menshikova EV, Ritov VB. Dysfunction of mitochondria in human skeletal muscle in type 2 diabetes. Diabetes 2002;51:2944–2950 [DOI] [PubMed] [Google Scholar]
- 41.Ritov VB, Menshikova EV, He J, Ferrell RE, Goodpaster BH, Kelley DE. Deficiency of subsarcolemmal mitochondria in obesity and type 2 diabetes. Diabetes 2005;54:8–14 [DOI] [PubMed] [Google Scholar]
- 42.Mogensen M, Sahlin K, Fernström M, et al. Mitochondrial respiration is decreased in skeletal muscle of patients with type 2 diabetes. Diabetes 2007;56:1592–1599 [DOI] [PubMed] [Google Scholar]
- 43.Lu H, Koshkin V, Allister EM, Gyulkhandanyan AV, Wheeler MB. Molecular and metabolic evidence for mitochondrial defects associated with beta-cell dysfunction in a mouse model of type 2 diabetes. Diabetes 2010;59:448–459 [DOI] [PMC free article] [PubMed] [Google Scholar]
- 44.LeRoith D. Beta-cell dysfunction and insulin resistance in type 2 diabetes: role of metabolic and genetic abnormalities. Am J Med 2002;113(Suppl. 6A):3S–11S [DOI] [PubMed] [Google Scholar]
- 45.Weir GC, Bonner-Weir S. Five stages of evolving beta-cell dysfunction during progression to diabetes. Diabetes 2004;53(Suppl. 3):S16–S21 [DOI] [PubMed] [Google Scholar]
- 46.Porte D Jr, Kahn SE. Beta-cell dysfunction and failure in type 2 diabetes: potential mechanisms. Diabetes 2001;50(Suppl. 1):S160–S163 [DOI] [PubMed] [Google Scholar]
- 47.Shanik MH, Xu Y, Skrha J, Dankner R, Zick Y, Roth J. Insulin resistance and hyperinsulinemia: is hyperinsulinemia the cart or the horse? Diabetes Care 2008;31(Suppl. 2):S262–S268 [DOI] [PubMed] [Google Scholar]
Associated Data
This section collects any data citations, data availability statements, or supplementary materials included in this article.


