

Abstract
Stem cell fate can be influenced by metabolite levels in culture but it is unknown whether physiological variations in metabolite levels in normal tissues regulate stem cell function in vivo. We developed a metabolomics method for analysis of rare cell populations isolated directly from tissues and used it to compare haematopoietic stem cells (HSCs) to restricted haematopoietic progenitors. Each haematopoietic cell type had a distinct metabolic signature. Human and mouse HSCs had unusually high levels of ascorbate, which declined with differentiation. Systemic ascorbate depletion in mice increased HSC frequency and function, partly by reducing Tet2 function, a dioxygenase tumor suppressor. Ascorbate depletion cooperated with Flt3ITD leukaemic mutations to accelerate leukaemogenesis, though cell-autonomous and possibly non-cell-autonomous mechanisms, in a manner that was reversed by dietary ascorbate. Ascorbate acted cell-autonomously to negatively regulate HSC function and myelopoiesis through Tet2-dependent and Tet2-independent mechanisms. Ascorbate thus accumulates within HSCs to promote Tet function in vivo, limiting HSC frequency and suppressing leukaemogenesis.
A fundamental question is whether physiological variations in metabolite levels influence stem cell fate, tissue homeostasis, and tumour suppression. Genetic changes in metabolic enzymes can alter stem cell function1 and cause oncogenic transformation2. Dietary changes alter stem cell function in multiple systems by regulating signalling, for example by insulin/IGF3. It is generally unknown whether dietary changes alter stem cell function due to changes in metabolite levels; however, muscle stem cell aging is regulated by changes in NAD+ levels4. Differentiation in vivo is accompanied by metabolic changes5 and experimental manipulation of metabolite levels in culture can modulate pluripotent stem cell differentiation6–8. However, it is less clear whether physiological variation in metabolite levels in vivo influences stem cell fate.
Studies of stem cell metabolism have been limited by the fact that metabolomics is typically performed using millions of cells and it is generally impossible to isolate that many stem cells directly from tissues. Metabolomics has been performed on haematopoietic stem/progenitor cells either by isolating large numbers of heterogeneous Lineage−Sca-1+c-kit+ (LSK) cells9 or by pooling HSCs from 120 mice to perform a single experiment10. Others have studied stem cell metabolism by characterizing the phenotypes of knockout mice or metabolism in culture11. However, it has been difficult to routinely compare metabolite levels within rare cell populations in tissues. To address this we optimized the sensitivity of metabolomics.
Metabolomics in rare cell populations
We performed metabolomics in rare cell populations by combining rapid cell isolation by flow cytometry with liquid chromatography-mass spectrometry (Extended Data Fig. 1a). Cells were kept cold during cell purification and the levels of most metabolites remained stable during cell purification (Extended Data Fig. 1b–f). We detected approximately 60 metabolites, covering a range of metabolic pathways, from 10,000 HSCs (Extended Data Fig. 2a).
We compared CD150+CD48−LSK HSCs and CD150−CD48−LSK multipotent progenitors (MPPs) to a variety of restricted haematopoietic progenitors isolated from mouse bone marrow (Fig. 1a). HSCs and MPPs did not differ in the metabolites we measured (Extended Data Fig. 2b) but did differ from all restricted progenitor populations (Fig. 1a). Almost all the metabolites we detected exhibited distinct enrichment patterns in different cell types (Extended Data Fig. 2c–d). Therefore, even lineally related cells within a similar in vivo environment exhibit metabolic differences.
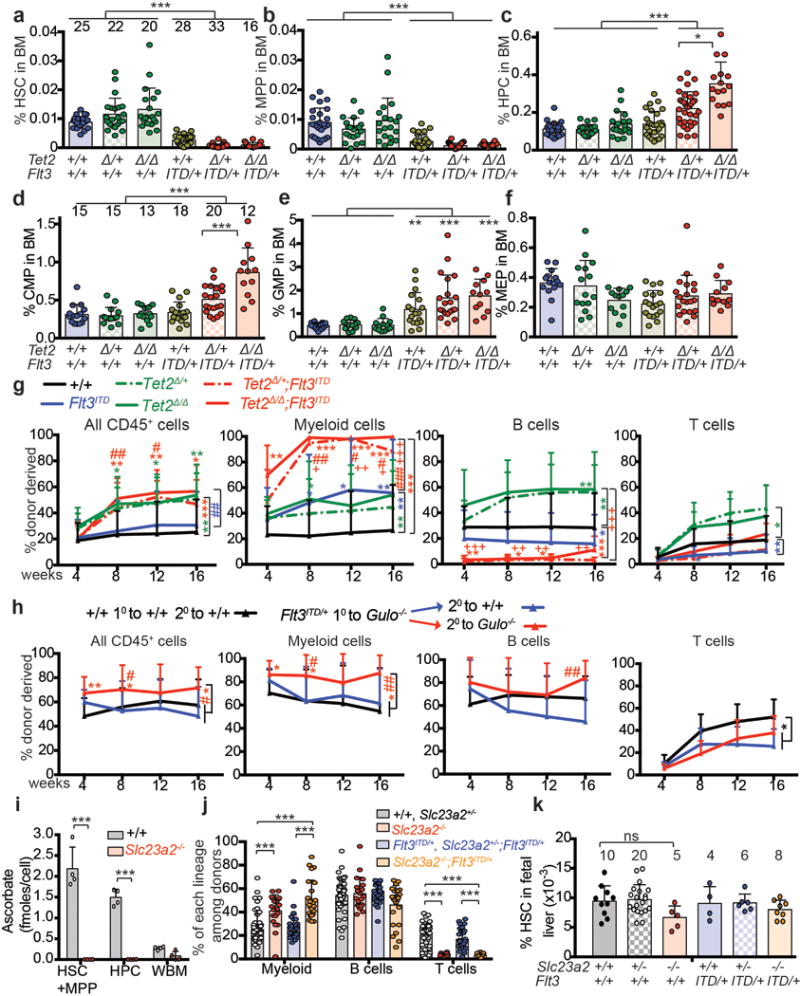
Figure 1. HSCs have high ascorbate levels and ascorbate depletion increases HSC frequency.
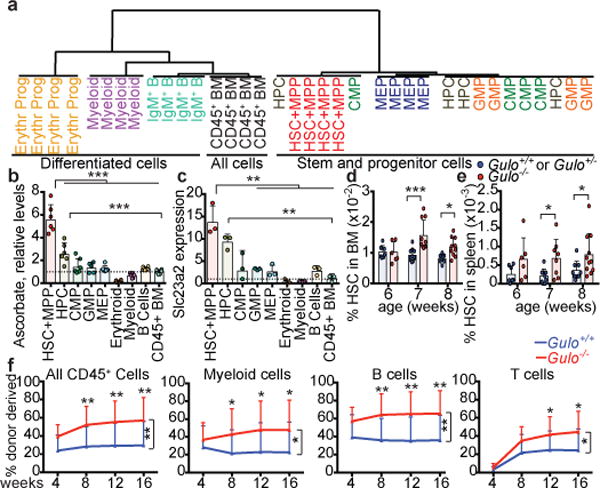
a, Unsupervised clustering of metabolomic data from haematopoietic stem and progenitor cell populations (see methods for the markers used to isolate each population; 1 experiment, representative of 4 total experiments). b-c. Ascorbate and Slc23a2 expression levels relative to CD45+ BM cells (b, n=6 mice from 2 independent experiments. c, n=3 mice from 2 independent experiments). d-e, HSC frequencies in Gulo−/− ascorbate-depleted and littermate control mice at 6, 7, or 8 weeks of age (n=6-11 mice per genotype per time-point in 3–6 independent experiments per time-point). f, Percentage of donor derived haematopoietic cells after competitive transplantation of 500,000 donor Gulo+/+ or Gulo−/− bone marrow cells along with 500,000 competing wild-type recipient cells into irradiated recipient mice (a total of 3 donors and 14-15 recipients per genotype in 3 independent experiments). The exact number of mice analysed and the values obtained for each mouse are provided in the source data files for all figures. Statistical significance was assessed with t-tests (b-c) or two-way ANOVAs followed by Fisher’s LSD tests for individual time-points (d-f). All data represent mean±SD. We corrected for multiple comparisons by controlling the false discovery rate (*p<0.05, **p<0.01, ***p<0.001).
One of the most enriched metabolites in HSCs and MPPs was ascorbate (vitamin C) (Extended Data Fig. 2c), which remained stable during cell purification (Extended Data Fig. 1g). Ascorbate levels were 2 to 20-fold higher in HSCs/MPPs as compared to other haematopoietic progenitors, and declined with differentiation (Fig. 1b).
Ascorbate regulates HSC frequency
Humans obtain ascorbate exclusively through their diet, but mice and most other mammals synthesize ascorbate in the liver using the enzyme gulonolactone oxidase (GULO)12. Ascorbate is taken up by most cells through two dedicated transporters encoded by Slc23a1 and Slc23a212. Slc23a2 was widely expressed by haematopoietic cells, but at 14-fold higher levels in HSCs/MPPs as compared to restricted haematopoietic progenitors (Fig. 1c). Slc23a2 expression, like ascorbate levels, declined with differentiation (Fig. 1c). Ascorbate levels in haematopoietic cells correlated tightly with Slc23a2 expression (R2=0.94) (Extended Data Fig. 3a). Slc23a1 and Gulo are not expressed by haematopoietic cells13. Therefore, ascorbate accumulation in HSCs was likely due to high Slc23a2 expression.
To test whether ascorbate regulates HSC function we examined Gulo−/− mice, which are unable to synthesize ascorbate and, like humans, obtain ascorbate exclusively through their diet. Gulo−/− mice, born from Gulo+/− dams, were developmentally normal and received ascorbate from their mothers until they were weaned at 4 weeks of age. They subsequently became ascorbate depleted when maintained on a standard mouse diet, which contains very little ascorbate. By 6–8 weeks of age, Gulo−/− mice were smaller than Gulo+/+ or Gulo+/− littermates and had fewer bone marrow and spleen cells (Extended Data Fig. 3b–d). In the bone marrow and spleen of Gulo−/− mice HSC frequency (Fig. 1d–e) and number normalized to body mass (Extended data Fig. 3e and 3f) were significantly higher than in littermate controls at 7 and 8 weeks of age. The frequencies of most other haematopoietic progenitors, and their rates of cell division, did not significantly differ between Gulo−/− and control mice (Extended data Fig. 3g–t). Gulo−/− thymuses were hypocellular (Extended data Fig. 3u), consistent with a known requirement for ascorbate in thymocyte maturation14.
Figure 3. Low ascorbate levels cooperate with Flt3ITD to promote myelopoiesis, partly by reducing Tet2 function, and cell-autonomously promote HSC function. a-d.
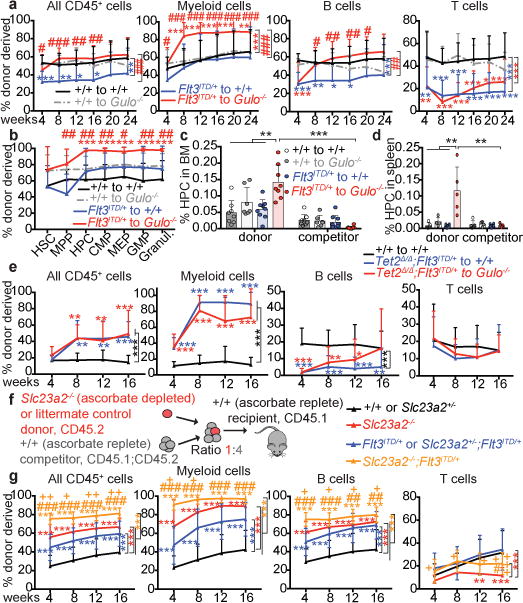
, Competitive transplantation of 500,000 donor bone marrow cells from Flt3ITD/+ mice or littermate controls along with 500,000 competing wild-type cells into irradiated wild-type (ascorbate replete) or Gulo−/− (ascorbate depleted) recipient mice (a total of 4 donor mice and 13–20 recipient mice per treatment in 2 independent experiments). Panel a shows donor cell reconstitution levels in the blood and panel b shows the percentages of donor-derived cells in the bone marrow. c-d, Frequencies of donor and competitor-derived CD48+LSK HPC cells. e, Competitive transplantation of 500,000 donor bone marrow cells of the indicated genotypes along with 1,500,000 competitor wild-type cells into irradiated wild-type (ascorbate replete) or Gulo−/− (ascorbate depleted) mice (a total of 4 donor mice and 15 recipient mice per treatment in 4 independent experiments). f-g, Competitive transplantation of 500,000 donor fetal liver cells from the indicated genotypes along with 2,000,000 competing wild-type bone marrow cells into irradiated wild-type recipient mice (for +/+ or Slc23a2+/−, 10 donor and 50 recipient mice; for Slc23a2−/−, 4 donors and 20 recipients; for Flt3ITD/+ or Slc23a2+/−;Flt3ITD/+, 6 donors and 30 recipients; for Slc23a2−/−;Flt3ITD/+, 5 donors and 24 recipients, from 6 independent experiments). +/+ and Slc23a2+/− genotypes were pooled as they showed no statistically significant differences. g, Percentage of donor-derived haematopoietic cells. * refers to comparisons to wild type (black line), # to Flt3ITD/+ (blue line), and + to Slc23a2−/− (red line). All data represent mean±SD. Statistical significance was assessed with a non-parametric mixed model followed by Kruskal-Wallis tests for individual time-points or cell types (a-b, e, g), one-way ANOVAs followed by Fisher’s LSD tests (between genotypes in c, d) and Mann-Whitney tests (between donor and competitor in c, d). We corrected for multiple comparisons by controlling the false discovery rate (*p<0.05, **p<0.01, ***p<0.001). * indicates comparisons to wild type while # or + indicate comparisons to other conditions as indicated by the brackets.
Upon competitive transplantation into irradiated mice, Gulo−/− bone marrow cells gave significantly higher levels of reconstitution in all lineages as compared to control cells (Fig. 1f). Therefore, HSC frequency was significantly higher in ascorbate depleted mice.
Ascorbate regulates Tet function in HSCs
Ascorbate is a cofactor for several α-ketoglutarate-dependent dioxygenases15, including Jumonji histone demethylases16; however, ascorbate depletion did not significantly increase the levels of several histone methylation marks (Extended Data Fig. 4a). Although ascorbate promotes the activity of prolyl 4-hydroxylase during collagen synthesis17, we did not detect a pronounced loss of bone collagen in ascorbate-depleted mice (Extended Data Fig. 4b). Nonetheless, a loss of collagen, or collagen organization, might be observed with longer term ascorbate depletion. Ascorbate can regulate hydroxylase enzymes during carnitine biosynthesis in culture18; however, we did not detect any effect of ascorbate depletion on carnitine or acetylcarnitine levels in haematopoietic cells (Extended Data Fig. 4c). We also did not detect any effect of ascorbate depletion on reactive oxygen species levels in haematopoietic cells (Extended Data Fig. 4d). Ascorbate can act as a co-factor for prolyl hydroxylases that degrade Hypoxia Inducible Factors (HIF)19 but HIF-1α and HIF-2α are not required for HSC function20. Despite our inability to detect an effect of ascorbate depletion on the function of these enzymes, they could potentially contribute to the effects of ascorbate depletion on HSCs.
Ascorbate promotes the activity of Tet enzymes in culture7,21–23, though it is not clear whether ascorbate limits Tet function in vivo. Tet enzymes convert 5-methylcytosine (5mC) to 5-hydroxymethylcytosine (5hmC), then catalyze some steps toward unmethylated cytosine24,25. Tet2 inactivating mutations are early events in leukaemogenesis26 that increase HSC frequency and self-renewal27–29 and cause leukaemia when combined with other mutations30–32. Consistent with prior studies27–29, conditional deletion of Tet2 in adult haematopoietic cells significantly increased HSC frequency and function (Extended Data Fig. 5a–h), just as observed after ascorbate depletion.
To test whether physiological variations in ascorbate regulate Tet function in haematopoietic cells we sustained Gulo−/− mice with low levels of ascorbate in the drinking water for 3 to 6 months. These mice exhibited approximately 10-fold lower levels of ascorbate in plasma and in haematopoietic cells relative to littermate controls (Fig. 2c, Extended Data Fig. 4e, Extended Data Fig. 6e–f). Ascorbate levels in Gulo−/− mice were therefore similar to those observed in 5% of people in western countries33. Ascorbate depleted Gulo−/− mice had significantly reduced 5hmC levels in HSCs/MPPs, HPCs, myeloid progenitors, and unfractionated bone marrow cells relative to littermate controls (Fig. 2a) while having normal 5mC levels, suggesting reduced Tet activity (Fig. 2b). Like ascorbate, 5hmC levels were highest in HSCs/MPPs and declined with differentiation (Fig. 2a).
Figure 2. Ascorbate depletion reduces Tet2 activity in HSCs and progenitors in vivo.
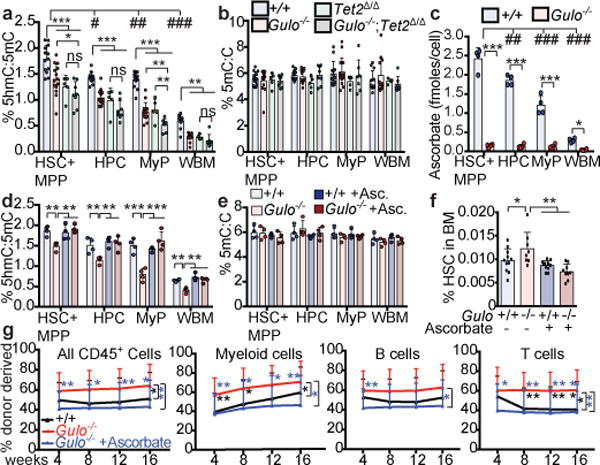
a-b, 5hmC:5mC and 5mC:C in sorted cell populations from 4–6 month old wild type (n=13 mice), Gulo−/− (n=14 mice), Tet2Δ/Δ (n=5 mice), and Tet2Δ/Δ;Gulo−/− mice (n=8 mice) from 10 independent experiments. c, Ascorbate levels in cells from 4 month old mice (a total of n=4 mice per condition from 2 independent experiments; * refers to comparisons between genotypes and # between cell types). d-e, 5hmC:5mC and 5mC:C in sorted cell populations from 4 month old mice with or without ascorbate feeding (a total of n=4 mice per condition from 3 independent experiments). f, HSC frequency in 8 week old mice (a total of n=8-11 mice per genotype in 6 independent experiments). g, Percentage of donor-derived haematopoietic cells after competitive transplantation of 500,000 donor bone marrow cells from Gulo+/+ or Gulo−/− mice, or Gulo−/− mice supplemented with ascorbate along with 500,000 competitor wild-type cells into irradiated recipient mice (a total of 4 donors and 19-20 recipients per genotype in 4 independent experiments). Statistical significance was assessed with one-way (a-b, d-f) or two-way (c) ANOVAs, Kruskal-Wallis tests (for abnormally distributed data in a-b), or with a non-parametric mixed model followed by Kruskal-Wallis tests for individual time-points (g). All data represent mean±SD. We corrected for multiple comparisons by controlling the false discovery rate (*p<0.05, **p<0.01, ***p<0.001).
To test whether ascorbate regulates 5hmC levels by modulating Tet2 function, we compared 5hmC levels in haematopoietic cells from Gulo−/− mice, Tet2Δ/Δ mice, and Gulo−/−;Tet2Δ/Δ compound mutant mice. Gulo deficiency and Tet2 deficiency each significantly reduced 5hmC levels in all cell populations relative to wild-type controls, but HSCs/MPPs and HPCs from Gulo−/−;Tet2Δ/Δ compound mutant mice did not have significantly lower 5hmC levels as compared to the same cells from Tet2Δ/Δ mice (Fig. 2a). Therefore, most of the effect of ascorbate depletion on 5hmC levels in HSCs/MPPs and HPCs was mediated by changes in Tet2 function. Myeloid progenitors did have significantly lower 5hmC levels in Gulo−/−;Tet2Δ/Δ compound mutant mice as compared to Tet2Δ/Δ mice (Fig. 2a). Ascorbate depletion, therefore, reduced 5hmC levels in myeloid progenitors through Tet2-dependent and Tet2-independent mechanisms. The Tet2-independent mechanisms may include effects on Tet1 or Tet3 function (Fig. 2a).
To test if Tet2 mediates the effects of ascorbate depletion on HSC function, we competitively transplanted donor Mx1-Cre;Tet2fl/fl and wild-type bone marrow cells into wild type or ascorbate depleted Gulo−/− recipient mice and treated with poly I:C to delete Tet2 six weeks after transplantation (Extended Data Fig. 6a, c–d). Tet2-deficient HSCs transplanted to wild type recipients gave significantly higher levels of reconstitution than wild type HSCs, as expected, but this effect was attenuated in ascorbate depleted Gulo−/− recipients (Extended Data Fig. 6d). The promotion of HSC function by ascorbate depletion is, therefore, mediated partly by Tet2, as ascorbate depletion enhanced reconstitution more from the wild type competitor cells than from Tet2-deficient HSCs.
Supplementation with higher levels of dietary ascorbate (ascorbate repletion) increased ascorbate levels in Gulo−/− mice to those observed in wild-type mice (Extended Data Fig. 6e–f). This prevented the decrease in 5hmC levels in HSCs and restricted progenitors (Fig. 2d–e) as well as the increase in HSC frequency and function (Fig. 2f–g). Therefore, these phenotypes are caused by ascorbate depletion.
Addition of ascorbate to cultured HSCs significantly reduced monocytic differentiation and promoted erythroid differentiation (Extended Data Fig. 6g–m). This is consistent with the conclusion that ascorbate promotes Tet2 function as Tet2 deficiency promotes monocytic differentiation and reduces erythroid differentiation in culture28,34.
We performed RNA-seq analysis in HSCs/MPPs from Gulo−/−, Tet2Δ/Δ, Gulo−/−;Tet2Δ/Δ, and control mice and found that some of the changes in gene expression in ascorbate depleted HSCs/MPPs were also observed in Tet2 deficient HSCs/MPPs (Extended Data Fig. 7). The number of transcripts in Gulo−/− and Tet2Δ/Δ HSCs/MPPs that changed in the same direction relative to control HSCs/MPPs was significantly more than expected by chance and included regulators of haematopoiesis, cell death, and differentiation (Extended Data Fig. 7b). A common group of gene sets were downregulated in both Gulo−/− and Tet2Δ/Δ HSCs/MPPs (Extended Data Fig. 7c).
Ascorbate depletion cooperates with Flt3-ITD
TET2 mutations cooperate with FLT3ITD mutations to cause acute myeloid leukaemia (AMLs)31,35. Consistent with this, Tet2 deficiency and Flt3ITD cooperated to significantly increase the frequencies of HPCs and some myeloid progenitors (Extended Data Fig. 8a–f) and to increase myelopoiesis as compared to Tet2 deficiency or Flt3ITD alone in competitive reconstitution assays (Extended Data Fig. 8g).
To test whether ascorbate depletion cooperates with Flt3ITD mutations, we transplanted Flt3ITD or control bone marrow cells along with wild-type competitors into irradiated recipients that were either ascorbate-replete wild type mice or ascorbate depleted Gulo−/− mice. Flt3ITD donor cells gave significantly higher levels of myeloid cell reconstitution (Fig. 3a) as well as MPPs, HPCs and myeloid progenitors in the bone marrow (Fig. 3b) in ascorbate depleted as compared to wild-type recipients. Consistent with the observation that Flt3ITD and Tet2 deficiency particularly increase the frequency of CD48+LSK HPC cells31, the frequency of Flt3ITD donor HPCs was significantly increased in the bone marrow and spleen of ascorbate-depleted Gulo−/− recipients relative to wild type recipients (Fig. 3c–d). Ascorbate-depletion thus cooperates with Flt3ITD to promote myelopoiesis in a manner similar to reduced Tet2 function.
To test whether ascorbate depletion increases the competitiveness of Flt3ITD stem and progenitor cells partly by reducing Tet2 function we competitively transplanted Flt3ITD;Tet2Δ/Δ bone marrow cells into wild type and Gulo−/− mice. Unlike Flt3ITD cells (Fig. 3a), Flt3ITD;Tet2Δ/Δ cells did not give higher levels of donor myeloid cells in ascorbate-depleted relative to ascorbate-replete mice (Fig. 3e). Indeed, Flt3ITD;Tet2Δ/Δ cells tended to give lower levels of myelopoiesis in ascorbate depleted as compared to control recipients, potentially reflecting increased myelopoiesis by wild-type competitor cells in the ascorbate depleted mice. Since Tet2 deficiency eliminated the competitive advantage conferred by ascorbate depletion on Flt3ITD cells, ascorbate depletion promoted myelopoiesis mainly by reducing Tet2 function.
Flt3ITD cells produced significantly more B cells in ascorbate-depleted as compared to wild-type recipients (Fig. 3a). Since Tet2 deficiency did not increase B lymphopoiesis by Flt3ITD cells (Extended Data Fig. 8g), this suggests that ascorbate depletion promoted B lymphopoiesis through Tet2 independent mechanisms, potentially through reduced Tet1 function, which regulates B lymphopoiesis36. Consistent with this possibility, Flt3ITD;Tet2Δ/Δ cells tended to make more B cells in ascorbate-depleted as compared to wild-type recipients (Fig. 3e).
To test if ascorbate repletion can reverse the increase in Flt3ITD-driven myelopoiesis caused by ascorbate depletion, we transplanted Flt3ITD cells from ascorbate depleted Gulo−/− recipients into secondary recipients that were either ascorbate depleted or ascorbate replete (Extended Data Fig. 8h). Flt3ITD-driven myelopoiesis remained high in ascorbate depleted recipients but declined in ascorbate replete recipients, suggesting that the effects of ascorbate depletion on Flt3ITD-driven myelopoiesis are reversible (Extended Data Fig. 8h).
To test whether ascorbate acts cell-autonomously to regulate HSC function, we competitively transplanted fetal liver haematopoietic cells from ascorbate transporter, Slc23a2-deficient mice or littermate controls, into wild type mice with normal ascorbate levels (Fig. 3f). In this experiment, only the Slc23a2−/− donor cells were ascorbate depleted while other cells in the recipient mice had normal ascorbate levels (Extended Data Fig. 8i). The Slc23a2−/− cells gave significantly higher levels of reconstitution as compared to control cells in all lineages except the T cell lineage (Fig. 3g). Slc23a2−/− cells also gave rise to higher levels of myelopoiesis as compared to control cells (Extended Data Fig. 8j). The increased reconstitution from Slc23a2−/− cells reflected increased HSC function after transplantation, as HSC frequency in donor fetal livers did not significantly differ between Slc23a2−/− and controls (Extended Data Fig. 8k). Slc23a2−/−; Flt3ITD cells also reconstituted at significantly higher levels as compared to Slc23a2−/− cells, Flt3ITD cells, or wild type donor cells, and had increased myelopoiesis as compared to Flt3ITD or wild type cells (Fig. 3g, Extended Data Fig. 8j). Therefore, ascorbate is taken up by haematopoietic stem and progenitor cells and then cell-autonomously regulates HSC function and Flt3ITD-driven myelopoiesis.
Ascorbate suppresses leukaemogenesis
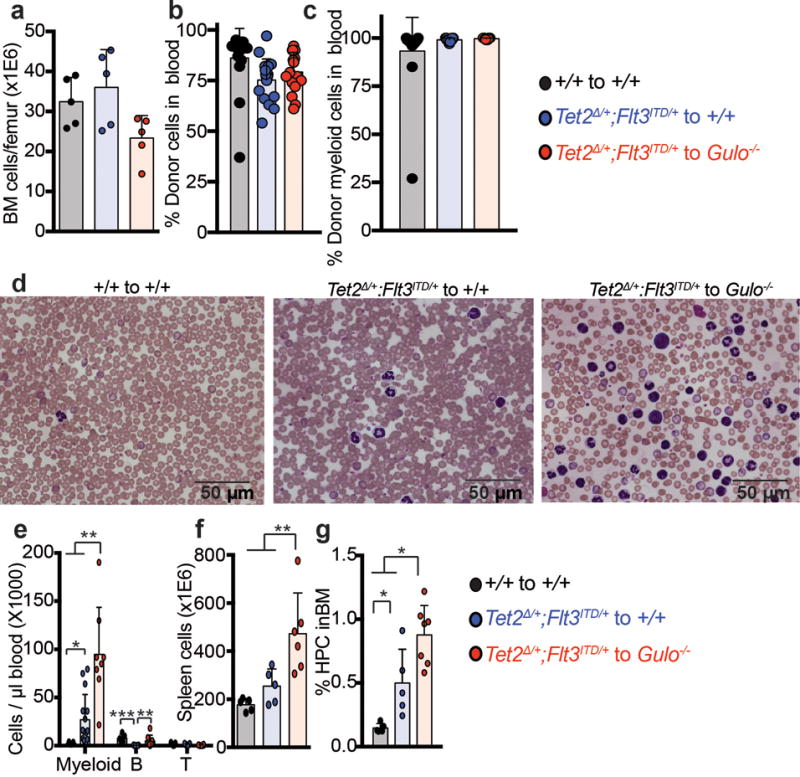
Reduced Tet231, or Tet2 and Tet337, function promote AML development. We tested whether ascorbate depletion accelerates AML development from Flt3ITD;Tet2Δ/+ cells by transplanting equal numbers of these cells into wild type or Gulo−/− mice, leading to similar levels of donor cell engraftment (Extended Data Fig. 9a–c). Ascorbate-depleted recipients had significantly higher numbers of myeloblasts, WBCs, blood myeloid cells, and spleen cells as compared to wild-type recipients (Fig. 4a, c, Extended Data Fig. 9d–f). All ascorbate-depleted recipients died within 50 days of transplantation while most wild-type recipients remained alive for at least 300 days after transplantation (Fig. 4b). CD48+CD150−LSK HPC cells, which can initiate AML from Flt3ITD;Tet2Δ/+ cells31, expanded to a significantly greater extent in the bone marrow (Extended Data Fig. 9g) and spleen (Fig. 4d) of ascorbate-depleted as compared to wild-type recipients. Moribund ascorbate depleted recipients had a spectrum of disease from myeloproliferative neoplasm to AML while none of the control recipients met the criteria for AML. Therefore, ascorbate depletion accelerated the development of AML from Flt3ITD;Tet2Δ/+ cells.
Figure 4. Low ascorbate levels accelerate leukaemogenesis.
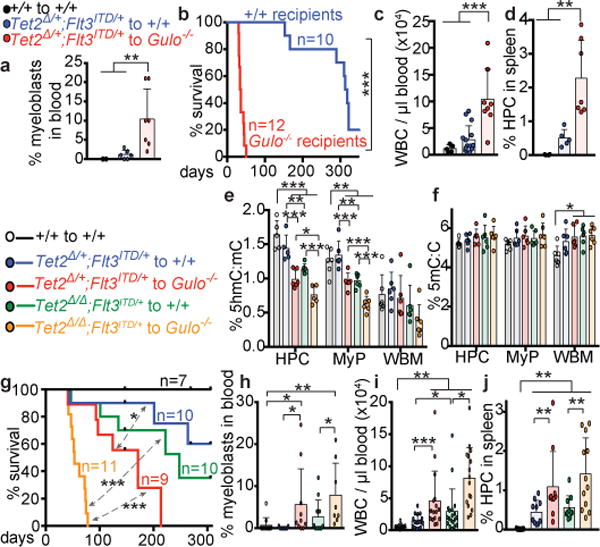
a-d, Eight million bone marrow cells from Tet2Δ/+;Flt3ITD or wild-type donor mice were transplanted into irradiated wild type or ascorbate-depleted Gulo−/− recipient mice and analysed 4–6 weeks after transplantation (a total of 3 donors with 14-15 recipients per treatment in 3 independent experiments). a, Frequency of myeloblasts in the blood (a total of n=2-7 recipients per treatment). b, Kaplan-Meier survival curve of transplant recipients of Tet2Δ/+;Flt3ITD cells (3 independent experiments, Mantel-Cox log-rank test). c-d, Analysis of the blood or spleen of transplant recipients (a total of n=4-15 recipients per treatment). e-j, Eight million bone marrow cells from donor mice of the indicated genotypes were transplanted into irradiated wild type or ascorbate-depleted Gulo−/− recipient mice and analysed 6-8 weeks after transplantation (a total of 4 donors and 8-19 recipients per treatment in 4 independent experiments). e-f, 5hmC:5mC and 5mC:C ratios in donor cells from the bone marrow of transplant recipients (a total of n=6 mice per treatment from 6 independent experiments). g, Kaplan-Meier survival curve of transplant recipients (4 independent experiments, Mantel-Cox log-rank test). h-j, Analysis of the blood or spleen of transplant recipients. Statistical significance was assessed with one-way ANOVAs followed by Fisher’s LSD tests (c-f, i-j) or Kruskal-Wallis tests (a, h). All data represent mean±SD. We corrected for multiple comparisons by controlling the false discovery rate. *p<0.05, **p<0.01, ***p<0.001.
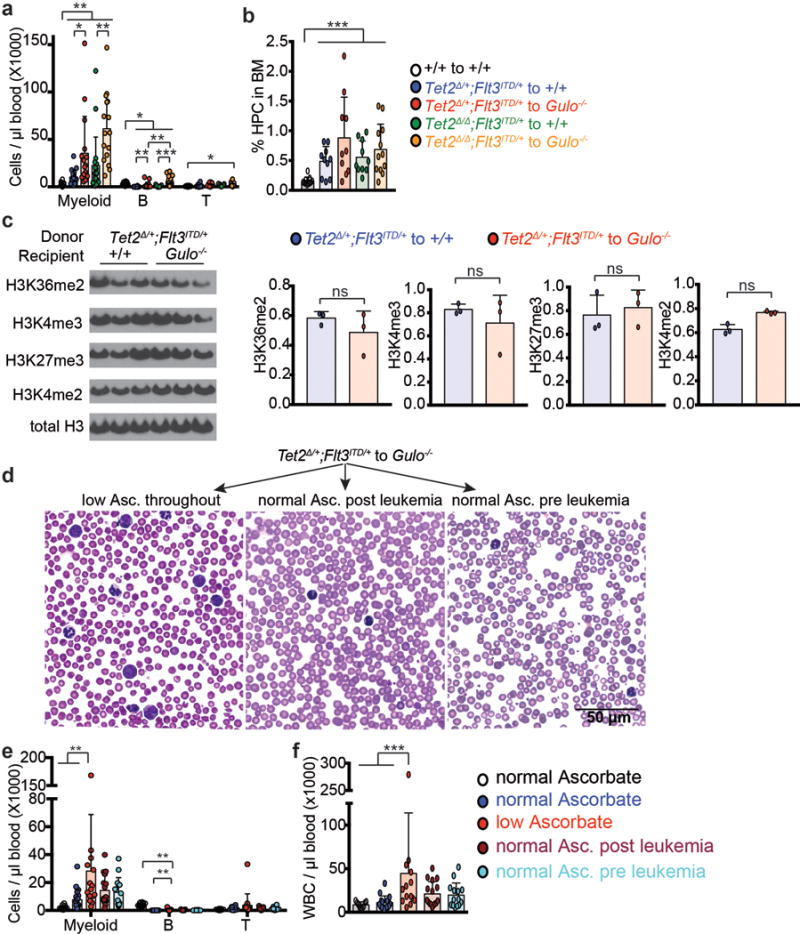
To test whether ascorbate depletion promotes leukaemogenesis through Tet2-independent mechanisms we transplanted Tet2Δ/+;Flt3ITD and Tet2Δ/Δ;Flt3ITD cells into wild-type or ascorbate depleted Gulo−/− recipients, then re-isolated donor cells from the bone marrow of the recipient mice approximately 10 weeks after transplantation. At this time point, ascorbate-depleted recipient mice showed histological evidence of myeloid leukemia. Ascorbate depletion reduced 5hmC levels in Tet2Δ/+;Flt3ITD HPC cells and myeloid progenitors (Fig. 4e) without affecting 5mC levels (Fig. 4f). Ascorbate depletion also reduced 5hmC levels in Tet2Δ/Δ;Flt3ITD HPC cells and myeloid progenitors (Fig. 4e–f). This suggests ascorbate depletion inhibits multiple Tet enzymes in leukemia cells.
Gulo−/− recipients of Tet2Δ/+;Flt3ITD cells died significantly faster than wild-type recipients (Fig. 4g) and had significantly more myeloblasts, WBCs, blood myeloid cells, and spleen HPCs (Fig. 4h–j, Extended Data Fig. 10a–b). Wild type recipients of Tet2Δ/Δ;Flt3ITD cells had significantly more WBCs (Fig. 4i) than wild type recipients of Tet2Δ/+;Flt3ITD cells, consistent with the fact that complete loss of Tet2 accelerates leukaemogenesis as compared to partial loss of Tet231. Given that ascorbate depletion reduced Tet2 function (Fig. 2a), these results suggest ascorbate depletion accelerated leukemogenesis partly by reducing Tet2 function.
Gulo−/− recipients of Tet2Δ/Δ;Flt3ITD cells also died significantly faster than wild-type recipients (Fig. 4g) and had significantly more myeloblasts, WBCs, myeloid cells in their blood, and HPC cells in their spleen (Fig. 4h–j, Extended Data Fig. 10a). Therefore, ascorbate depletion accelerates leukemogenesis partly through Tet2-independent mechanisms, which may include regulation of Tet1 or Tet3 (Fig. 4e). We did not detect significant changes in histone methylation marks in leukemia cells from ascorbate depleted as compared to wild-type mice (Extended Data Fig. 10c). However, ascorbate depletion may promote leukaemogenesis partly by regulating histone demethylases or other dioxygenase enzymes, or through non-cell-autonomous effects on the microenvironment. The relative contribution of Tet2-dependent and Tet2-independent mechanisms to leukemogenesis remains uncertain.
To test if leukemia progression in an ascorbate depleted environment can be reversed by dietary ascorbate, we restored normal ascorbate levels to Gulo−/− mice starting 6–7 weeks after transplantation (Fig. 5a), when leukemia was already histologically evident (Fig. 4). Feeding with ascorbate significantly extended survival (Fig. 5b) while significantly reducing myeloblasts in the blood, spleen cellularity and HPC frequency in the spleen (Fig. 5c–e, Extended Data Fig. 10d).
Figure 5. The effect of ascorbate depletion on leukemogenesis is reversible and ascorbate levels are high in human HSCs.
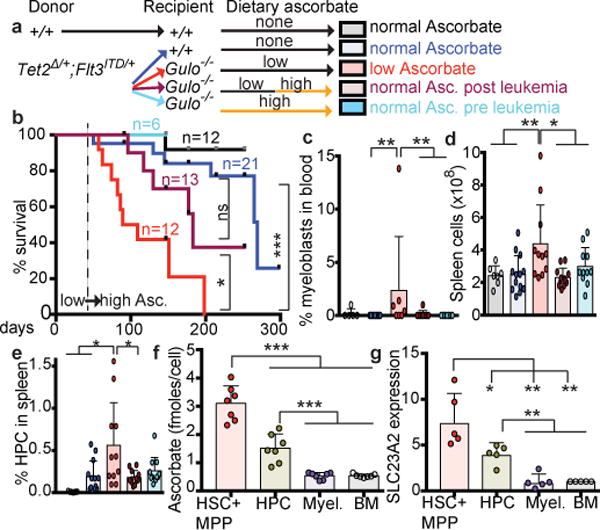
a-e, Eight million bone marrow cells from Tet2Δ/+;Flt3ITD or wild-type donor mice were transplanted into irradiated wild type or Gulo−/− recipient mice. Some Gulo−/− recipients were fed with ascorbate before (pre-leukemia) or 6–7 weeks after transplantation (post leukemia) (a total of n=3 donors with 5-13 recipients per treatment in 4 independent experiments). Mice were analysed 10-11 weeks after transplantation. b, Kaplan-Meier survival curve of transplant recipients of Tet2Δ/+;Flt3ITD cells treated (6 independent experiments, Mantel-Cox log-rank test). f-g, Ascorbate levels and SLC23A2 expression in human bone marrow haematopoietic cells (see methods for the markers used to isolate each cell population. f, n=7 samples analysed in 7 independent experiments. g, n=5 samples analysed in 5 independent experiments). Statistical significance was assessed with t-tests (g), one-way ANOVAs followed by Fisher’s LSD tests (d, f) or Kruskal-Wallis tests (c, e). We corrected for multiple comparisons by controlling the false discovery rate. All data represent mean±SD (*p<0.05, **p<0.01, ***p<0.001).
To test whether our findings are relevant to humans we measured ascorbate levels in human haematopoietic cells from fresh adult bone marrow biopsies. Like mouse HSCs, human HSCs/MPPs had significantly higher levels of ascorbate (Fig. 5f) and SLC23A2 expression (Fig. 5g) as compared to other haematopoietic cells, and SLC23A1 expression was not detected. Ascorbate levels in human HSCs (Fig. 5f) were similar to those in mouse HSCs (Fig. 2c).
Addition of ascorbate to culture medium promotes pluripotency by stimulating Jumonji histone demethylase activity16 and by stimulating Tet activity7,22. Our results do not address the biochemical mechanism by which ascorbate regulates Tet function but extend the data from cultured cells by showing that physiological variations in ascorbate levels within tissues regulates stem cell function and cancer initiation.
In western countries, plasma ascorbate levels vary 10-fold among individuals33, and the lowest quartile of men have a significantly higher risk of mortality from cancer38,39. Humans with haematological malignancies have significantly lower serum ascorbate levels as compared to healthy controls40,41. In clinical trials, oral ascorbate administration failed to benefit patients with established cancers42, though supraphysiological ascorbate concentrations can slow the growth of some cancers in mice by causing oxidative stress43,44. Moreover, clonal hematopoiesis of indeterminate potential is common among older humans and is often associated with loss of one Tet2 allele45–47. Our data suggest it is important for people with clonal hematopoiesis to get adequate dietary ascorbate to maximize residual Tet tumor suppressor function.
METHODS
Mice
Gulo−/− 48, Tet2fl 27, Flt3ITD 49, Slc23a2−/− 50 and Mx1-Cre51 mice were previously described. All mice were on a C57BL background. Both male and female mice were used in all studies. Tet2fl; Mx1-Cre mice were injected with five intraperitoneal injections of 20 μg poly I:C (GE Healthcare) every other day at 6–8 weeks of age to induce Cre expression. Ascorbate depleted Gulo−/− mice analyzed at 6-8 weeks of age were weaned at 4 weeks of age and then fed a standard mouse diet, which contains little ascorbate. Ascorbate depleted Gulo−/− mice maintained for longer than 8 weeks of age were fed a 1% ascorbate diet (Harlan) from the time of weaning until 6-8 weeks of age, then switched to a standard mouse diet and provided with 100 mg/L of ascorbate in the drinking water, changed twice per week. This regimen resulted in ascorbate depleted mice that could be maintained for at least 8 months. Ascorbate replete Gulo−/− mice were fed an ascorbate supplemented diet (a 1% ascorbate diet (Harlan)) from the time of weaning onwards, or as indicated in the text. For the experiments in Figure 4a–d, Gulo−/− mice were fed an ascorbate supplemented diet until 6 weeks of age, then switched to a standard mouse diet with 100 mg/L of ascorbate in the drinking water and transplanted at 8 weeks of age. For the experiments in Figures 4e–j and 5a–e, Gulo−/− mice were fed an ascorbate supplemented diet until 10 weeks of age, then switched to a standard mouse diet with 100 mg/L of ascorbate in the drinking water and transplanted at 12 weeks of age. C57BL/Ka-Thy-1.1 (CD45.2) and C57BL/Ka-Thy-1.2 (CD45.1) mice were used in transplantation experiments. Gulo−/−; CD45.1 recipient mice were generated by crossing Gulo−/− mice with CD45.1 mice. Mice were housed in the Animal Resource Center at the University of Texas Southwestern Medical Center and all procedures were approved by the UT Southwestern Institutional Animal Care and Use Committee.
Cell isolation for experiments other than metabolomics
Cell populations shown in the figures were isolated with the following markers: CD150+CD48−LSK HSCs, CD150−CD48−LSK MPPs, CD48+LSK haematopoietic progenitor cells (HPCs), CD34+CD16/32−Lineage−Sca-1−c-kit+ common myeloid progenitors (CMPs), CD34+CD16/32+Lineage−Sca-1−c-kit+ granulocyte-macrophage progenitors (GMPs), CD34−CD16/32−Lineage−Sca-1−c-kit+ megakaryocyte-erythroid progenitors (MEPs), Mac-1+Gr-1+ myeloid cells, CD71+Ter119+ erythroid progenitors, and B220+IgM+ B cells.
Bone marrow cells were obtained by flushing femurs and tibias with a 25G needle or by crushing femurs, tibias, vertebrae, and pelvic bones with a mortar and pestle, in Ca2+ and Mg2+ free Hank’s buffered salt solution (HBSS; Gibco), supplemented with 2% heat-inactivated bovine serum (HIBS, Gibco). Spleens and thymuses were dissociated by crushing followed by trituration. All cell suspensions were filtered through a 40 μm cell strainer. Cell number was measured with a Vi-CELL cell viability analyzer (Beckman Coulter) or a hemocytometer. For flow cytometric analysis and isolation, cells were incubated with combinations of antibodies to the following cell-surface markers, conjugated to Pacific Blue, Brilliant Violet 421, Brilliant Violet 510, FITC, PE, PerCP-Cy5.5, PE-Cy5, PE-Cy7, APC, eFluor 660, Alexa Fluor 700, APC-eFluor 780, or biotin: CD2 (RM2-5), CD3ε (17A2), CD4 (GK1.5), CD5 (53-7.3), CD8α (53-6.7), CD11b (M1/70), CD16/32 (93), CD24 (M1/69), CD25 (PC61.5), CD34 (RAM34), CD43 (eBioR2/60), CD44 (IM7), CD45.1 (A20), CD45.2 (104), CD45R (B220; RA3-6B2), CD48 (HM48-1), CD71 (C2), CD117 (cKit; 2B8), CD127 (IL7Rα; A7R34), CD135 (Flt3; A2F10), CD150 (TC15-12F12.2), Ter119 (TER-119), Sca1 (D7, E13-161.7), Gr-1 (RB6-8C5), IgM (II/41), F4/80 (BM8). A list of antibodies can be found in Supplementary Table 1. Lineage markers for HSCs and progenitors were CD3, CD5, CD8, B220, Gr-1, and Ter119. Antibody staining was performed at 4°C for 30 minutes, or, when CD34 was included in the cocktail, on ice for 90 minutes. Biotinylated antibodies were visualized by incubation with PE-Cy7, BV510 or BV421 conjugated streptavidin at 4°C for 30 minutes. 4′,6-diamidino-2-phenylindole (DAPI; 2 μg/ml in PBS) or propidium iodide (PI; 1 μg/ml) were used to exclude dead cells during flow cytometry. All reagents were acquired from BD Biosciences, eBiosciences, BioLegend or Tonbo. For isolation of all c-kit+ cell populations, cells were pre-enriched before flow cytometry using paramagnetic microbeads and an autoMACS magnetic separator (Miltenyi Biotec). Analysis and cell sorting were performed using a FACSAria flow cytometer (BD Biosciences) or a BD FACSCanto (BD Biosciences). Data were analyzed using FACSDiva (BD Biosciences).
Cell isolation for metabolomics
Methods for the isolation of cells for metabolomics were optimized for speed and to keep the cells cold at all times, to minimize metabolic changes during isolation. Mice were euthanized by cervical dislocation and bone marrow cells were obtained by crushing femurs, tibias, vertebrae, and pelvic bones with an ice-cold mortar and pestle in a 4°C cold room or on ice in 2 ml of Ca2+ and Mg2+ free HBSS, supplemented with 0.5% bovine serum albumin. Cells were filtered through a 40 μm cell strainer or a 45 μm nylon mesh into 5 ml tubes on ice. For sorting haematopoietic stem and progenitors, paramagnetic MicroBeads against c-kit (Miltenyi) were added to each sample, followed 1 minute later by all of the antibodies used for the isolation of the relevant cell population (antibodies are listed above). Fluorochrome-conjugated antibodies were used in all cases to enable a single staining step. In experiments in which CD45+ bone marrow cells were isolated, paramagnetic MicroBeads against CD45 (Miltenyi) were used to pre-enrich, followed 1 minute later by the other antibodies required to isolate the other cell populations in the experiment. Antibody staining was for 30 minutes on ice in a 4°C cold room, with occasional mixing. Then c-kit+ cells or CD45+ cells were enriched using a QuadroMACS manual separator (Miltenyi) in the cold room. In most experiments 4 mice were analysed in parallel, in which case the total time from sacrificing the first mouse to the completion of cell isolation was 2–3 hours, during which time the samples were kept on ice as each sample was processed. Control experiments showed that up to 7 hours incubation on ice did not significantly change the levels of most metabolites we detected in bone marrow cells (Extended data Fig. 1b). Cells were sorted on a FACSAria flow cytometer running with a sheath fluid of 0.5 × phosphate buffered saline (PBS), prepared fresh using Milli-q water (Millipore), and a 70 μm nozzle in a 4-way purity sort mode to minimize the volume of sorted drops, so as to eliminate ion suppression of mass spectrometry signals from salts in the sheath fluid. The FACSAria sheath tank was washed with Milli-q deionized water before the experiment to eliminate contaminants and dedicated glassware was used to make all buffers. Each sample was in HBSS+0.5% BSA and kept at 4°C during the sort, which lasted about 20 minutes per sample. Equal numbers of cells from each population were sorted in each experiment (usually 5,000 – 20,000 cells) directly into 500 μl of cold 80% methanol pre-chilled on dry ice and maintained at 4°C during the sort. No serum was used during the procedure. After sorting, each sample was kept on dry ice for the duration of the experiment, and then stored at −80°C.
Metabolite extraction and metabolomics
Samples in 80% methanol were vortexed for 1 minute to lyse the cells, then centrifuged at 17,000×g for 15 minutes at 4°C. To measure ascorbate, 15 pmoles 13C ascorbate (Sigma) were added to the 80% methanol as an internal standard and 1 mM EDTA was added to prevent ascorbate oxidation52. Cell extracts were centrifuged immediately after cell isolation. The supernatant was transferred to a new tube and lyophilized using a Speedvac (Thermo). Dried metabolites were reconstituted in 30 μl of 0.03% formic acid, vortexed, centrifuged at 17,000×g for 15 minutes at 4°C and the supernatant was analysed using liquid chromatography-tandem mass spectrometry (LC-MS/MS). In experiments to measure ascorbate in cells, dried metabolites were reconstituted in 30 μl of 0.03% formic acid + 1 mM EDTA. In experiments to measure ascorbate in the plasma, 4 volumes of 90% Methanol + 1 mM EDTA + 13C ascorbate on dry ice were added to 1 volume of plasma, vortexed, centrifuged at 17,000×g for 15 minutes at 4°C and the supernatant analysed by LC-MS/MS. A Nexera Ultra High Performance Liquid Chromatograph (UHPLC) system (Shimadzu) was used for LC, with a Polar-RP HPLC column (150 × 2 mm, 4 μm, 80 Å, Phenomenex) and the following gradient: 0–3 min 100% mobile phase A; 3–15 min 100%–0% A; 15–17 min 0% A; 17–18 min 0%–100% A; 18–23 min 100% A. Mobile Phase A was 0.03% formic acid in water. Mobile Phase B was 0.03% formic acid in acetonitrile. The flow rate was 0.5 ml/min, the column was at 35°C and the samples in the autosampler were at 4°C. Mass spectrometry was performed with a triple quadrupole mass spectrometer (AB Sciex QTRAP 5500) in multiple reaction monitoring (MRM) mode as described53, with some modifications. Transitions that never gave a signal in extracts from 20,000 cells were omitted from the MRM list. In experiments to detect ascorbate, the dwelling time for ascorbate and 13C-ascorbate was increased to 50 msec. Chromatogram peak areas were integrated using Multiquant (AB Sciex). For analysis, the peak area for each metabolite was normalised to the median peak area of the sample. For hierarchical clustering, only metabolites that were detected in every cell population were used. Metabolomics data analysis and hierarchical clustering were performed using MetaboAnalyst54 and Simca (Umetrics).
Measurement of 5hmC, 5mC and C by LC-MS/MS
To measure modified cytosines in purified populations, cells were sorted by flow cytometry into Ca2+ and Mg2+ free HBSS + 2% heat inactivated bovine serum, washed once with ice cold normal saline, and the genomic DNA was purified using the QIAamp micro kit (Qiagen) according to the manufacturer’s instructions. To measure modified cytosines in unfractionated bone marrow, 5 million fresh bone marrow cells were pelleted, washed once with ice cold normal saline and genomic DNA was purified using the DNeasy blood and tissue kit (Qiagen) according to the manufacturer’s instructions. Total genomic DNA from sorted cells, or 1 μg of DNA from unfractionated bone marrow, was digested to nucleosides with DNA Degradase Plus (Zymo Research), according to the manufacturer’s instructions, with the following internal standards added to the mix: 13C-15N2-2-deoxycytidine (13C-15N2-2dC), D3-5-methyl-2-deoxycytidine (D3-5mdC), D3-5-hydroxymethyl-2-deoxycytidine (D3-5hmdC) (Toronto Research Chemicals). Samples were then filtered with a 10 kDa Amicon column (Millipore) to remove enzymes, and filtrates were analysed by LC-MS/MS. LC was done with a Waters Atlantis or a Scherzo SM-C18 (Imtakt) reverse phase C18 column, 3 μm, 2.1×100 mm. Mobile phase A was 0.1% formic acid in water, and mobile phase B was 0.1% formic acid in acetonitrile. The gradient was: 0-2.5 min 0% B; 2.5-5 min 0%-100% B; 5–6 min 100% B; 6-7 min 100%-0% B; 7-9 min 0% B. The flow rate was 0.5 ml/min. Flow was diverted to the waste for the first 0.9 minutes. The column was at 35°C and the samples in the autosampler were at 4°C. Mass spectrometry was performed with an AB Sciex QTRAP 5500 operating in MRM mode. Mass spectrometry parameters were optimized using pure standards for 2-deoxycytidine (2dC), 5-methyl-2-deoxycytidine (5mdC) and 5-hydroxymethyl-2-deoxycytidine (5hmdC) (Berry and Associates). The following transitions were monitored in positive mode: 2dC 228.1/112.1; 5mdC 242.1/126.1; 5hmdC 258.1/142.1; 13C-15N2-2dC, 231.1/115.1; D3-5mdC 245.1/129.1; D3-5hmdC 261.1/145.1. Calibration curves of different amounts of pure standards were run to ensure linearity of measurements. Chromatogram peak areas were integrated using Multiquant (AB Sciex). The amount of each nucleoside in a sample was calculated by dividing the peak area of the unlabelled endogenous nucleoside by the peak area of the labelled internal standard.
Bone marrow reconstitution assays
Recipient mice (CD45.1) were irradiated using an XRAD 320 X-ray irradiator (Precision X-Ray Inc.) with two doses of 540 rad (1,080 rad in total) delivered at least 3 hours apart. Cells were injected into the retro-orbital venous sinus of anesthetized recipients. For competitive transplants, mixed donor (CD45.2) and competitor (either CD45.1 or CD45.1/CD45.2) cells were transplanted. After transplantation, mice were maintained on antibiotic water (Baytril 0.08 mg/ml) for 2–4 weeks. Blood was obtained from the tail veins of recipient mice every 4 weeks for at least 16 weeks after transplantation. Red blood cells were lysed with ammonium chloride potassium buffer. The remaining cells were stained with antibodies against CD45.2, CD45.1, CD45R (B220), CD11b, CD3, and Gr-1 and analysed by flow cytometry. For the non-competitive bone marrow transplants in Figures 4 and 5, 8×10⁶ CD45.2 or CD45.2/CD45.1 bone marrow cells were transplanted into irradiated CD45.1 recipients. For the secondary bone marrow transplants in Extended Data Figure 8h, 5 million bone marrow cells from primary recipients were transplanted into irradiated CD45.1 secondary recipients.
BrdU incorporation analysis
Mice were injected with a single dose of 5-bromo-2′-deoxyuridine (BrdU; 1mg/10g body mass) and maintained on 1 mg BrdU/ml drinking water for three days. Then HSCs or MPPs were isolated as described above, fixed, and stained using the BrdU APC Flow Kit (BD Biosciences), and analysed for BrdU incorporation. For the other cell populations analysed, which are more abundant than HSCs and MPPs, cells were stained with cell surface antibodies, then fixed and stained using the BrdU APC Flow Kit (BD Biosciences) and analysed for BrdU incorporation.
Human haematopoietic cell purification
Bone marrow aspirates were collected from patients, aged 34-85, being assessed for lymphoma, in which no evidence of lymphoma or myelodysplastic syndrome was observed. Each sample was obtained from a different patient. Following diagnosis, aspirates were stained using antibodies against CD34 (4H11, APC conjugated), CD45RA (HI100, PE conjugated), CD38 (HIT2, PECy7 conjugated), and Lineage markers (CD2, CD3, CD14, CD16, CD19, CD56, CD235A, Thermo Fisher, FITC conjugated). The cells were purified within 1–2 days of the biopsy. Prior to purification, bone marrow aspirates were kept at 4°C in RPMI. The cell populations shown in Figure 5 were isolated with the following markers: Lin−CD34+CD38−CD45RA− cells (a population enriched in HSCs/MPPs55), Lin−CD34+CD38+ cells (enriched in restricted haematopoietic progenitors55), CD13+/CD33+ myeloid cells, and unfractionated cells. This study was approved by the Institutional Review Board of the University of Texas Southwestern Medical Center (IRB STU 122013-023).
PCR and quantitative PCR
PCR Genotyping primers:
Gulo: 5′-CCCAGTGACTAAGGATAAGC-3′, 5′-CGCGCCTTAATTAAGGATCC-3′, 5′-GTCGTGACAGAATGTCTTGC-3′. Wild type band= 343bp, knockout band= 230bp.
Slc23a2−: 5′-GGCAGTGTTGGTCCTTCTGT-3′, 5′-CTGGCTATCCTCGTGTCCTG-3′ 5′-CTTAAACCATGGGGCTACCA-3′, 5′-AGACTGCCTTGGGAAAAGCG-3′, wild type band= 140bp, knockout band= 180bp
Tet2fl and Flt3ITD genotyping were as previously described 27,49.
For qPCR, cells were sorted into RLT buffer (Qiagen RNAeasy Micro kit) and RNA was purified according to the manufacturer’s instructions. cDNA was made with iScript reverse transcriptase (BioRad) and quantitative PCR was performed with iTaq Universal SYBR Green (BioRad) and a LightCycler 480 (Roche Applied Science). The signal from each sample was normalized to β-actin. qPCR primers:
Mouse Slc23a2: 5′-GGACAACACCATCCCAGGTA-3′, 5′-CCTTTGCTCACACCCTTCTT-3′.
Mouse Slc23a1: 5′-GAAGCCACCTCAATGAAAGG-3′, 5′-GCTGAGATCTCCAACTCAGGTC-3′.
Mouse β-actin: 5′-CACTGTCGAGTCGCGTCC-3′, 5′-TCATCCATGGCGAACTGGTG-3′
Human SLC23A2: 5′-CTGCAGCCAGCTAGGTCTTG-3′, 5′-AAGCTAGGAGCCCAGGATCA-3′
Human SLC23A1: 5′-TCCTCCTCCTTGGCCTTTGT-3′, 5′-CCCTGGTGGTTTCATGCTGT-3′
Human β-ACTIN: 5′-ATTGGCAATGAGCGGTTC-3′, 5′-CGTGGATGCCACAGGACT-3′
RNA-seq analysis
Cells were sorted into RLT buffer (Qiagen RNAeasy Plus Micro kit) and RNA was purified according to the manufacturer’s instructions. RNA quality was validated using a Pico Bioanalyzer. RNA sequencing libraries were generated using SMARTer Stranded Total RNA-Seq kit – Pico Input Mammalian (Clonetech). Library fragment size was measured using D1000 Screen Tape (Agilent) and library concentration was measured using Qubit RNA assay kit (Life Technologies). Libraries were sequenced using the Illumina NextSeq 500 desktop Next Generation Sequencing (NGS) system. The quality of RNA-seq raw reads was checked using FastQC 0.11.2. Raw reads were quality-trimmed using Trimmomatic 0.32 and mapped to the mouse genome, GRCm38, using TopHat 2.0.12 with Bowtie2 2.2.3. Mapped reads were quality-filtered using SAMtools 0.1.19, and quantified using HTSeq 0.6.1. Differential expression was assessed using DESeq2 1.8.2 and RUVSeq 1.2.0 with R 3.2.1. A fold change heatmap was generated using Cluster 3.0. Computational analysis was performed using the BioHPC high-performance computing cluster at UTSW.
Haematopoietic stem cell culture
10 HSCs per well were sorted into a 96 well plate containing IMDM with 10% Fetal Bovine Serum, 50ng/ml SCF, 10ng/ml TPO, 10ng/ml IL-3, and 4ng/ml IL-6. In experiments to assess erythroid differentiation (Extended data Figure 6m), 2U/ml EPO was included. Ascorbate or 2-phospho-ascorbate (Sigma) were used at 50 μg/ml. The culture medium was changed every two days. Eight days after plating, cells were stained and analysed by flow cytometry.
Histology
Routine histological processing of tissue specimens was performed at the UTSW Molecular Pathology Core. Sirius Red and Masson’s Trichrome stains on paraffin bone sections were performed according to the supplier’s instructions (IHCWorld). In Sirius Red, collagen is stained red with brightfield imaging, and stained red or green with polarized light imaging. In Masson’s Trichrome, collagen is stained blue. Blood smears were stained with Diff-Quik. Peripheral blood was subjected to an automated complete blood count, and, where indicated, a manual white blood cell differential was performed by a hematopathologist (G.M.C.) to assess blast percentage. Criteria suggested by Kogan and colleagues were used56 for assessment of myeloid leukemias in Figures 4 and 5.
ROS staining
5 million cells were stained with cell surface antibodies as described above. They were then washed and stained with CellRox DeepRed (Life Technologies) or ROS-ID ROS/Superoxide detection kit (Enzo) for 30 minutes at 37°C in Ca2+ and Mg2+ free HBSS + 2% heat-inactivated bovine serum + 50 μM verapamil (Sigma), then washed and analysed by flow cytometry.
Protein extraction and western blot analysis
Equal numbers of cells from each population were sorted into trichloroacetic acid (TCA, Sigma), and the TCA final concentration was adjusted to 10%. Samples were centrifuged at 16,000g for 15 minutes, and precipitates were washed twice with cold acetone and dried. Samples were solubilized in 9M urea, 2% Triton X-100, 1% DTT. LDS loading buffer (Life Technologies) was added. Samples were heated at 70°C for 10 minutes, separated on NuPAGE Bis-Tris polyacrylamide gels (Life Technologies), and transferred to 0.2μm PVDF membranes (BioRad) by wet transfer using NuPAGE transfer buffer (Life Technologies). Western blots were performed using antibodies against β-actin (AC-74, Sigma), histone H3 (polyclonal, Abcam, ab1791), H3K4me3 (C42D8, Cell Signaling), H3K27me3 (C36B11, Cell Signaling), H3K4me2 (C75H12, Cell Signaling) and H3K36me2 (C64G9, Cell Signaling). For small cell numbers (7,000-15,000), the SuperSignal Western Blot Enhancer kit (Thermo Scientific) was used according to the manufacturer instructions. Signals were detected using the SuperSignal West Pico or SuperSignal West Femto chemiluminescence kits (Thermo Scientific). Blots were stripped with 0.2N NaOH and/or 1% SDS, 25mM glycine, pH=2 before re-probing.
Statistical methods
Most figure panels contain data from multiple independent experiments performed on different days. Data always represent mean ± standard deviation, except when data represented fold-change values, in which case geometric mean ± geometric standard deviation is shown. Numbers of experiments noted in figure legends reflect independent experiments that were almost always performed on different days. The sample size used in each experiment was not predetermined or formally justified for statistical power. For samples with low variation, for example metabolite levels in HSCs, generally 4–6 samples per condition were analysed in each experiment. For samples with large variation, for example transplantation experiments, generally 15-20 samples per condition were analysed in each experiment. Blinding was not used in experiments. Mice were allocated to experiments randomly and samples processed in an arbitrary order, but formal randomization techniques were not used.
Prior to analysing the statistical significance of differences among treatments we tested whether data were normally distributed and whether variance was similar among treatments. To test normality, we performed the D’Agostino-Pearson omnibus test for samples with n>8 or the Shapiro-Wilk normality test for smaller samples. To test whether variability significantly differed among treatments we performed F-tests (for experiments with two treatments) or Levene’s median tests (for experiments with more than two treatments). When the data significantly deviated from normality (p<0.01) or variability significantly differed among treatments (p<0.05), we log2-transformed the data and tested again for normality and variability. If the transformed data no longer significantly deviated from normality and equal variability, then we performed parametric tests on the transformed data. If the transformed data still significantly deviated from normality or equal variability, we performed non-parametric tests on the non-transformed data.
To assess the statistical significance of a difference between two treatments, we used two-tailed Student’s t-tests (when a parametric test was appropriate), Mann-Whitney tests (when the data in any treatment significantly deviated from normality), or Welch’s tests (when the data were normally distributed but variances were unequal among treatments). To assess the statistical significance of differences between more than two treatments, we used one-way or two-way ANOVAs (when a parametric test was appropriate; two-way ANOVAs were used when the experiment involved multiple genotypes as well as multiple time points or multiple cell populations), Kruskal-Wallis tests (when the data in any treatment significantly deviated from normality or variances were unequal among treatments).
For ANOVAs in which a minority of samples significantly diverged from normality or equal variance, ordinary ANOVAs were used followed by Mann-Whitney tests or Kruskal-Wallis tests for comparisons that involved the abnormal groups. To test overall differences among genotypes in transplantation experiments, we used either a mixed two-way ANOVA in which data from the same mouse across time points were taken as repeated measures (when data were normally distributed and equally variable), or a non-parametric mixed model statistical method, nparLD57 (when some of the data significantly deviated from normality or equal variability). To confirm the results of the nparLD method, we also performed mixed two-way ANOVAs. Differences that were significant by the nparLD method were almost always significant by the mixed 2-way ANOVA. We always corrected for multiple comparisons using the False Discovery Rate (FDR) method with the two-stage linear step-up procedure of Benjamini, Krieger and Yekutieli.
The statistical significance of differences in survival was assessed using the Mantel-Cox log-rank test. The statistical significance of differences in fold-change values was assessed using log2-transformed data. For analysis of metabolomics data, the raw value for each metabolite was normalized to the median metabolite value in each sample. Normalisation to the average metabolite value in each sample was also performed to ensure relative values between samples were consistent, independent of the mode of normalization. All statistical analyses were performed with GraphPad Prism software with the exception of the nparLD test, which was performed with R3.2.1.
The only mice excluded from experiments were transplant recipients that had no donor cell reconstitution in Figure 3e and Extended Data Figure 8g. Since only 1 in 37,000 whole bone marrow cells in wild type mice is an HSC58, and HSC frequency in Flt3ITD mice was 5–10 fold lower than in wild type mice (Extended data Fig. 8a), it was expected that some recipients of 300,000 (Extended Data Fig. 8g) or 500,000 (Fig. 3e) whole bone marrow cells from these genotypes would receive no HSCs. Therefore, for purposes of comparing donor cell reconstitution levels among treatments we only included recipient mice with at least 1% donor cell reconstitution, and excluded recipients with <1% donor cell reconstitution (6 out of 23 Flt3ITD recipients, 8 out of 19 Tet2Δ/+;Flt3ITD recipients and 3 out of 9 Tet2Δ/Δ;Flt3ITD recipients were excluded from the experiment shown in Extended Data Figure 8g; 5 out of 20 Tet2Δ/+;Flt3ITD to +/+ recipients and 5 out of 20 Tet2Δ/+;Flt3ITD to Gulo−/− recipients were excluded from the experiment in Figure 3e). In Figure 5f, samples from one patient were excluded because of evidence of myelodysplastic syndrome. In Extended Data Figure 6d, data from the 4 week time-point were excluded from the statistical analysis because the mice had not yet been treated with poly I:C and therefore the cells were not yet Tet2 deficient.
Data availability
RNA-seq data have been submitted to the Sequence Read Archive (SRA) with BioProject ID: PRJNA391832 and SRA ID: SRP110757. The source data file contains all of the numeric data from all figures and extended data figures.
Extended Data
Extended data figure 1. Stability of metabolites during cell isolation.
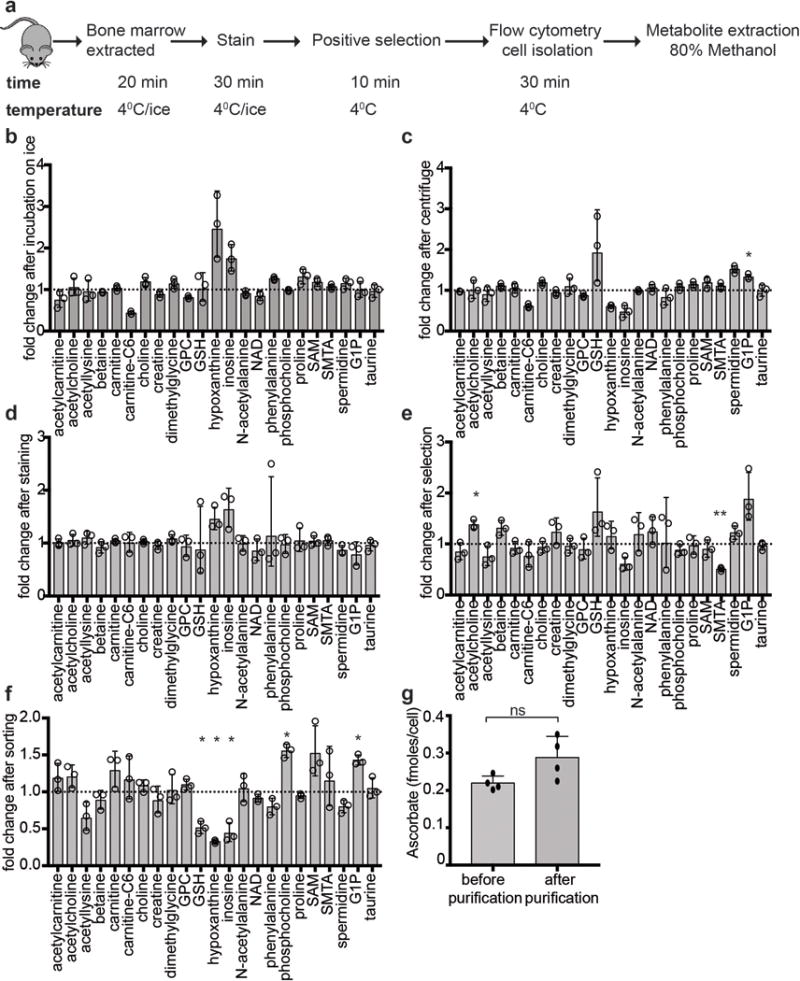
a, Diagram of the isolation procedure. b-f, Fold changes in the levels of representative metabolites in 20,000 bone marrow cells before and after each step of the cell isolation procedure. Metabolites were extracted before and after bone marrow cells were kept on ice for 7 hours (b), or centrifuged at 4°C at 300×g for 5 minutes (c), or stained with the antibodies used for HSC isolation (d), or cells underwent positive selection with anti-CD45 and anti-Ter119 beads (e), or flow cytometrically sorted for CD45 and Ter119 (f). Although most bone marrow cells are CD45+ or Ter119+, unfractionated samples are somewhat different in cellular composition from samples after selection and sorting, perhaps contributing to the changes observed in some metabolites in panels e and f. Data were normalized to the median metabolite signal intensity of each sample. Statistical significance was assessed with t-tests performed on log2-transformed data. We accounted for multiple comparisons by controlling the false discovery rate (n=3 mice; *p<0.05, **p<0.01, ***p<0.001). g, Ascorbate levels were compared in whole bone marrow cells whose metabolites were extracted before the cell purification procedure, or after flow cytometric purification (a total of n=4 mice in 2 independent experiments). Statistical significance was assessed using a paired t-test. All data represent mean±SD
Extended data figure 2. Differences in metabolite levels among haematopoietic stem and progenitor cell populations in the bone marrow.
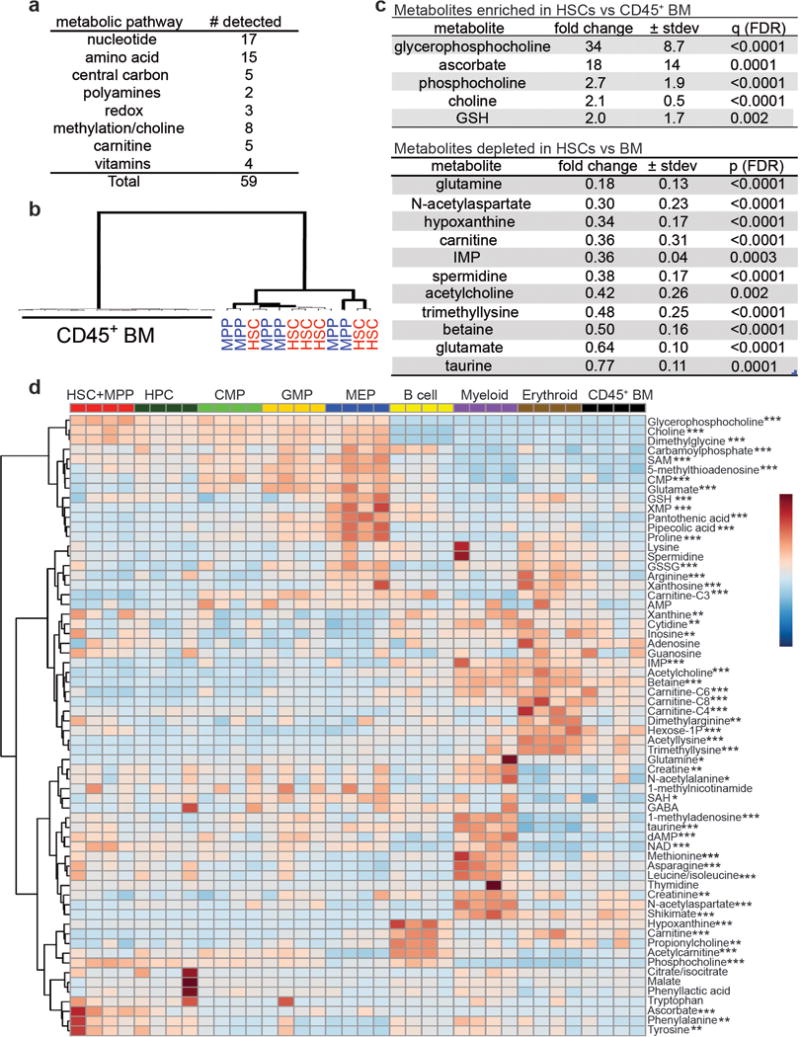
a, Types of metabolites detected in 10,000 HSCs. b, Unsupervised clustering of metabolomic data from HSCs, MPPs, and CD45+ bone marrow hematopoietic cells isolated in 6 independent experiments. c, Metabolites that significantly differed between HSCs and CD45+ bone marrow cells (6 independent experiments with a total of 6 HSC samples and 16 CD45+ BM samples). Statistical significance was assessed using t-tests performed on log2 transformed data. We accounted for multiple comparisons by controlling the false discovery rate. All data represent mean±SD. d, The metabolites we measured in stem and progenitor cell populations. The display is autoscaled for each metabolite to illustrate changes across samples. 52 out of 64 metabolites show statistically significant changes among at least some cell populations (1 experiment is shown, representative of 3 independent experiments; *p<0.05, **p<0.01, ***p<0.001) assessed using a one-way ANOVA for each metabolite followed by Fisher’s LSD tests corrected for multiple comparisons by controlling the false discovery rate.
Extended data figure 3. The ascorbate content in haematopoietic stem and progenitor cells correlates with ascorbate transporter expression level and the phenotype of ascorbate-depleted Gulo−/− mice.
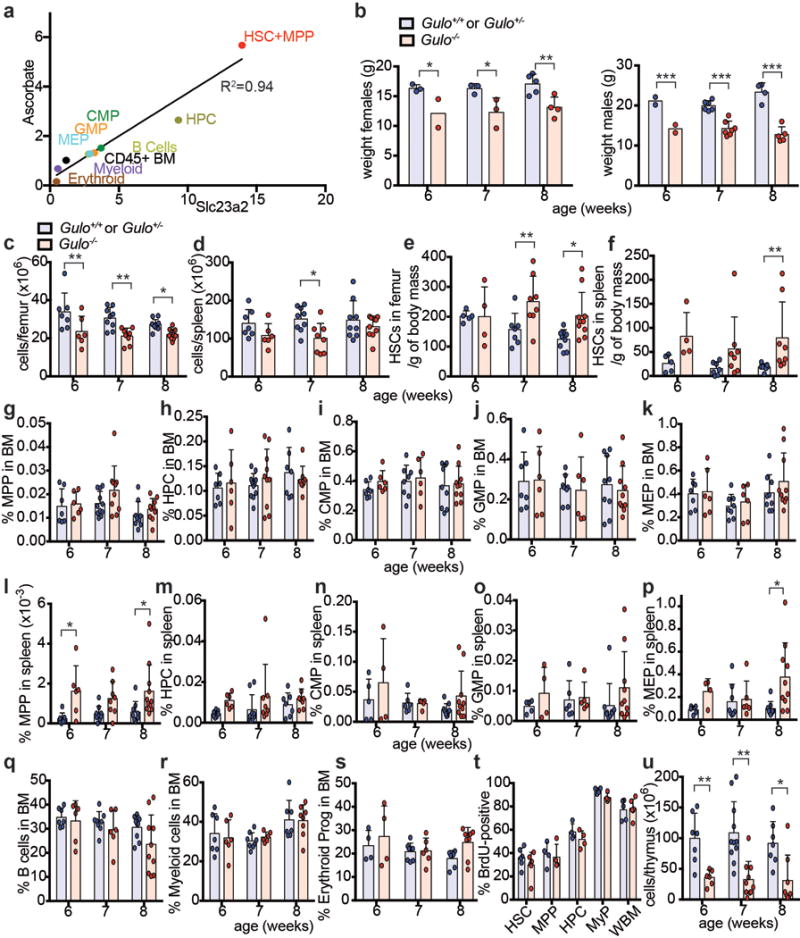
a, Ascorbate content versus slc23a2 expression in haematopoietic stem and progenitor cell populations. The plotted data are from Figures 1c and 1d. b-s, u, Analysis of ascorbate-depleted Gulo−/− mice and littermate controls (a total of 5–11 mice per genotype per time point analysed in 3-6 independent experiments per time-point). t, The percentage of cells that incorporated a 3 day pulse of 5-bromodeoxyuridine (BrdU) at 7-8 weeks of age (a total of n=4-6 mice per genotype in 3 independent experiments). Statistical significance was assessed with a two way ANOVA followed by Fisher’s LSD tests (b-l), or Mann Whitney tests (p, u). We corrected for multiple comparisons by controlling the false discovery rate (*p<0.05, **p<0.01, ***p<0.001). All data represent mean±SD.
Extended data figure 4. Ascorbate depletion did not have detectable effects on global histone methylation, collagen levels, ROS levels, carnitine metabolism, or Tet1-3 expression in HSCs or other haematopoietic progenitors.
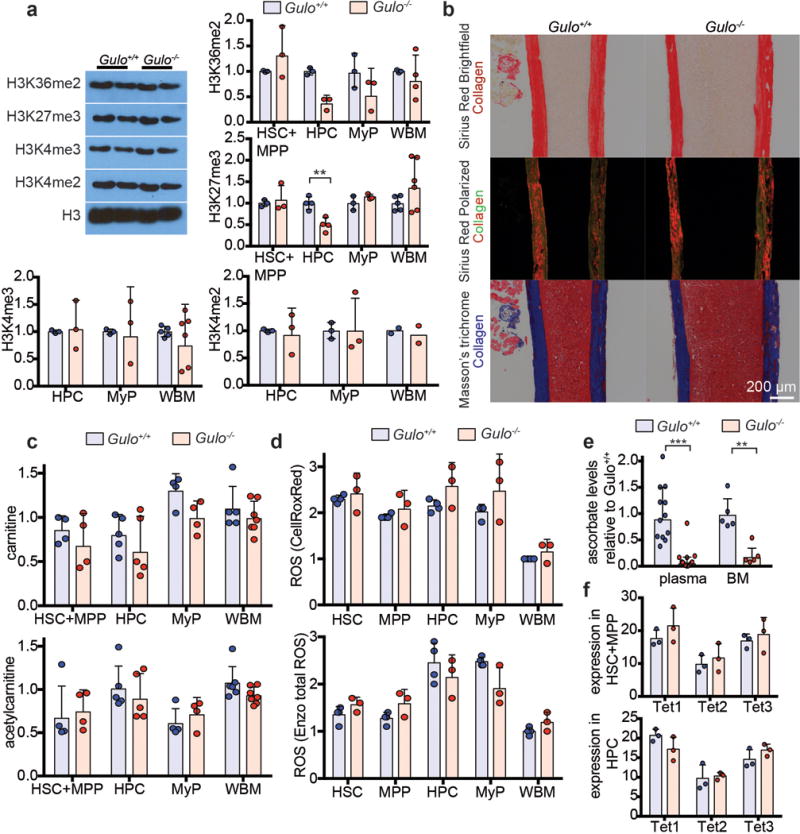
a, Western blots with antibodies against the indicated histone modifications were performed using haematopoietic cells from 8 week old ascorbate-depleted Gulo−/− mice and littermate controls (a total of n=3-6 mice per genotype in 3 independent experiments). Bar graphs show band intensity relative to the band intensity of the wild type sample for each cell type. We did not observe an increase in histone methylation for any of the modifications, as would be expected if ascorbate were promoting global histone demethylase activity. We observed reduced H3K27me3 in HPCs (note that data in Figure 3e show that the effects of ascorbate depletion on Flt3ITD-driven myelopoiesis were mediated mainly by reduced Tet2 function). For gel source data, see Supplementary Figure 1. b, Histochemical staining of collagen with Sirius Red (brightfield or polarized light) or Masson’s trichrome (blue) in bone sections from 8–16 week old Gulo−/− mice and littermate controls (photographs are representative of 6-8 mice per genotype in 2 independent experiments). c, Carnitine and acetylcarnitine levels were measured by LC-MS/MS in the indicated cell populations from 7-8 week old Gulo−/− and littermate control mice (a total of n=4-7 mice per genotype in 4 independent experiments). Data show carnitine/acetylcarnitine levels relative to the average levels in wild type WBM samples. d, Reactive oxygen species (ROS) levels were measured in 12 week old Gulo−/− and littermate control mice using CellRox Deep Red and Enzo Total ROS dyes (a total of n=3-4 mice per genotype in 3 independent experiments). Data show ROS levels relative to wild type WBM samples. e, Ascorbate levels were measured in the plasma and bone marrow of 4-6 month old Gulo−/− mice or controls (a total of n=12-17 mice per genotype for plasma and n=5 mice per genotype for bone marrow, analysed in 3 independent experiments). f, Tet1-3 transcript levels did not change in Gulo−/− versus littermate control mice, suggesting that the effects of ascorbate depletion on Tet activity was not due to reduced Tet1-3 transcription (n=3 mice). Statistical significance was assessed with two-way ANOVAs (a-d, f) followed by Fisher’s LSD tests or Welch’s tests (e), or Mann Whitney test (a- H3K36me2-HPC). We corrected for multiple comparisons by controlling the false discovery rate. All data represent mean±SD.
Extended data figure 5. Tet2 deletion phenocopies the increased HSC frequency and increased reconstituting potential of bone marrow cells from ascorbate depleted mice.
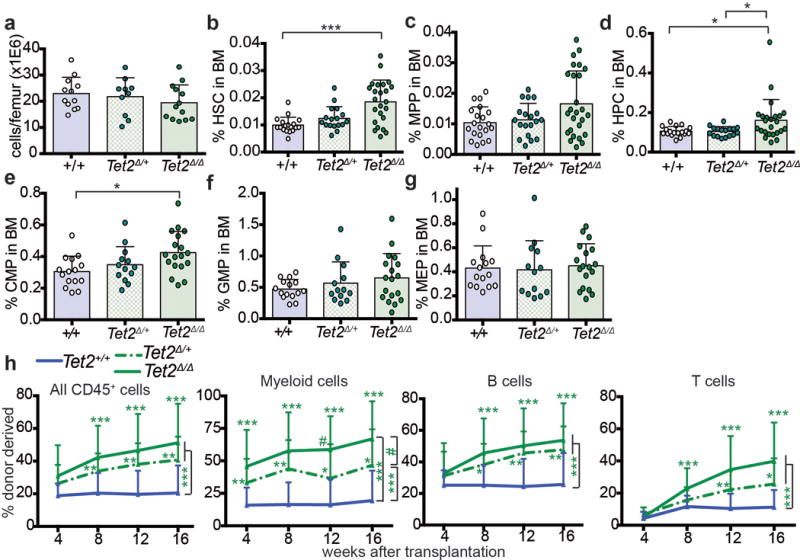
a-g, Mx-1-Cre; Tet2fl/fl mice and littermate controls were injected with poly I:C at 6–8 weeks of age. The frequencies of HSCs and other haematopoietic progenitors were analysed 3 weeks later (a total of n=10-24 mice per genotype in 9-14 independent experiments). h, Percentage of donor-derived haematopoietic cells after competitive transplantation of 200,000 donor Tet2+/+ or Tet2Δ/+ or Tet2Δ/Δ bone marrow cells along with 500,000 wild-type recipient competitor cells into irradiated recipient mice (a total of 5 donors and 15-25 recipients per treatment in 5 independent experiments). All data represent mean±SD. Statistical significance was assessed with Kruskal-Wallis tests (a-g), or a non-parametric mixed model followed by a Kruskal-Wallis test for individual time points (h). We corrected for multiple comparisons by controlling the false discovery rate (*p<0.05, **p<0.01, ***p<0.001).
Extended data Figure 6. Ascorbate regulates HSC function in vivo and HSC differentiation in culture.
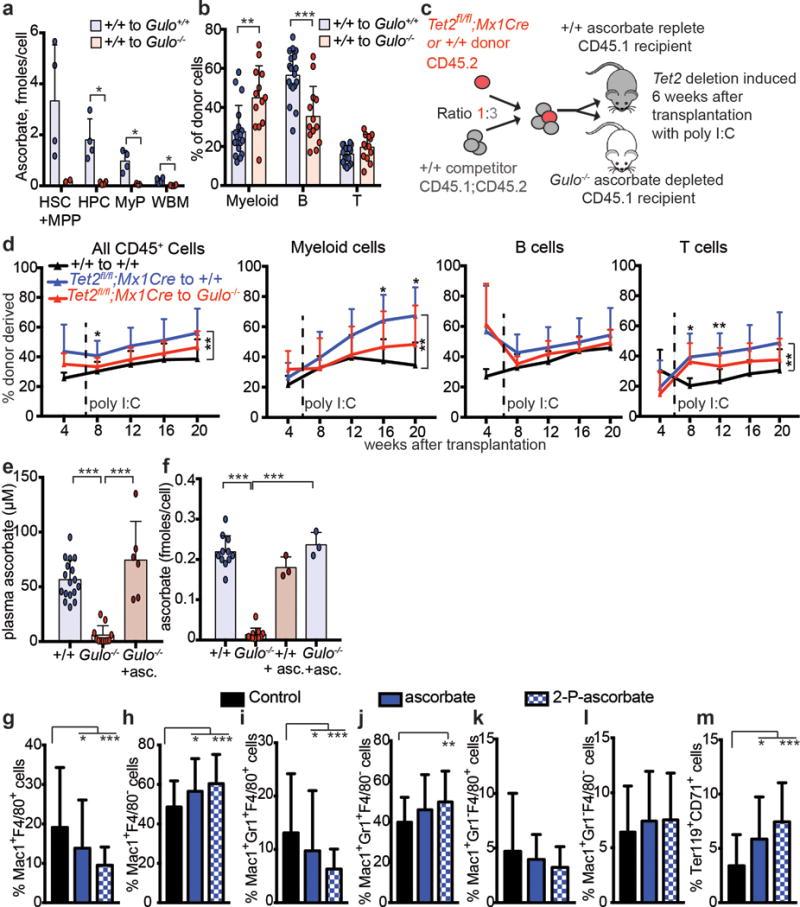
a, Ascorbate levels in sorted cell populations from transplanted recipient mice (a total of n=2-4 mice per genotype from 2 independent experiments). b, Percentage of donor cells that are myeloid, B, or T cells in wild type or Gulo−/− recipients 16 weeks after transplantation (a total of n=13-18 mice per condition analysed in 4 independent experiments). c-d, Competitive transplantation of 500,000 donor bone marrow cells from Tet2fl/fl;Mx1Cre mice or littermate controls along with 1,500,000 competitor wild-type cells into irradiated wild-type (ascorbate replete) or Gulo−/− (ascorbate depleted) mice (a total of 2 donor mice and 5–10 recipient mice per treatment in 2 independent experiments). e, Plasma ascorbate levels in wild type mice, Gulo−/− mice, or Gulo−/− mice fed an ascorbate supplemented diet (a total of n=6-17 mice per condition analysed in 4 independent experiments). f, Ascorbate content in bone marrow cells from wild type and Gulo−/− mice fed normal mouse chow or an ascorbate supplemented diet (a total of n=3-11 mice per condition analysed in 3 independent experiments). g-m, Myeloid and erythroid differentiation were assessed 8 days after culturing HSCs in the presence or absence of ascorbate or its more stable derivative, 2-phospho-ascorbate (a total of n=48 wells for myeloid and 24 wells for erythroid differentiation in 2 independent experiments). All data represent mean±SD. Statistical significance was assessed with Welch’s tests (a-b), Kruskal-Wallis tests (e-m), or a non-parametric mixed model followed by a Kruskal-Wallis test for individual time points (d). We corrected for multiple comparisons by controlling the false discovery rate (*p<0.05, **p<0.01, ***p<0.001).
Extended data figure 7. Gene expression changes in HSCs/MPPs from Gulo−/−, Tet2Δ/Δ, and Tet2Δ/Δ;Gulo−/− mice relative to control HSCs/MPPs.
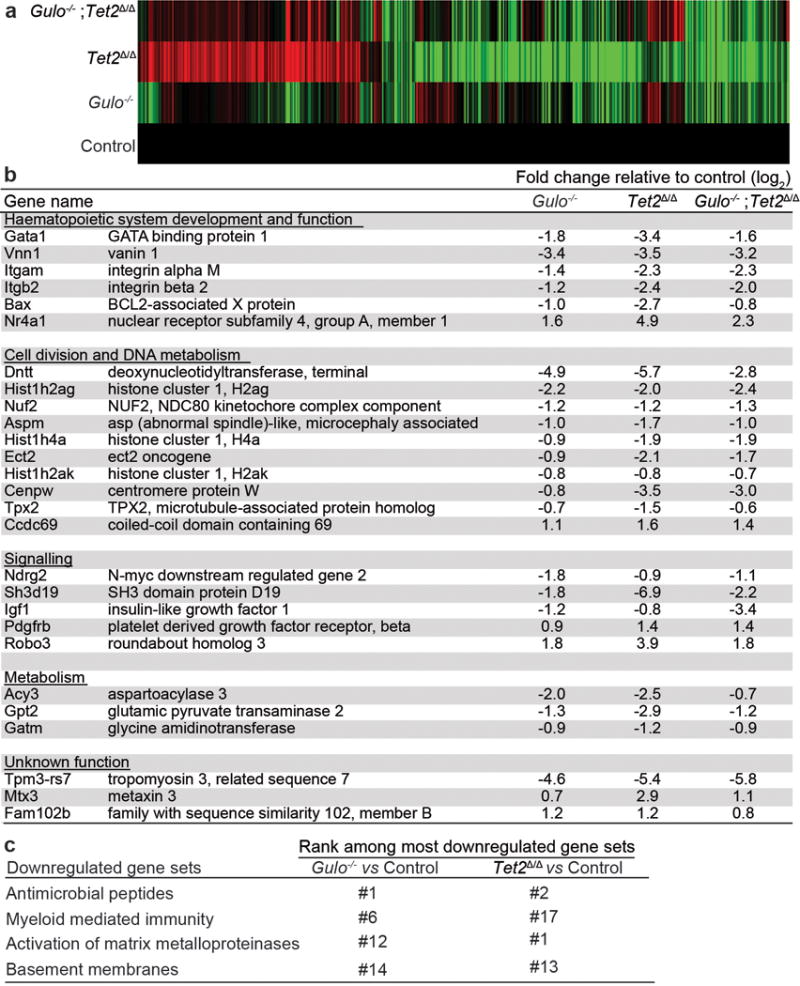
a-c, HSCs/MPPs were isolated from 4–5 month old mice of the indicated genotypes. Mice in all treatments were maintained on low ascorbate water and treated with poly I:C to induce Tet2 recombination by Mx1-Cre two months before HSC/MPP isolation. a, Fold change values for all genes that significantly differed among any combination of genotypes (DESeq2 Likelihood Ratio Tests for differential expression, corrected for multiple comparisons by controlling the false discovery rate). The value for each gene in the control cells was set to 1. Red and green indicate increases and decreases in gene expression, respectively. The number of genes in Gulo−/− and Tet2Δ/Δ HSCs/MPPs that changed in expression in the same direction in both genotypes relative to control HSCs/MPPs was significantly more than would be expected by chance (p=0.01, binomial test). b, Fold change (log2) for HSCs/MPPs of each genotype relative to control HSCs/MPPs. Shown are all genes that changed in the same direction in all three genotypes relative to control and for which log2 fold change was >0.7 or <−0.7 and FPKM>1. Negative fold change values mean gene expression went down in the indicated genotypes compared to control and positive values mean it went up. c, Gene set enrichment analysis showed that of the top 20 gene sets (based on normalized enrichment score) that were downregulated in Gulo−/− as compared to control HSCs/MPPs, 4 were also among the top 20 gene sets downregulated in Tet2Δ/Δ as compared to control HSCs/MPPs (n=3 mice per genotype except for the Tet2 Δ/Δ treatment, for which there were n=2).
Extended data figure 8. Collaboration between Flt3ITD and either Tet2 deficiency or ascorbate depletion.
a-f, Analysis of the frequencies of haematopoietic stem and progenitor cell populations in the bone marrow of 10–12 week old Mx1-Cre;Tet2fl/fl; Flt3ITD mice and littermate controls 3 weeks after poly I:C treatment (12-17 independent experiments; the numbers of mice per treatment in a-c are shown across the top of panel a and for d-f across the top of panel d). g, Percentage of donor-derived haematopoietic cells after competitive transplantation of 300,000 donor bone marrow cells of the indicated genotypes along with 300,000 competing recipient cells into irradiated recipient mice (a total of 2-5 donor mice and 6-20 recipient mice per treatment in 5 independent experiments). h, Secondary transplantation of 5 million bone marrow cells from primary Gulo−/− (ascorbate depleted) recipients of Flt3ITD/+ cells into irradiated wild-type or ascorbate depleted Gulo−/− recipient mice (a total of 3 donor mice and 10-18 recipient mice per treatment in 3 independent experiments). * indicates comparison to wild type and # to Flt3ITD/+. i, Ascorbate levels in donor cells of the indicated genotypes sorted from transplant recipients (a total of n=4 mice per condition from 2 independent experiments). j, Frequencies of donor cells of the indicated genotypes in the blood of transplant recipients described in Fig. 3f–g. k, Analysis of HSC frequency in the fetal liver of embryonic day (E)17.5 mice of the indicated genotypes (5 independent experiments; the numbers of mice per treatment are shown across the top of the panel). All data represent mean±SD. Statistical significance was assessed with one way ANOVAs followed by Fisher’s LSD tests (d, k) or Kruskal Wallis tests (a-c, e). In other cases, we used two-way ANOVAs followed by Fisher’s LSD tests (i) or Kruskal-Wallis tests (j) or a non-parametric mixed model followed by Kruskal-Wallis tests for individual time-points (g, h). We corrected for multiple comparisons by controlling the false discovery rate (*p<0.05, **p<0.01, ***p<0.001).
Extended data figure 9. Analysis of Tet2Δ/+;Flt3ITD leukemias.
a-g, Analysis of recipient mice described in Fig. 4a–d. Statistical significance was assessed with one-way ANOVAs followed by Fisher’s LSD tests (f-g) or Kruskal-Wallis tests (e). d shows representative images from the experiments quantified in Fig. 4a. All data represent mean±SD. We corrected for multiple comparisons by controlling the false discovery rate. *p<0.05, **p<0.01, ***p<0.001.
Extended data figure 10. Analysis of Tet2Δ/+;Flt3ITD and Tet2Δ/Δ;Flt3ITD leukemias.
a-b, Analysis of recipient mice described in Fig. 4e–j. Statistical significance was assessed with one-way ANOVAs followed by Fisher’s LSD tests (b) or Kruskal-Wallis tests (a). c, Western blots with antibodies against the indicated histone modifications were performed using protein extracted from Tet2Δ/+;Flt3ITD/+ leukemia cells isolated by flow cytometry from wild type or ascorbate-depleted Gulo−/− transplant recipients (results are representative of 2 independent experiments). d, Diff-Quik stained blood smears from Gulo−/− recipients of Tet2Δ/+;Flt3ITD/+ cells fed with an ascorbate supplemented diet before and after the engraftment of leukemia cells (representative images from the experiments described in Fig. 5a and quantified in Fig. 5c). Cells with an immature blast-like morphology were more abundant in the blood of ascorbate-depleted Gulo−/− recipients as compared to ascorbate-fed Gulo−/− recipients. e-f, White blood cells in recipient mice from the experiment described in Figure 5a. The statistical significance of differences among treatments was assessed with Kruskal-Wallis tests (a, e, f) or a one-way ANOVA (b) or a two way ANOVA followed by Fisher’s LSD tests (c). All data represent mean±SD. Statistical significance was assessed with corrected for multiple comparisons by controlling the false discovery rate. (*p<0.05, **p<0.01, ***p<0.001).
Supplementary Material
Acknowledgments
S.J.M. is a Howard Hughes Medical Institute (HHMI) Investigator, the Mary McDermott Cook Chair in Pediatric Genetics, the Kathryn and Gene Bishop Distinguished Chair in Pediatric Research, the director of the Hamon Laboratory for Stem Cells and Cancer, and a Cancer Prevention and Research Institute of Texas Scholar. M.A. was a Royal Commission for the Exhibition of 1851 Research Fellow. We thank Fiona Harrison for sharing the Slc23a2−/− mice. We thank Nicolas Loof and the Moody Foundation Flow Cytometry Facility for flow cytometry, and Kristen Correll, Ashley Leach, and Albert Gross for mouse colony management. We thank BioHPC at UT Southwestern for providing high-performance computing. This work was supported by the Cancer Prevention and Research Institute of Texas and the National Institutes of Health (R37 AG024945 and R01 DK100848).
Footnotes
Author contributions
M.A. conceived and performed most experiments. C.M. performed experiments with Tet2fl and Tet2fl;Flt3ITD mice in Extended data Figures 5 and 8. R.J.B. and E.P. performed the histone methylation analysis. E.P. and Z.Z. performed RNA-seq analysis. Z.Z. performed the statistical analyses. G.M.C. assessed haematopathology in Figures 4 and 5. E.B. and B.L.C. provided technical assistance. M.M.M performed collagen staining. W.C. provided human bone marrow specimens. G.J.S. provided some of the data from Slc23a2−/− mice. Z.H., M.A., and R.J.D developed the metabolomics methods and R.J.D. helped to interpret metabolomics results. M.A. and S.J.M. designed experiments, interpreted results, and wrote the manuscript.
The authors declare no competing financial interests.
References
- 1.Garaycoechea JI, et al. Genotoxic consequences of endogenous aldehydes on mouse haematopoietic stem cell function. Nature. 2012;489:571–575. doi: 10.1038/nature11368. [DOI] [PubMed] [Google Scholar]
- 2.Yan H, et al. IDH1 and IDH2 mutations in gliomas. N Engl J Med. 2009;360:765–773. doi: 10.1056/NEJMoa0808710. [DOI] [PMC free article] [PubMed] [Google Scholar]
- 3.Mihaylova MM, Sabatini DM, Yilmaz OH. Dietary and metabolic control of stem cell function in physiology and cancer. Cell Stem Cell. 2014;14:292–305. doi: 10.1016/j.stem.2014.02.008. [DOI] [PMC free article] [PubMed] [Google Scholar]
- 4.Zhang H, et al. NAD(+) repletion improves mitochondrial and stem cell function and enhances life span in mice. Science. 2016;352:1436–1443. doi: 10.1126/science.aaf2693. [DOI] [PubMed] [Google Scholar]
- 5.Agathocleous M, et al. Metabolic differentiation in the embryonic retina. Nat Cell Biol. 2012;14:859–864. doi: 10.1038/ncb2531. [DOI] [PMC free article] [PubMed] [Google Scholar]
- 6.Wang J, et al. Dependence of mouse embryonic stem cells on threonine catabolism. Science. 2009;325:435–439. doi: 10.1126/science.1173288. [DOI] [PMC free article] [PubMed] [Google Scholar]
- 7.Blaschke K, et al. Vitamin C induces Tet-dependent DNA demethylation and a blastocyst-like state in ES cells. Nature. 2013;500:222–226. doi: 10.1038/nature12362. [DOI] [PMC free article] [PubMed] [Google Scholar]
- 8.Carey BW, Finley LW, Cross JR, Allis CD, Thompson CB. Intracellular alpha-ketoglutarate maintains the pluripotency of embryonic stem cells. Nature. 2015;518:413–416. doi: 10.1038/nature13981. [DOI] [PMC free article] [PubMed] [Google Scholar]
- 9.Naka K, et al. Dipeptide species regulate p38MAPK-Smad3 signalling to maintain chronic myelogenous leukaemia stem cells. Nat Commun. 2015;6:8039. doi: 10.1038/ncomms9039. [DOI] [PMC free article] [PubMed] [Google Scholar]
- 10.Takubo K, et al. Regulation of glycolysis by Pdk functions as a metabolic checkpoint for cell cycle quiescence in hematopoietic stem cells. Cell Stem Cell. 2013;12:49–61. doi: 10.1016/j.stem.2012.10.011. [DOI] [PMC free article] [PubMed] [Google Scholar]
- 11.Simsek T, et al. The distinct metabolic profile of hematopoietic stem cells reflects their location in a hypoxic niche. Cell Stem Cell. 2010;7:380–390. doi: 10.1016/j.stem.2010.07.011. [DOI] [PMC free article] [PubMed] [Google Scholar]
- 12.May JM. The SLC23 family of ascorbate transporters: ensuring that you get and keep your daily dose of vitamin C. Br J Pharmacol. 2011;164:1793–1801. doi: 10.1111/j.1476-5381.2011.01350.x. [DOI] [PMC free article] [PubMed] [Google Scholar]
- 13.Seita J, et al. Gene Expression Commons: an open platform for absolute gene expression profiling. PLoS One. 2012;7:e40321. doi: 10.1371/journal.pone.0040321. [DOI] [PMC free article] [PubMed] [Google Scholar]
- 14.Manning J, et al. Vitamin C promotes maturation of T-cells. Antioxid Redox Signal. 2013;19:2054–2067. doi: 10.1089/ars.2012.4988. [DOI] [PMC free article] [PubMed] [Google Scholar]
- 15.Young JI, Zuchner S, Wang G. Regulation of the Epigenome by Vitamin C. Annu Rev Nutr. 2015;35:545–564. doi: 10.1146/annurev-nutr-071714-034228. [DOI] [PMC free article] [PubMed] [Google Scholar]
- 16.Wang T, et al. The histone demethylases Jhdm1a/1b enhance somatic cell reprogramming in a vitamin-C-dependent manner. Cell Stem Cell. 2011;9:575–587. doi: 10.1016/j.stem.2011.10.005. [DOI] [PubMed] [Google Scholar]
- 17.Kivirikko KI, Myllyla R, Pihlajaniemi T. Protein hydroxylation: prolyl 4-hydroxylase, an enzyme with four cosubstrates and a multifunctional subunit. FASEB J. 1989;3:1609–1617. [PubMed] [Google Scholar]
- 18.Rebouche CJ. Ascorbic acid and carnitine biosynthesis. Am J Clin Nutr. 1991;54:1147S–1152S. doi: 10.1093/ajcn/54.6.1147s. [DOI] [PubMed] [Google Scholar]
- 19.Knowles HJ, Raval RR, Harris AL, Ratcliffe PJ. Effect of ascorbate on the activity of hypoxia-inducible factor in cancer cells. Cancer Res. 2003;63:1764–1768. [PubMed] [Google Scholar]
- 20.Vukovic M, et al. Adult hematopoietic stem cells lacking Hif-1alpha self-renew normally. Blood. 2016;127:2841–2846. doi: 10.1182/blood-2015-10-677138. [DOI] [PMC free article] [PubMed] [Google Scholar]
- 21.Yin R, et al. Ascorbic acid enhances Tet-mediated 5-methylcytosine oxidation and promotes DNA demethylation in mammals. J Am Chem Soc. 2013;135:10396–10403. doi: 10.1021/ja4028346. [DOI] [PubMed] [Google Scholar]
- 22.Chen J, et al. Vitamin C modulates TET1 function during somatic cell reprogramming. Nat Genet. 2013;45:1504–1509. doi: 10.1038/ng.2807. [DOI] [PubMed] [Google Scholar]
- 23.Minor EA, Court BL, Young JI, Wang G. Ascorbate induces ten-eleven translocation (Tet) methylcytosine dioxygenase-mediated generation of 5-hydroxymethylcytosine. J Biol Chem. 2013;288:13669–13674. doi: 10.1074/jbc.C113.464800. [DOI] [PMC free article] [PubMed] [Google Scholar]
- 24.Ito S, et al. Tet proteins can convert 5-methylcytosine to 5-formylcytosine and 5-carboxylcytosine. Science. 2011;333:1300–1303. doi: 10.1126/science.1210597. [DOI] [PMC free article] [PubMed] [Google Scholar]
- 25.Tahiliani M, et al. Conversion of 5-methylcytosine to 5-hydroxymethylcytosine in mammalian DNA by MLL partner TET1. Science. 2009;324:930–935. doi: 10.1126/science.1170116. [DOI] [PMC free article] [PubMed] [Google Scholar]
- 26.Jan M, et al. Clonal evolution of preleukemic hematopoietic stem cells precedes human acute myeloid leukemia. Sci Transl Med. 2012;4:149ra118. doi: 10.1126/scitranslmed.3004315. [DOI] [PMC free article] [PubMed] [Google Scholar]
- 27.Moran-Crusio K, et al. Tet2 loss leads to increased hematopoietic stem cell self-renewal and myeloid transformation. Cancer Cell. 2011;20:11–24. doi: 10.1016/j.ccr.2011.06.001. [DOI] [PMC free article] [PubMed] [Google Scholar]
- 28.Ko M, et al. Ten-Eleven-Translocation 2 (TET2) negatively regulates homeostasis and differentiation of hematopoietic stem cells in mice. Proc Natl Acad Sci U S A. 2011;108:14566–14571. doi: 10.1073/pnas.1112317108. [DOI] [PMC free article] [PubMed] [Google Scholar]
- 29.Quivoron C, et al. TET2 inactivation results in pleiotropic hematopoietic abnormalities in mouse and is a recurrent event during human lymphomagenesis. Cancer Cell. 2011;20:25–38. doi: 10.1016/j.ccr.2011.06.003. [DOI] [PubMed] [Google Scholar]
- 30.Abdel-Wahab O, et al. Genetic characterization of TET1, TET2, and TET3 alterations in myeloid malignancies. Blood. 2009;114:144–147. doi: 10.1182/blood-2009-03-210039. [DOI] [PMC free article] [PubMed] [Google Scholar]
- 31.Shih AH, et al. Mutational cooperativity linked to combinatorial epigenetic gain of function in acute myeloid leukemia. Cancer Cell. 2015;27:502–515. doi: 10.1016/j.ccell.2015.03.009. [DOI] [PMC free article] [PubMed] [Google Scholar]
- 32.Delhommeau F, et al. Mutation in TET2 in myeloid cancers. N Engl J Med. 2009;360:2289–2301. doi: 10.1056/NEJMoa0810069. [DOI] [PubMed] [Google Scholar]
- 33.Schleicher RL, Carroll MD, Ford ES, Lacher DA. Serum vitamin C and the prevalence of vitamin C deficiency in the United States: 2003–2004 National Health and Nutrition Examination Survey (NHANES) Am J Clin Nutr. 2009;90:1252–1263. doi: 10.3945/ajcn.2008.27016. [DOI] [PubMed] [Google Scholar]
- 34.Pronier E, et al. Inhibition of TET2-mediated conversion of 5-methylcytosine to 5-hydroxymethylcytosine disturbs erythroid and granulomonocytic differentiation of human hematopoietic progenitors. Blood. 2011;118:2551–2555. doi: 10.1182/blood-2010-12-324707. [DOI] [PMC free article] [PubMed] [Google Scholar]
- 35.Patel JP, et al. Prognostic relevance of integrated genetic profiling in acute myeloid leukemia. N Engl J Med. 2012;366:1079–1089. doi: 10.1056/NEJMoa1112304. [DOI] [PMC free article] [PubMed] [Google Scholar]
- 36.Cimmino L, et al. TET1 is a tumor suppressor of hematopoietic malignancy. Nat Immunol. 2015;16:653–662. doi: 10.1038/ni.3148. [DOI] [PMC free article] [PubMed] [Google Scholar]
- 37.An J, et al. Acute loss of TET function results in aggressive myeloid cancer in mice. Nat Commun. 2015;6:10071. doi: 10.1038/ncomms10071. [DOI] [PMC free article] [PubMed] [Google Scholar]
- 38.Loria CM, Klag MJ, Caulfield LE, Whelton PK. Vitamin C status and mortality in US adults. Am J Clin Nutr. 2000;72:139–145. doi: 10.1093/ajcn/72.1.139. [DOI] [PubMed] [Google Scholar]
- 39.Khaw KT, et al. Relation between plasma ascorbic acid and mortality in men and women in EPIC-Norfolk prospective study: a prospective population study. European Prospective Investigation into Cancer and Nutrition. Lancet. 2001;357:657–663. doi: 10.1016/s0140-6736(00)04128-3. [DOI] [PubMed] [Google Scholar]
- 40.Liu M, et al. Vitamin C increases viral mimicry induced by 5-aza-2′-deoxycytidine. Proc Natl Acad Sci U S A. 2016;113:10238–10244. doi: 10.1073/pnas.1612262113. [DOI] [PMC free article] [PubMed] [Google Scholar]
- 41.Huijskens MJ, Wodzig WK, Walczak M, Germeraad WT, Bos GM. Ascorbic acid serum levels are reduced in patients with hematological malignancies. Results Immunol. 2016;6:8–10. doi: 10.1016/j.rinim.2016.01.001. [DOI] [PMC free article] [PubMed] [Google Scholar]
- 42.Moertel CG, et al. High-dose vitamin C versus placebo in the treatment of patients with advanced cancer who have had no prior chemotherapy. A randomized double-blind comparison. N Engl J Med. 1985;312:137–141. doi: 10.1056/NEJM198501173120301. [DOI] [PubMed] [Google Scholar]
- 43.Yun J, et al. Vitamin C selectively kills KRAS and BRAF mutant colorectal cancer cells by targeting GAPDH. Science. 2015;350:1391–1396. doi: 10.1126/science.aaa5004. [DOI] [PMC free article] [PubMed] [Google Scholar]
- 44.Chen Q, et al. Pharmacologic doses of ascorbate act as a prooxidant and decrease growth of aggressive tumor xenografts in mice. Proc Natl Acad Sci U S A. 2008;105:11105–11109. doi: 10.1073/pnas.0804226105. [DOI] [PMC free article] [PubMed] [Google Scholar]
- 45.Busque L, et al. Recurrent somatic TET2 mutations in normal elderly individuals with clonal hematopoiesis. Nat Genet. 2012;44:1179–1181. doi: 10.1038/ng.2413. [DOI] [PMC free article] [PubMed] [Google Scholar]
- 46.Genovese G, et al. Clonal hematopoiesis and blood-cancer risk inferred from blood DNA sequence. N Engl J Med. 2014;371:2477–2487. doi: 10.1056/NEJMoa1409405. [DOI] [PMC free article] [PubMed] [Google Scholar]
- 47.Jaiswal S, et al. Age-related clonal hematopoiesis associated with adverse outcomes. N Engl J Med. 2014;371:2488–2498. doi: 10.1056/NEJMoa1408617. [DOI] [PMC free article] [PubMed] [Google Scholar]
- 48.Maeda N, et al. Aortic wall damage in mice unable to synthesize ascorbic acid. Proc Natl Acad Sci U S A. 2000;97:841–846. doi: 10.1073/pnas.97.2.841. [DOI] [PMC free article] [PubMed] [Google Scholar]
- 49.Lee BH, et al. FLT3 mutations confer enhanced proliferation and survival properties to multipotent progenitors in a murine model of chronic myelomonocytic leukemia. Cancer Cell. 2007;12:367–380. doi: 10.1016/j.ccr.2007.08.031. [DOI] [PMC free article] [PubMed] [Google Scholar]
- 50.Sotiriou S, et al. Ascorbic-acid transporter Slc23a1 is essential for vitamin C transport into the brain and for perinatal survival. Nat Med. 2002;8:514–517. doi: 10.1038/0502-514. [DOI] [PubMed] [Google Scholar]
- 51.Kuhn R, Schwenk F, Aguet M, Rajewsky K. Inducible gene targeting in mice. Science. 1995;269:1427–1429. doi: 10.1126/science.7660125. [DOI] [PubMed] [Google Scholar]
- 52.Washko PW, Welch RW, Dhariwal KR, Wang Y, Levine M. Ascorbic acid and dehydroascorbic acid analyses in biological samples. Anal Biochem. 1992;204:1–14. doi: 10.1016/0003-2697(92)90131-p. [DOI] [PubMed] [Google Scholar]
- 53.Mullen AR, et al. Oxidation of alpha-ketoglutarate is required for reductive carboxylation in cancer cells with mitochondrial defects. Cell Rep. 2014;7:1679–1690. doi: 10.1016/j.celrep.2014.04.037. [DOI] [PMC free article] [PubMed] [Google Scholar]
- 54.Xia J, Sinelnikov IV, Han B, Wishart DS. MetaboAnalyst 3.0–making metabolomics more meaningful. Nucleic Acids Res. 2015;43:W251–257. doi: 10.1093/nar/gkv380. [DOI] [PMC free article] [PubMed] [Google Scholar]
- 55.Doulatov S, et al. Revised map of the human progenitor hierarchy shows the origin of macrophages and dendritic cells in early lymphoid development. Nat Immunol. 2010;11:585–593. doi: 10.1038/ni.1889. [DOI] [PubMed] [Google Scholar]
- 56.Kogan SC, et al. Bethesda proposals for classification of nonlymphoid hematopoietic neoplasms in mice. Blood. 2002;100:238–245. doi: 10.1182/blood.v100.1.238. [DOI] [PubMed] [Google Scholar]
- 57.Noguchi K, Gel YR, Brunner E, Konietschke F. NparLD: An R Software Package for the Nonparametric Analysis of Longitudinal Data in Factorial Experiments. Journal of Statistical Software. 2012;50:1–23. [Google Scholar]
- 58.Acar M, et al. Deep imaging of bone marrow shows non-dividing stem cells are mainly perisinusoidal. Nature. 2015;526:126–130. doi: 10.1038/nature15250. [DOI] [PMC free article] [PubMed] [Google Scholar]
Associated Data
This section collects any data citations, data availability statements, or supplementary materials included in this article.
Supplementary Materials
Data Availability Statement
RNA-seq data have been submitted to the Sequence Read Archive (SRA) with BioProject ID: PRJNA391832 and SRA ID: SRP110757. The source data file contains all of the numeric data from all figures and extended data figures.