Abstract
Purpose
Recent NMR and MRI studies have measured a fast-relaxing signal component with in white matter and myelin extracts. In ex vivo studies, evidence suggests that a large fraction of this component directly arises from bound protons in the myelin phospholipid membranes. Based on these results, this ultrashort-T2 component in nervous tissue is a new potential imaging biomarker of myelination, which plays a critical role in neuronal signal conduction across the brain and loss or degradation of myelin is a key feature of many neurological disorders. The goal of this work was to to characterize the relaxation times and frequency shifts of ultrashort-T2 components in the human brain.
Methods
This required development of an ultrashort echo time (UTE) relaxometry acquisition strategy and fitting procedure for robust measurements in the presence of ultrashort relaxation times and large frequency shifts.
Results
We measured an ultrashort-T2 component in healthy volunteers with a median between 0.5–0.7 ms at 3T and 0.2–0.3 ms at 7T as well as an approximately −3 ppm frequency shift from water.
Conclusion
To our knowledge, this is the first time a chemical shift of the ultrashort-T2 brain component has been measured in vivo. This chemical shift, at around 1.7 ppm, is similar to the primary resonance of most lipids, indicating that much of the ultrashort-T2 component observed in vivo arises from bound protons in the myelin phospholipid membranes.
Keywords: Myelin imaging, ultrashort echo time (UTE) MRI, ultrashort-T2, relaxometry, myelin membranes
Introduction
Myelin plays a critical role in neuronal signal conduction across the brain. It is an insulating layer of phospholipid membranes (“sheaths”) around axons that significantly increases the speed of electrical impulses carrying information between neural cells. Myelin formation begins shortly after birth, continuing well into the 5th decade of life in humans (1), and is the basis for long range neural networks. The degree of myelination and its structure are also a key feature of many neurological disorders, especially demyelinating diseases such as multiple sclerosis (MS), leukodystrophies, and neruodegeneration such as Alzheimers’ disease (2, 3).
MRI is the preferred non-invasive imaging modality for assessing myelin, providing sensitivity to water content, binding, and diffusion. Current myelin MRI methods detect signals generated by protons in the water within the myelin sheaths (“myelin water”) and surrounding intra and extra cellular free water. These methods most generally include diffusion, magnetization transfer (MT), and T1/T2 relaxation (e.g. myelin water imaging) (4). These current myelin MRI methods provide a wealth of information, but fundamentally rely on detection of signals from water protons in and around myelin.
MRI also can detect signals from bound protons in the brain, such as those within myelin phospholipid membranes themselves, that could provide a new imaging biomarker of myelin with complimentary information to current methods (5–9). Detecting these signals is challenging due to their “ultrashort-T2” relaxation times and requires specialized methods such as ultrashort echo time (UTE) MRI (10, 11). Ex vivo nuclear magnetic resonance (NMR) experiments originally speculated that ultrashort-T2 components observed in brain tissue were arising primarily from methylene protons in the myelin phospholipid membranes (5, 6). These studies measured T2 and values between 50 μs and 1 ms at 4.7 T in myelin extracts and spinal cord samples. With such rapid relaxation rates, these ultrashort-T2 components will not be detected in conventional MRI pulse sequences due to the minimum echo times (TE) of approximately 1 ms between excitation and acquisition. When applying UTE MRI to in vivo brain studies, a handful of studies have observed an ultrashort-T2 component in white matter with values of 100 – 350 μs (1.5T) (12), 600 – 900 μs (1.5T) (13), and 420±80 μs (3T) (7,8) that are consistent with recent ex vivo studies (5,6). The most recent studies used a 2D UTE MRI method with inversion recovery and dual-echo subtraction for selective imaging of this ultrashort-T2 component in vivo (7–9). Imaging these ultrashort-T2 signals has great potential to provide a new in vivo measurement of myelin that arises directly from protons in the myelin phospholipid membranes, and thus may be a more sensitive measurement of myelin density, integrity, and structure.
The goal of this work was to to characterize the in vivo relaxation times and frequency shifts of ultrashort-T2 components in the human brain. This required development of an ultrashort echo time (UTE) relaxometry acquisition strategy and fitting procedure that was required for robust measurements in the presence of ultrashort relaxation times and large frequency shifts. This included a multi-echo 3D UTE MRI pulse sequence with echo order randomization for accurate quantification and motion robustness. Images were reconstructed with parallel imaging and complex data was fit to a multi-compartment model, including estimation of frequency shifts. This manuscript reports measured and frequency shifts for ultrashort-T2 components in healthy volunteers at 3T and 7T.
Methods
Data Acquisition
Whole-brain relaxometry was performed using a 3D radial pulse sequence supporting ultrashort echo times (UTEs) with a non-selective, hard pulse excitation (Fig. 1). The delay between excitation and readout was shifted between TRs to acquire a set of 32 different TEs within a single scan, ranging from 56 μs to 5.03 ms: TE = [ 56, 72, 92, 112, 152, 192, 232, 312, 392, 472, 632, 832, 1032, 1232, 1432, 1632, 1832, 2032, 2232, 2432, 2632, 2832, 3032, 3232, 3432, 3632, 3832, 4032, 4232, 4432, 4632, 5032] μs. A total of 12 TEs were <1 ms, chosen to achieve the goal of measuring sub-millisecond T2 components.
Figure 1.
Ultrashort echo time relaxometry acquisition strategy: (a,b) A 3D radial pulse sequence supporting ultrashort echo times (UTEs) was used, with variable echo times, TEi. (c) We implemented sequential and random acquisition order strategies in which all TEi for an individual radial spoke were acquired together. This was done to minimize potential motion artifacts.
We chose to sample the same spoke in k-space repeatedly with multiple TEs to minimize the chance of motion artifacts that will likely be problematic over the long scan times required. Two TE ordering strategies were tested: (1) a sequential, regular TE ordering, and a (2) randomized TE ordering, where the ordering is randomized for each spoke (Fig. 1c).
Scan times were approximately 45 minutes for 2.2mm isotropic resolution, whole brain coverage, 32 TEs, TR = 10ms, and undersampling factors of 4.1–5.8. Other parameters included 8 – 10° flip angles, 40–52 μs excitation pulse, 256 readout points with ±250 kHz sampling bandwidth for a 0.512 ms readout duration, and support for anisotropic FOVs (14). Spoiling between TRs was achieved with a crusher gradient and RF spoiling.
Data was acquired on 3T and 7T MRI systems (GE Healthcare), both with a 32-channel head coil (Nova Medical) and 50 mT/m maximum amplitude, 200 mT/m/ms maximum slew rate gradients. 5 healthy volunteers (all males, ages 21–36) were scanned at both 3T and 7T within one week. Informed consent was obtained before scans under an Institutional Review Board (IRB) approved protocol.
Image Reconstruction
A non-Cartesian ESPIRiT parallel imaging reconstruction method (15) was implemented for the 3D ramp-sampled radial k-space trajectory using the Berkeley Advanced Reconstruction Toolbox (BART, https://mrirecon.github.io/bart/). This was applied to each TE image, which were each undersampled by a factor 4.1–5.8. For coil combination, the complex-valued coil sensitivity maps were first extracted from the center of k-space using the ESPIRIT algorithm. Then the 32 channel raw images were combined as a pixel-wise sum weighted with the estimated coil sensitivity maps, which includes estimation of the phases from different channels for realignment.
We also reconstructed images at two different frequencies corresponding to the expected resonance frequencies of water and fat. The purpose was to create images without spatial blurring resulting due to chemical shift for components at both water and fat frequencies. In other words, the water-frequency reconstructions, m̂w(x), will have an accurate representation of water-frequency components, mw(x), but blurring for fat-frequency components, mf (x):
| (1) |
The artifacts for the fat-frequency component, at a frequency offset ff from water, are described by h(x, f) which is the point spread function of the 3D UTE trajectory in the presence of frequency differences, f, from the nominal resonance frequency. Convolution with this function can create blurring and ringing artifacts. On the other hand, fat-frequency reconstructions, m̂f (x), will have an accurate representation of fat-frequency components, but blurring for water-frequency components:
| (2) |
The water-frequency reconstructions used the original data, for which the center frequency was nominally set to water, whereas for fat-frequency reconstructions the original data was demodulated by the approximate fat frequencies, ff = −440 and −1000 Hz for 3T and 7T, respectively, prior to non-Cartesian ESPIRiT reconstruction. This was achieved by multiplying the raw signal data, s(t), by exp(i2πff (t − TE)), prior to the reconstruction procedure described above in an effort to remove the phase accumulation due to the fat chemical shift during the readout.
The limitation of this approach is that it does not account for local off-resonance due to B0 inhomogeneity or susceptibility differences, but this could potentially be included with additional multi-frequency reconstructions.
An intensity bias field due to the RF transmit and receive inhomogeneity was roughly estimated as follows. First, the brain was extracted, the brain mask was dilated to extend into the skull to compute the correction only across the brain. Then a 3D Gaussian filtering was applied to the minimum TE image across the dilated brain-mask region to minimize tissue-specific intensity variations. This was removed from combined coil images.
Data Analysis
We fit our multiple TE data to an N-component signal model, including signal amplitudes Ŝ0,k, effective relaxation times, , frequency shifts, Δfk, and phase shifts, ϕk for each component:
| (3) |
The data was fit using a non-linear least squares solver in Matlab (Mathworks) with constrained parameter values. Note that complex-valued image data was retained with the ESPIRiT reconstruction, providing additional information regarding frequency and phase shifts. Fitting was performed in several steps in an attempt to avoid solutions local minima. We first fit a single component (“long-T2 component”) that was near the water frequency, which was consistently the dominant component with the largest fraction that had the longest (typically > 10 ms). This fitting was unconstrained. The frequency offset of this component also provides an estimate of the B0 field map. We then performed two or three component fitting, where the frequency offset of the long-T2 component was constrained to to be within ±50 Hz of the result from the initial single component fit. The second and third components were constrained to have a because the minimum TE = 56 μs and a 512 μs readout duration make it challenging to estimate this range of . Fitting the additional components used initial estimates of and Δf = −3.5 for an ultrashort component, and and Δf = 0 ppm for an intermediate component, but these parameters were otherwise unbounded except for the lower bound on . This same process was applied to both the water-frequency and fat-frequency reconstructions.
We evaluated the number of components in this model, N, that would be appropriate for our measurements based on Akaike’s Information Criteria (AIC) - a measure of the relative quality of a signal model that includes a tradeoff between goodness of fit and complexity of the model. We computed a normalized AIC value for each fit. Regions of interest (ROIs) were selected for analysis from the UTE image at the shortest TE (Fig. 2). Statistical comparisons of fit results between different regions of interest (ROIs) were performed using a paired T-test.
Figure 2.
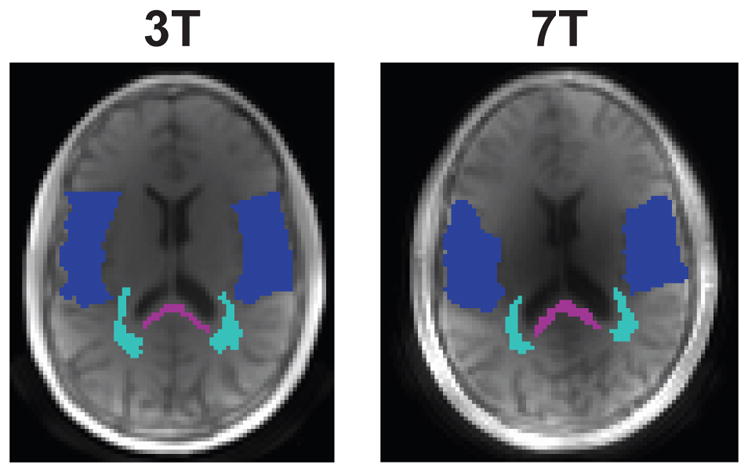
ROI locations used for the the fit results in 4 and analysis in Table 1, overlaid on the shortest TE images. Purple corresponds to the posterior corpus callosum (pCC), light blue to mixed white matter (mixed WM) and dark blue to mixed gray matter (mixed GM). Note the latter ROIs are mixed, meaning they are primarily WM or GM but maybe include contributions from other tissue types including CSF.
We also computed an ultrashort- component fraction as:
| (4) |
where the first component of our signal model had the shortest . This describes the relative contribution of the ultrashort component, which is also normalized to remove inhomogeneity due to the RF receive coil profiles.
Results
Acquisition Strategy
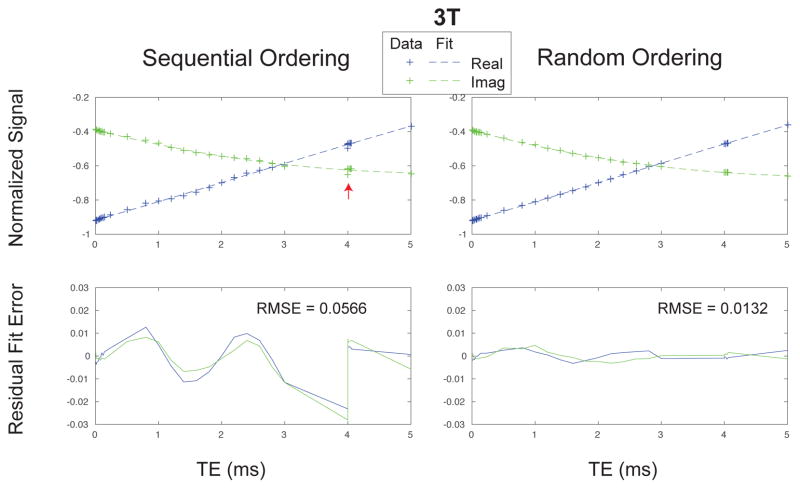
The randomized TE ordering was crucial in our ultrashort echo time relaxometry method (Fig. 3 and Supporting Fig. S1). Using a naive sequential TE ordering (our initial approach) led to unexpected signal fluctuations along the TE dimension, demonstrated by phantom experiments of a homogeneous doped water sphere. The sequential TE ordering data deviates notably from a mono-exponential fit (arrows). For testing purposes, a single TE was acquired repeatedly (TE = 4 ms), and there were fluctuations between these repeated measurements. Randomized TE ordering greatly improved the mono-exponential fit quality, and repeated TE measurements were consistent.
Figure 3.
Water sphere phantom results demonstrating the importance of randomized TE ordering for accurate relaxometry. The acquisition strategy is shown in Fig. 1. The sequential TE ordering has unexpected signal fluctuations, even at the same TE (red arrows), whereas the random TE ordered data better represents the expected mono-exponential decay.
Signal Model and Data Fitting
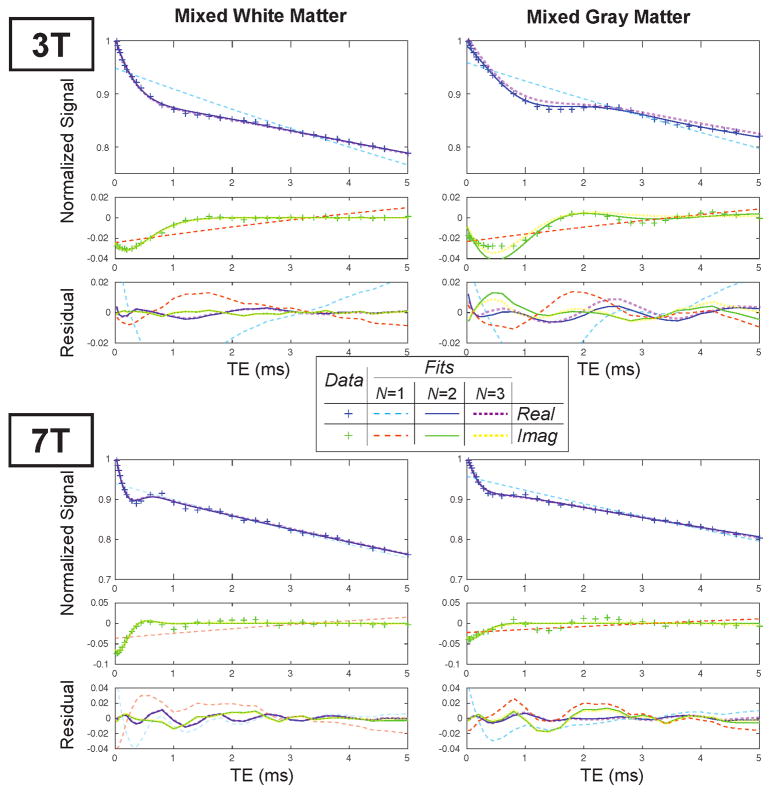
In vivo ultrashort TE relaxometry clearly showed a fast-relaxing component with a frequency shift relative to the longer components (Fig. 4). This component is not captured by a single-component fitting (long-dashed lines in Fig. 4), and the frequency offset is shown by modulations in the complex valued data. It can also be seen that this frequency offset scales with field strength between 3T and 7T. Fits with a 2-component model (N = 2 in Eq. 3, solid lines in Fig. 4) are able to represent the ultrashort- component, with substantially reduced residuals. We also evaluated fitting this data with a 3-component model (short-dashed lines in Fig. 4). For the mixed white matter ROIs, these were nearly identical to the 2-component model.
Figure 4.
Fit results at 3T and 7T for the same volunteer in several ROI locations identified in Fig. 2. The data shown was zero-order phase corrected and demodulated based on the estimated field map for these plots to illustrate the complex-valued signal oscillations. Fits to Eq. 3 with N = 1, 2, 3 components are shown as well as the fitting resiudals.
In the mixed gray matter ROIs, there was more residual signal oscillations with the 2- component model, and even the 3-component model was not able to represent these oscillations. This ROI was closer to the skull so experienced more contamination from skull lipid signals, and also contained regions of CSF. The residuals were higher at 7T.
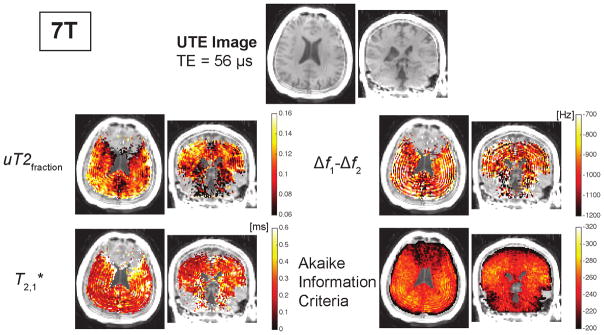
We computed Akaike’s Information Criteria (AIC) voxel-wise to evaluate the appropriate number of components for the ultrashort-TE relaxometry data. In 91.0% and 80.0% of brain voxels at 3T and 7T, respectively, the AIC for a 2-component model (AIC2) was the smallest, where a lower AIC indicates a better model. Furthermore, in each experiment, the majority of voxels had a smaller AIC for a 2-component model that was statistically significantly lower than the 3-component model AIC values. The average AIC values across all were −264.9 ± 32.9 and −250.4 ± 29.4 for the 2- and 3-compartment models at 3T, respectively; and −229.1±37.8 and −220.2±34.2 for the 2- and 3-compartment models at 7T, respectively (standard deviation is across all brain voxels). The higher AIC values at 7T indicate that the data did not fit the model as well when compared to 3T, which can also be seen in the examples in Fig. 4. Based on these results, we only present the 2-compartment model in the rest of this paper.
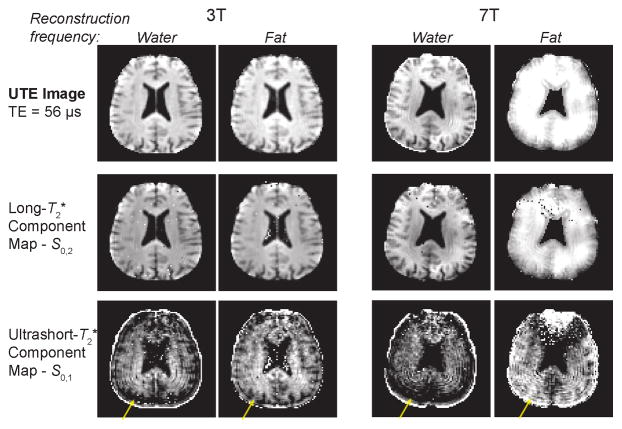
Another key aspect of our fitting method was the use of fat- and water-frequency reconstructed images (as described in the Methods) to improve the spatial accuracy of the frequency-shifting ultrashort- component. As illustrated in Figure 5, water-frequency reconstructions of the UTE image and the long- component maps based on these reconstructions show clearly defined anatomical features, while the ultrashort- component maps show blurring as well as signal losses near the skull (yellow arrows). Conversely, for the fat-frequency reconstructions the ultrashort- component have more apparent correspondance with anatomical features while the long- component maps and UTE images show blurring. This type of isotropic spatial blurring will occur due to phase accumulation from off-resonance during the 3D radial trajectories used. The blurring and signal losses are exacerbated at 7T compared to 3T. The spatial blurring of the ultrashort- component when using a water-frequency reconstruction is another source of evidence that this component has a frequency offset due to chemical shift.
Figure 5.
Spatial characteristics of the ultrashort- and long- component maps using water- and fat-frequency reconstructions. The UTE images and long- components show more clearly defined anatomical features with a water-frequency reconstruction, while the ultrashort- component is much more clearly defined with a fat-frequency reconstruction based fitting. The yellow arrows show apparent signal loss near the skull with the water-frequency reconstructions. The spatial blurring is exacerbated at 7T compared to 3T. At 7T, the fitting of the ultrashort- component failed near the frontal sinus as shown in the top of these images.
In Vivo Characterization
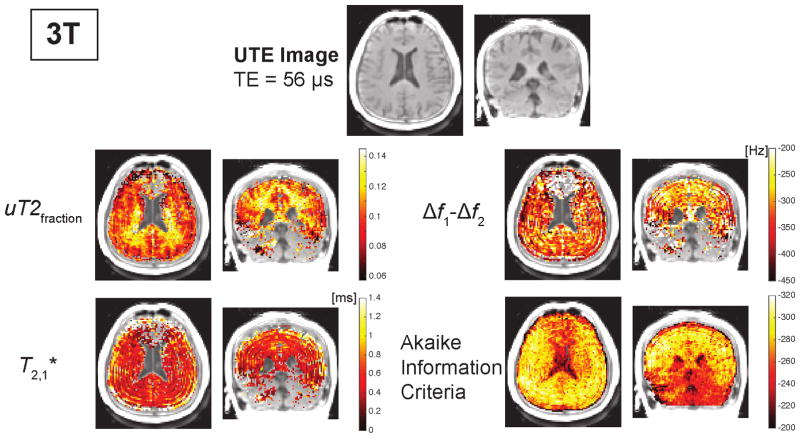
Maps of fit parameters from a two-component model are shown for one volunteer in Figs. 6, 7, and Supporting Fig. S2. The AIC maps shown at the bottom row illustrate that the fitting and model quality was better at 3T compared to 7T. They also showed that at both field strengths the model and fitting performed poorly in regions with large frequency shifts due to changes in the magnetic field. These are particularly strong in the frontal lobe near the sinuses, due to magnetic susceptibility differences, and in the cerebellum, and can be identified in Supporting Fig. S2 by the more increased spatial variability in the field maps.
Figure 6.
Representative UTE images and parameter maps from a two-component fit at 3T. The parameter maps are only shown for regions with AIC values less than −260. The ultrashort- components were calculated based on the fat-frequency reconstruction. The ultrashort- component frequency offset, Δf1 − Δf2, includes correction for B0 inhomogeneity. The AIC maps show the fitting performed worse near the sinuses due to susceptibility shifts and in the cerebellum. Additional maps resulting from the fitting are shown in Supporting Fig. S2.
Figure 7.
Representative UTE images and parameter maps from a two-component fit at 7T. The parameter maps are only shown for regions with AIC values less than − 235. The ultrashort- components were calculated based on the fat-frequency reconstruction. The ultrashort- component frequency offset, Δf1 − Δf2, includes correction for B0 inhomogeneity. The AIC maps show the fitting performed worse near the sinuses due to susceptibility shifts and near the skull due to contamination from skull lipid signals. The AIC values were higher at 7T compared to 3T (Fig. 6). Additional maps resulting from the fitting are shown in Supporting Fig. S2.
Maps of the ultrashort- component fraction at 3T showed a spatial distribution that is approximately concordant with expected white matter distribution across the brain (Fig. 6). This concordance was more ambiguous at 7T, with some variations between the center and outside of the brain that were not seen at 3T. The and frequency offset of the ultrashort component showed no clear associations with brain anatomy. The frequency offset shows some spatial fluctuations emanating from the skull, likely due to ringing artifacts from skull lipids. The long- maps (Supporting Fig. S2) show increasing across white matter, gray matter and CSF, as expected (16, 17).
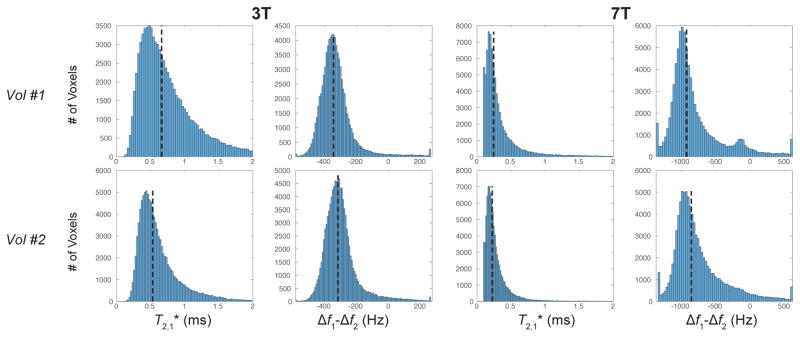
Histograms of the ultrashort component relaxation time, , and frequency offset relative to water (i.e. corrected for B0 inhomogeneity), Δf1− Δf2, are shown in Fig. 8 and Supporting Fig. S3. The median values (dashed lines) ranged from 0.53 to 0.66 at 3T and from 0.22 to 0.27 ms at 7T. The median ultrashort- component frequency offset, corrected for B0 inhomogeneity, (dashed lines) ranged from −313 to −343 Hz at 3T and from −831 to −949 Hz at 7T. They also show that the ultrashort- component frequency shift was typically centered around −300 Hz at 3T and −900 Hz at 7T across all studies.
Figure 8.
Whole-brain histograms of the and frequency offset, corrected for B0 inhomogeneity, of the ultrashort- component at 3T and 7T using a two-compartment signal model. The two volunteers shown approximately represent the range of values observed, and histograms for all 5 volunteers are shown in Supporting Fig. S3. The dashed lines indicate the median values across the entire brain but excluding regions of poor fitting based on the AIC with the same criteria as in Figs. 6 and 7.
The fit component values from several ROIs across 5 volunteers is shown in Table 1. Most notably, there were statistically significant (p < 0.05) differences in the ultrashort- component fraction between mixed WM and mixed GM at 3T and 7T, and also between the posterior CC and mixed GM at 3T and 7T. The ultrashort values ( ) did not show any clear trends between ROIs - they were slightly longer in mixed GM at 3T, while they were significantly shorter in the mixed GM compared to both WM regions at 7T. There were no statistically significant differences in the ultrashort- component frequency offset across ROIs. However, the variability across subjects was higher in the mixed GM voxels, which also had increased fitting residual as illustrated in Fig. 4. The long values ( ) show several expected trends, including a longer in mixed GM compared to mixed WM and shorter values at 7T compared to 3T, as also shown in Supporting Fig. S2. The mixed GM ROIs also contain CSF, which would lead to increased .
Table 1.
Fitting model parameters showing mean and standard deviation across 5 subjects, using a 2-component fit of Eq. 3. ROI locations are shown in Fig. 2.
| ROI | B0 [T] | uT2fraction | Equation | Δf1 − Δf2 [Hz] |
|
|
|---|---|---|---|---|---|---|
|
| ||||||
| pCC | 3 | 0.100 ± 0.00952 | 0.382 ± 0.0205 | −235 ± 17.3 | 33.2 ± 1.31 | |
| mixed WM | 3 | 0.105 ± 0.00599 | 0.366 ± 0.0227 | −239 ± 12 | 38.5 ± 0.812 | |
| mixed GM | 3 | 0.077 ± 0.00669 | 0.594 ± 0.201 | −269 ± 42.6 | 42.5 ± 2.49 | |
|
| ||||||
| pCC | 7 | 0.101 ± 0.0109 | 0.361 ± 0.0721 | −936 ± 94.1 | 17.1 ± 2.6 | |
| mixed WM | 7 | 0.0936 ± 0.0116 | 0.296 ± 0.0622 | −1040 ± 77.9 | 23.8 ± 2.15 | |
| mixed GM | 7 | 0.0782 ± 0.00781 | 0.159 ± 0.0253 | −881 ± 257 | 32.5 ± 1.24 | |
Discussion
The in vivo results show an ultrashort-T2 component in the brain with a large chemical shift, similar to that of lipids. The results also show a correspondence between this component and white matter anatomy, as has also been demonstrated in prior work (6–9). Ex vivo studies have shown a chemically shifted ultrashort-T2 component associated with myelin, and speculated this was arising primarily from methylene protons in the myelin phospholipid membranes (5, 6). Taken together, the results suggest that bound protons in the myelin phospholipid membranes are a major component of this ultrashort-T2 component observed in vivo.
The measured chemical shift in the ultrashort-T2 component is supported by numerous results presented. First, there are clear complex-valued signal oscillations present in the brain. These were not present in phantoms, so they did not arise from the RF coil or the pulse sequence paramters. The decay rate of these oscillations was faster than for other lipid signals such as bone marrow or subcutaneous fat. The frequency shift also scaled linearly with B0 between 3T and 7T, as expected for a chemical shift effect. Finally, the maps of the ultrashort T2* component fraction showed correspondence with white matter anatomy most clearly when using the fat-frequency reconstruction. If there was no chemical shift of this component, these maps would appear blurred out with the fat-frequency reconstruction. These maps also show some ringing artifacts from long-T2 lipid signals around the brain, with some ringing present near the edge of the brain but dominance of the correspondence with white matter away from these edges. While fat suppression methods could reduce this ringing, we chose not to use them as they would also suppress the ultrashort-T2* component of interest (18).
To our knowledge, this is the first in vivo measurement of a chemical shift in the ultrashort-T2 component in the brain. Capturing this frequency shift is challenging because of the very short relaxation time. Our measurements were enabled by using a large number of submillisecond TEs, phase sensitive image reconstructions, and elimination of oscillation artifacts through a randomized TE ordering. Previous in vivo brain studies measured an ultrashort-T2 component with at 3T (7, 8). The longer values (median = 0.5–0.7 ms at 3T, Fig. 8) measured in this study likely result because our fitting model accounted for the frequency shift, which would decrease when not included in the model. Our measurements demonstrate two parameter dimensions, both and chemical shift, that can be used to separate ultrashort-T2 components in the brain. This may be useful for separation of confounding factors, such as shortened due to calcifications, fibrosis, or gliosis (19). These new characterizations of the chemical shift and relaxation times at 3T and 7T of the ultrashort-T2 component in the brain will be crucial for experimental design and analysis when imaging this component in future studies.
The frequency shift relative to water of the ultrashort-T2 component was typically between −2.5 to −3.4 ppm, which corresponds to an absolute chemical shift of 1.3 to 2.2 ppm. This shift is similar to previous ex vivo measurements of spinal cord tissue and myelin extract that measured a 3.5 ppm upfield shift from water (6). These chemical shifts are near that of methylene protons of alkyl chains, the main constituent of myelin. Another ex vivo study of frog sciatic nerves and myelin extract suggested the ultrashort-T2 component signal arises primarily from methylene protons in myelin phospholipid membranes and proteins based on the expected myelin 1H fractions (5). The ultrashort-T2 component measured in our study is likely a mixture of bound protons in the myelin membranes, proteins, and macromolecules, with the clear chemical shift suggesting a substantial contribution from methylene protons.
The on-resonance, slowly relaxing signal component in our model, which had values ranging from approximately 30–45 ms at 3T and 15–35 ms at 7T in brain tissue (Supporting Fig. S2, Table 1), likely represents a weighted average of myelin water, intracellular water and extracellular water. These have been independently characterized in previous studies using longer TE times, and reported similar values to our measurements (16, 17). The accuracy of our measurements is limited by our maximum TE of 5 ms.
The randomized TE ordering was crucial in our ultrashort echo time relaxometry method (Fig. 3), as it eliminated unexpected signal fluctuations observed with sequential TE ordering. We speculate that these signal fluctuations are due to eddy currents with millisecond time constants that result in fluctuating image distortions between different TRs because the relative gradient positions are shifting each TR. The randomized ordering also randomizes any image distortions for each TE, thus there is no unique distortion pattern in a given TE image.
The model fitting performance varied notably with field strength as well as across the brain. In general, fits at 7T were poorer, demonstrated by the higher AIC values, the poor quality of the parameter maps in Fig. 7, and the larger standard deviations across subjects in Table 1. This is attributable to the shorter and the increased frequency shifts at 7T. The shorter would cause ultrashort component blurring and less TEs are contributing to the fitting of this component. The increased frequency shifts, both due to B0 and chemical shift, add more uncertainty that will make the fitting results less stable. We also observed that the fit quality was much worse in regions with large magnetic field variations, particularly near the sinuses in the frontal cortex and the cerebellum that typically have susceptibility-induced field variations. These regions had larger variability in the measured field maps shown in Supporting Fig. S2. Intravoxel dephasing in these regions could lead to additional signal fluctuations and shorter relaxation times that are not accounted for in our model. Fit quality improved away from these regions, where the maps at 3T in the rest of the cortex were consistently of the highest quality across subjects.
The rapid relaxation rate and chemical shift make the detection of the brain ultrashort-T2 component challenging. The rapid relaxation can lead to blurring, even with UTE pulse sequences, where ideally the readout duration should be longer than (20). Our readout duration was 512 μs, which is similar to the ultrashort component at 3T but longer than the at 7T. Therefore, we expect some blurring of the ultrashort component due to decay at 7T. The off-resonance due to chemical shift results in an isotropic blurring and ringing artifact for radial trajectories used in UTE (21). We addressed this by using the fat-frequency reconstruction when fitting the ultrashort component as demonstrated in Fig. 5.
One limitation of this study is that our data was T1-weighted due to the short TR required for 3D imaging. Therefore, it was not possible to quantify the absolute concentrations of measured components. Prior in vivo studies using 2D UTE with long TRs have measured a relative proton density of 4.05±0.88% for the ultrashort-T2 component in white matter (8). Our T1-weighted measurements of the ultrashort-T2 fractions, uT2fraction, were typically between 7–15%. Since previous studies measured relatively short T1 values for the ultrashort-T2 component (T1 = 226 ± 46 ms at 3T (7)), a T1-weighted acquisition should increase the measured signal fraction.
Since the goal of this study was to characterize the ultrashort-T2 component, we allowed our relaxometry acquisition to be up to 1 hour for 3D coverage with a large number of echo times. For future studies, there are several potential options to reduce the scan time including: given the characterization results presented, relaxometry of a two-component system with 6 unknowns could be solved with less than 32 TEs; a more efficient k-space acquisition strategy, such as 3D cones (22, 23) or variable density radial sampling (24); and reduced FOV through slab or slice excitations. Shortening the scan time should still provide sufficient SNR of the ultrashort-T2 component, as evidenced by other in vivo UTE imaging studies of this component (7–9).
Conclusion
This work presents whole-brain characterization of an ultrashort-T2 component ( at 3T, 0.2–0.3 ms at 7T) that had an approximately −3 ppm frequency difference from water at 3T and 7T. The measured chemical shift in the ultrashort-T2 component is supported by complex-valued signal oscillations, the linear scaling with B0, and correspondence between the ultrashort T2* component fraction and white matter anatomy but only when using a fat-frequency reconstruction. This indicates this fast-relaxing component includes a large contribution from methylene protons in the myelin phospholipid membranes, which is in agreement with previous ex vivo studies. To our knowledge, this is the first time a chemical shift of this fast-relaxing component has been measured and characterized in vivo. These measurements were enabled by a randomized TE ordering, on-resonance and off-resonance image reconstructions, and parallel imaging. These characterizations will be crucial to design future measurements for direct myelin imaging.
Supplementary Material
Acknowledgments
We would like to thank Kevin Johnson, Alex MacKay and Jiang Du for insightful discussions. This work was supported by the National Institutes of Health [grants numbers R21-NS089004, S10-RR026845, UL1 RR024131 (the NIH-NCRR UCSF-CTSI)]; the National Multiple Sclerosis Society [Pilot Grant Number PP3360]; GE Healthcare; and UCSF Department of Radiology and Biomedical Imaging Seed Grants.
References
- 1.Courchesne E, Chisum HJ, Townsend J, Cowles A, Covington J, Egaas B, Harwood M, Hinds S, Press GA. Normal brain development and aging: Quantitative analysis at in vivo mr imaging in healthy volunteers1. Radiology. 2000;216:672–682. doi: 10.1148/radiology.216.3.r00au37672. [DOI] [PubMed] [Google Scholar]
- 2.Englund E. Neuropathology of white matter changes in alzheimer’s disease and vascular dementia. Dementia and Geriatric Cognitive Disorders. 1998;9:6–12. doi: 10.1159/000051183. [DOI] [PubMed] [Google Scholar]
- 3.Bartzokis G. Age-related myelin breakdown: a developmental model of cognitive decline and alzheimer’s disease. Neurobiology of Aging. 2004;25:5–18. doi: 10.1016/j.neurobiolaging.2003.03.001. [DOI] [PubMed] [Google Scholar]
- 4.Laule C, Vavasour I, Kolind S, Li D, Traboulsee T, Moore G, MacKay A. Magnetic resonance imaging of myelin. Neurotherapeutics. 2007;4:460–484. doi: 10.1016/j.nurt.2007.05.004. [DOI] [PMC free article] [PubMed] [Google Scholar]
- 5.Horch RA, Gore JC, Does MD. Origins of the ultrashort-t(2) (1) h nmr signals in myelinated nerve: A direct measure of myelin content? Magn Reson Med. 2011;66:24–31. doi: 10.1002/mrm.22980. [DOI] [PMC free article] [PubMed] [Google Scholar]
- 6.Wilhelm MJ, Ong HH, Wehrli SL, Li C, Tsai PH, Hackney DB, Wehrli FW. Direct magnetic resonance detection of myelin and prospects for quantitative imaging of myelin density. Proc Natl Acad Sci U S A. 2012;109:9605–10. doi: 10.1073/pnas.1115107109. [DOI] [PMC free article] [PubMed] [Google Scholar]
- 7.Du J, Sheth V, He Q, Carl M, Chen J, CoreyBloom J, Bydder GM. Measurement of t1 of the ultrashort t2* components in white matter of the brain at 3t. PLoS One. 2014;9:e103296. doi: 10.1371/journal.pone.0103296. [DOI] [PMC free article] [PubMed] [Google Scholar]
- 8.Du J, Ma G, Li S, Carl M, Szeverenyi NM, VandenBerg S, CoreyBloom J, Bydder GM. Ultrashort echo time (ute) magnetic resonance imaging of the short t2 components in white matter of the brain using a clinical 3t scanner. Neuroimage. 2014;87:32–41. doi: 10.1016/j.neuroimage.2013.10.053. [DOI] [PMC free article] [PubMed] [Google Scholar]
- 9.Sheth V, Shao H, Chen J, Vandenberg S, CoreyBloom J, Bydder GM, Du J. Magnetic resonance imaging of myelin using ultrashort echo time (ute) pulse sequences: Phantom, specimen, volunteer and multiple sclerosis patient studies. Neuroimage. 2016;136:37–44. doi: 10.1016/j.neuroimage.2016.05.012. [DOI] [PMC free article] [PubMed] [Google Scholar]
- 10.Bergin CJ, Pauly JM, Macovski A. Lung parenchyma: projection reconstruction MR imaging. Radiology. 1991;179:777–781. doi: 10.1148/radiology.179.3.2027991. [DOI] [PubMed] [Google Scholar]
- 11.Gatehouse PD, Bydder GM. Magnetic resonance imaging of short t2 components in tissue. Clin Radiol. 2003;58:1–19. doi: 10.1053/crad.2003.1157. [DOI] [PubMed] [Google Scholar]
- 12.Nayak KS, Pauly JM, Gold GE, Nishimura DG. Imaging ultra-short T2 species in the brain. Proceedings of the 8th Annual Meeting of ISMRM; Denver. 2000; p. 509. [Google Scholar]
- 13.Larson PEZ, Pauly JM, Nishimura DG. Ute imaging in the brain with robust long-t2 suppression pulses. International Workshop on Myelin Imaging; Vancouver, BC, Canada. 2006; p. P–28. [Google Scholar]
- 14.Larson PEZ, Gurney PT, Nishimura DG. Anisotropic field-of-views in radial imaging. IEEE Trans Med Imaging. 2008;27:47–57. doi: 10.1109/TMI.2007.902799. [DOI] [PubMed] [Google Scholar]
- 15.Uecker M, Lai P, Murphy MJ, Virtue P, Elad M, Pauly JM, Vasanawala SS, Lustig M. Espirit–an eigenvalue approach to autocalibrating parallel mri: where sense meets grappa. Magn Reson Med. 2014;71:990–1001. doi: 10.1002/mrm.24751. [DOI] [PMC free article] [PubMed] [Google Scholar]
- 16.van Gelderen P, de Zwart JA, Lee J, Sati P, Reich DS, Duyn JH. Nonexponential T2* decay in white matter. Magn Reson Med. 2012;67:110–7. doi: 10.1002/mrm.22990. [DOI] [PMC free article] [PubMed] [Google Scholar]
- 17.Sati P, van Gelderen P, Silva AC, Reich DS, Merkle H, de Zwart JA, Duyn JH. Microcompartment specific t2* relaxation in the brain. Neuroimage. 2013;77:268–78. doi: 10.1016/j.neuroimage.2013.03.005. [DOI] [PMC free article] [PubMed] [Google Scholar]
- 18.Larson PEZ, Gurney PT, Nayak K, Gold GE, Pauly JM, Nishimura DG. Designing long-t2 suppression pulses for ultrashort echo time imaging. Magn Reson Med. 2006;56:94–103. doi: 10.1002/mrm.20926. [DOI] [PMC free article] [PubMed] [Google Scholar]
- 19.Waldman A, Rees JH, Brock CS, Robson MD, Gatehouse PD, Bydder GM. Mri of the brain with ultra-short echo-time pulse sequences. Neuroradiology. 2003;45:887–92. doi: 10.1007/s00234-003-1076-z. [DOI] [PubMed] [Google Scholar]
- 20.Rahmer J, Bornert P, Groen J, Bos C. Three-dimensional radial ultrashort echo-time imaging with t2 adapted sampling. Magn Reson Med. 2006;55:1075–82. doi: 10.1002/mrm.20868. [DOI] [PubMed] [Google Scholar]
- 21.Larson PEZ, Han M, Krug R, Jakary A, Nelson SJ, Vigneron DB, Henry RG, McKinnon G, Kelley DAC. Ultrashort echo time and zero echo time mri at 7t. MAGMA. 2015 doi: 10.1007/s10334-015-0509-0. [DOI] [PMC free article] [PubMed] [Google Scholar]
- 22.Carl M, Bydder GM, Du J. Ute imaging with simultaneous water and fat signal suppression using a time-efficient multispoke inversion recovery pulse sequence. Magn Reson Med. 2016;76:577–82. doi: 10.1002/mrm.25823. [DOI] [PMC free article] [PubMed] [Google Scholar]
- 23.Gurney PT, Hargreaves BA, Nishimura DG. Design and analysis of a practical 3D cones trajectory. Magn Reson Med. 2006;55:575–582. doi: 10.1002/mrm.20796. [DOI] [PubMed] [Google Scholar]
- 24.Johnson KM, Fain SB, Schiebler ML, Nagle S. Optimized 3d ultrashort echo time pulmonary mri. Magn Reson Med. 2013;70:1241–50. doi: 10.1002/mrm.24570. [DOI] [PMC free article] [PubMed] [Google Scholar]
Associated Data
This section collects any data citations, data availability statements, or supplementary materials included in this article.


