

Summary
Temperature influences the structural and functional properties of cellular components, necessitating stress responses to restore homeostasis following temperature shift. Whereas the circuitry controlling the heat shock response is well understood, that controlling the E. coli cold-shock adaptation program is not. We found that during the growth arrest phase (acclimation) that follows shift to low temperature, protein synthesis increases and ORF-wide mRNA secondary structure decreases. To identify the regulatory system controlling this process, we screened for players required for increased translation. We identified a 2-member mRNA surveillance system that enables recovery of translation during acclimation: RNase R assures appropriate mRNA degradation and the Csps dynamically adjust mRNA secondary structure to globally modulate protein expression level. An autoregulatory switch in which Csps tune their own expression to cellular demand enables dynamic control of global translation. The universality of Csps in bacteria suggests broad utilization of this control mechanism.
eTOC Blurb
Zhang et al. identified an mRNA structure surveillance system mediated by Csps and RNase R that facilitates translation recovery after cold shock in E. coli. Their work proves insights into a post-transcriptionally regulated bacterial stress response and suggests broad utilization of this control mechanism across all bacteria.
Introduction
Temperature has a profound impact on growth by influencing both the structural and functional properties of cellular components. Upon temperature fluctuation, bacteria initiate stress responses to ensure cell survival and adaptation. Most bacterial stress responses, including the heat shock response, are controlled by transcriptional regulators, which initiate a signal-transduction cascade to restore cellular homeostasis. In contrast, no cold shock specific transcriptional regulator has been identified and post-transcriptional control is believed to dominate the cold shock response (Brandi et al., 1996; Giuliodori, 2016; Giuliodori et al., 2010; Gualerzi et al., 2011, 2003). As few responses of this type are understood in molecular detail, there is high probability for developing new paradigms by studying the cold shock response.
When exponentially growing E. coli are shifted from 37°C to 10°C, protein translation decreases massively, cells stop growing for a ~6 hr acclimation phase, and then resume growth at a much slower rate (Goldstein et al., 1990; Jones et al., 1987). A pioneering 2D gel analysis revealed that a small group of proteins showed increased expression during acclimation despite low bulk protein synthesis (Jones et al., 1987). Many studies have now identified about 30 proteins whose expression increases upon cold shock (reviewed in (Lim and Gross, 2011)). These include RNA modifying proteins (e.g. the cold shock protein (Csp) family (Gualerzi et al., 2003); 3' to 5' exoribonuclease RNase R (Cairrão et al., 2003); RNA helicase DeaD (Jones et al., 1996); PNPase (Yamanaka and Inouye, 2001)), translation regulators (e.g. IFs, RbfA (Gualerzi et al., 2003)), chromosome modulators (e.g. DNA gyrase, H-NS (Gualerzi et al., 2003)) and transcription factors (e.g. NusA (Bae et al., 2000)). Of these, the Csps have been studied most intensively because the most abundant family member, CspA, is massively upregulated after cold shock (Goldstein et al., 1990). Initially thought to be cold shock specific, CspA is also abundant at 37°C (Brandi et al., 1999), where it is present at about 40,000 copies/cell (Li et al., 2014).
Four of the 9 homologous Csps (CspA-I) are induced by cold shock (CspA, B, G, I). Csps bind to both DNA and RNA in vitro with fairly relaxed sequence specificity (Jiang et al., 1997a; Phadtare and Inouye, 1999; Sachs et al., 2012) and promote formation of ssRNA and ssDNA, either by unwinding or by capturing transiently unwound bases (Jiang et al., 1997a; Phadtare and Severinov, 2005). Indeed, after cold shock, Csps increase nusA expression via an antitermination mechanism by binding to and disrupting the rho-independent terminator RNA stem-loop located upstream of nusA in the metY-rpsO operon (Bae et al., 2000; Phadtare et al., 2002). Csps are critical for low temperature growth, as the quadruple csp deletion strain (cspA, cspB, cspG, and cspE) is unable to divide (Xia et al., 2001). CspA expression is controlled post-transcriptionally by changing its rate of mRNA degradation (Fang et al., 1997; Goldenberg et al., 1996), and possibly its translation efficiency (Brandi et al., 1996; Giuliodori et al., 2010). The 160-nt-long 5’UTR of cspA mediates this regulation, as it is a thermosensor that folds into different structures at 37°C and 10°C (Giuliodori et al., 2010).
In spite of our wealth of knowledge about particular proteins induced upon shift to cold, we have limited understanding of the cellular adaptation program that allows resumption of growth following acclimation. To obtain a quantitative view of cold shock response, we used global methods to monitor the genome-wide changes in translation and in mRNA structure level during acclimation. These measurements allowed us to probe the interplay between mRNA structure and translational control during acclimation, and to then perform follow-up experiments to identify the key players and determine their mode of action. Our studies point to an mRNA surveillance system in which RNase R is required for mRNA degradation and the Csps dynamically adjust mRNA secondary structure to globally modulate protein expression level.
Results
Global translation is massively inhibited after cold shock and then partially recovers
Cell growth arrests for a 6 hr acclimation phase after shift from 37°C to 10°C (Jones et al., 1987), concomitant with a dramatic decrease in protein synthesis (Goldstein et al., 1990; Jones et al., 1987). However, a quantitative, temporally resolved analysis of protein synthesis capacity during acclimation had never been reported. We monitored cell growth (OD420; Figure 1A, top) and rate of total protein synthesis (35S-methionine incorporation; Figure 1A, bottom and Figure 1B) at multiple times after cold shock. We found an immediate ~50-fold decrease in protein synthesis rate (3 min after cold shock; Figure 1B), reflecting the low rate of translation elongation at 10°C (Farewell and Neidhardt, 1998), and a further ~4-fold decrease over the next 30 min (Figure 1B). There is a gradual ~3.5-fold increase in protein synthesis rate from 30 min to 6 hr after cold shock, approaching that in exponentially growing cold-adapted cells at 10°C (Figure 1A, bottom). We first investigated the origin of this ~4-fold decline of protein synthesis during the first 30 min after cold shock.
Figure 1. Global change in translation and mRNA structure during the acclimation phase following cold shock.

(A) Top: Cell growth after shift to 10°C. Cells gro wing exponentially at 37°C were shifted to 10°C (using dilution to achieve instantaneous tempe rature equilibration indicated by the arrow at t = 0; see Methods), and grown until exponential phase was restored (~25 hours after cold shock). Bottom: Protein synthesis after shift to 10°C. Cultures were simultaneously sampled for OD420 and protein synthesis (35S-methionine pulse labeling) at different timepoints (see Methods). Protein synthesis rate is calculated as: 35S-methionine incorporated / minute / OD420 / 100µL culture. The acclimation phase is shaded gray and marked by a red arrow.
(B) Detailed time course of protein synthesis immediately after shift to 10°C, measured as in (A).
(C) Meta-gene analysis of ribosome run-off after cold shock. At 5 min and 15 min after cold shock, the median of ribosome density at each position relative to the ORF start codon was calculated across well-expressed genes (N = 492) and normalized to the median ribosome density within the window between 1000 nt and 1180 nt downstream of start codon. Analysis is limited to ORFs ≥ 1200 nt long, and curves are smoothed by calculating the median within rolling windows of 25 nt (see Methods).
(D) Histogram of Gini indices of E. coli ORFs calculated from in vivo DMS-seq data at 37°C (red) or 30 min after cold shock (blue). Gini indices were calculated for 391 well-expressed genes with relatively constant mRNA across the ORF and a mean DMS-seq signal of ≥ 5 reads/nt in all samples (see Figure S1C-D for determination of read cut-off). P-value < 2.2-16, based on Kolmogorov-Smirnov (K-S) test.
(E) Scatter plot comparing Gini indices of individual ORFs at 37°C and 30 min after cold shock to 10°C.
(F) Histogram of Gini indices of the 391 ORFs described in (D) at 30 min (blue) or 6 hr (yellow) after cold shock in WT cells. P-value < 2.2-16, based on K-S test.
(G) Plot of the change in Gini indices vs translation efficiency (TE) between 30 min and 6 hr after cold shock. The distribution of changes in RNA structure level is shown in a histogram above the figure and that for TE changes is shown to right. Most genes fall in the upper left quadrant, indicating a decrease in RNA structure level concomitant with an increase in TE. The change of TE during acclimation phase is highly correlated with the change of mRNA structure (Spearman's rank correlation coefficient ρ = −0.65).
We used ribosome profiling (Figure S1A) to map ribosome footprint density on mRNAs at 5 and 15 min after cold shock. We found that ribosome density is sequentially depleted from the 5' end of ORFs (Figure 1C), indicating that translation initiation is impaired. Gradual run-off of ribosomes that had initiated translation at 37°C is reflected in a gradual decrease in 35S-methionine incorporation that plateaus at about 30 min after cold shock (Figure 1B), when the run-off observed by ribosome profiling is presumably complete. Our conclusion that translation initiation is impaired is consistent with earlier studies showing a decrease in polysomes and an increase in monosomes at 10°C (Friedman et al., 1969; Jones and Inouye, 1996), and with the finding that at 5°C, an RNA phage-encoded transcript completed one round of translation but did not reinitiate (Friedman et al., 1971). A suite of in vitro translation experiments from the Gualerzi group also provided evidence of the impairment of translation initiation at low temperature and further suggested that the mRNA structure itself may facilitate translation of some mRNAs (reviewed in (Giuliodori, 2016; Gualerzi et al., 2011)). In summary, the 200-fold reduction in the rate of protein synthesis by ~30 min after cold shock (Figure 1B) reflects both an ~50-fold decrease in the rate of translation elongation and an ~4-fold decrease in translation initiation. The subsequent recovery of translation initiation, resulting in increased protein synthesis, is the key event in cold shock recovery and our further studies investigated the origin of this effect.
Genome-wide translation recovery during acclimation is accompanied by decreasing mRNA secondary structure level
We used DMS (dimethyl sulfate)-seq to monitor genome-wide mRNA secondary structure after cold shock (Figure S1B). DMS-seq uses next generation sequencing to determine chemical accessibility of RNA to DMS, a reagent that reacts with unpaired adenosine and cytosine nucleotides (Inoue and Cech, 1985). We quantified the extent of mRNA structure on each ORF using the Gini index metric, which measures the variability in reactivity of residues within the ORF (Rouskin et al., 2014). A low Gini index results from a relatively even distribution of DMS-seq reads indicating unstructured mRNA, whereas a high Gini index results from strong protection of a subset of residues, indicating structured mRNA (Figure S1B). We found a substantial increase in the level of ORF-wide mRNA structure at 30 min after cold shock relative to 37°C, with almost every ORF mRNA becoming more structured (Figure 1D-E; Table S1), and a global decrease in ORF-wide mRNA structure level relative to that at 30 min by the end of acclimation (6 hr after shift to 10°C; Figure 1F-G; Table S1).
We recently reported that the extent of ORF-wide mRNA secondary structure is the primary predictor of the translation efficiency (TE: protein synthesis rate per mRNA) of endogenous ORFs during steady state growth at 37°C, with more structured ORF mRNAs having lower TE (Burkhardt et al., 2017). We tested whether this is also true at 10°C by comparing TE (obtained from ribosome profiling and RNA-seq) and ORF-wide mRNA structure (from DMS-seq) for the same set of ORFs at 30 min and 6 hr after cold shock (Figure S1E-F). We found that the extent of change in translation efficiency and that of the ORF-wide mRNA structure are highly correlated (ρ = −0.65, Figure 1G). Notably, the mRNA structure level and TE remain correlated even when mRNA structure was probed in the absence of translating ribosomes (Figure S1G) or in vitro (Figure S1H), supporting the correlation between intrinsic mRNA structure and TE during acclimation at 10°C, just as we have shown at 37°C in (Burkhardt et al., 2017). Together, these results suggest the possibility that the decrease in the mRNA structure level of ORF mRNAs allows their translation recovery.
Factors important for translation recovery during acclimation
To identify proteins that might contribute to increased translation during acclimation, we determined the de novo synthesis rate of every protein using ribosome profiling at 37°C, and 10 min, 30 min, 2 hr, 3 hr, 4 hr and 6 hr after shift to 10°C. We calculated protein production of each ORF within each time window by multiplying protein synthesis rate (from ribosome profiling) by the time period of that interval, and obtained cumulative protein production by summation (Table S2). Protein abundance before cold shock was estimated by protein production during one doubling time of cells at 37°C and scaled to previously reported results (Li et al., 2014). As almost all bacterial proteins are long-lived (Larrabee et al., 1980), protein abundance at the end of the acclimation phase was estimated by summing protein abundance before cold shock and de novo protein production (see Methods).
We identified 45 proteins whose abundance was upregulated ≥ 5-fold (Figure 2A, Table S2), and 116 proteins whose abundance was upregulated ≥ 2-fold (Table S2) at the end of acclimation, and several upregulated sRNAs (from mRNA-seq; Figure S2G-H; Table S4). Notably, time-resolved analysis reveals a clear temporal order of induction of various cold shock proteins (Table S3), indicating that the cold shock response is hierarchical (see discussion).
Figure 2. Key factors involved in the translation recovery circuit during acclimation phase.

(A) Scatter plot comparing ORF protein abundance at 37°C and at the end of acclimation (6 hr after cold shock). Grey dashed line: Y = X; red dashed line: 5-fold increase in protein abundance after acclimation relative to 37°C. Red p oints above the line are well expressed ORFs whose protein abundance increased ≥ 5-fold (N = 45), with the labeled ORFs increasing ≥ 10-fold (N = 20). See also Table S2.
(B) Deleting RNase R and the Csps inhibits translation recovery during acclimation. Bar graph indicates the ratio of cellular translation (measured by 35S-methionine pulse labeling) at 6 hr vs 30 min after cold shock for WT and mutant strains. Error bars: standard deviation across >2 replicates.
(C) Fraction of total protein translation (upper panel) and total mRNA amount (lower panel) for the 45 most highly induced genes at different time points after cold shock. See also Table S3.
See also Figure S2.
To identify the potential actuators of the translation recovery circuit, we constructed single gene deletions of each gene whose protein level was upregulated ≥ 5-fold, and compared the translation recovery of mutant and wild type (WT) cells after cold shock. Interestingly, only 2 deletion mutants showed a significant defect in translation recovery during acclimation: rnr (encoding RNase R, a processive 3' to 5' exoribonuclease with intrinsic helicase activity (Awano et al., 2010)) and cspA (encoding CspA, the major Csp family protein) (Figure 2B, S2A). The exonuclease defective rnr D272N mutant (Awano et al., 2010) is as defective as the rnr null mutant (Figure 2B), indicating that the RNase R exonuclease activity is required for translation recovery. Although the single cspA or rnr mutants exhibits about a 30 – 40% drop in translation recovery, the double deletion, ΔcspA Δrnr, has no increase in protein synthesis at all during the 6-hour acclimation period (Figure 2B), suggesting that RNase R and Csps synergize during translation recovery. Together, the Csp family proteins and RNase R constitute up to 40% of total protein synthesis and 6% of total mRNA at 3 hours after cold shock (Figure 2C), supporting their dominant role in initial recovery.
RNase R mediates initial translation recovery by facilitating mRNA degradation
RNase R participates in ribosomal quality control by degrading damaged rRNA (Chen and Deutscher, 2005; Cheng and Deutscher, 2003), and is required for maximal growth, maturation of tmRNA and tmRNA-mediated degradation of nonstop mRNAs at low temperature (Cairrão et al., 2003; Richards et al., 2006). We determined RNase R targets during acclimation by comparing the fraction of RNA-seq reads mapping to different RNA types in WT and Δrnr cells, normalized to total RNA level measured by continuously labeling a parallel culture with 3H-uridine during 37°C growth and after cold shock ( see Methods). Surprisingly, neither the level of stable RNA (Figure 3A) nor tmRNA (Figure 3B) is strongly affected by the lack of RNase R, although the pre-processed tmRNA level appears higher in the absence of RNase R (Figure S3), in agreement with previous work (Cairrão et al., 2003). Instead, the absence of RNase R affects mRNA level, where the fractional mRNA content increases from ~4% in WT cells to ~10% in Δrnr cells at 8 hr after cold shock (Figure 3C), suggesting a defect in mRNA degradation.
Figure 3. RNase R facilitates mRNA degradation during acclimation phase.

(A-C) RNA content of WT and Δrnr cells at 20 min, 4 hr and 8 hr after cold shock for: (A) stable RNA; (B) tmRNA; and (C) mRNA. RNA content was calculated from the fraction of RNA-seq reads mapping to different types of RNA, normalized to total RNA level measured by continuous labeling of 3H-uridine during 37°C growth and after cold shock (see Methods).
(D) mRNA content of WT and Δrnr cells before and after rifampicin (rif) treatment at 10°C. Upper: schematic of experiment. Lower: mRNA / total RNA before and after the 2 hr treatment with rifampicin, calculated from the fraction of RNA-seq reads mapping to mRNA.
(E-F) mRNA amount of individual genes (N = 937) in WT (E) or Δrnr cells (F) before and after rif treatment diagrammed in (D). mRNA level was quantified by number of RNA-seq Reads Per Kilobase of transcript per Million mapped reads (RPKM).
We directly tested whether RNase R affects mRNA half-life during acclimation using RNA-seq. Two hours after shift to 10°C, we st opped new RNA synthesis by the addition of the transcription initiation inhibitor rifampicin, allowed cellular RNA to decay for an additional 2 hours, and then compared the fractional representation of mRNA before and after rifampicin treatment. Whereas mRNA is degraded with a T1/2 of ~2hr in WT cells, it is essentially stable in Δrnr cells (Figure 3D), across almost all genes examined (Figure 3E-F). RNase R may act alone to promote global mRNA degradation following cold shock, or as an essential accessory protein for the canonical degradosome pathway consisting of RNase E and associated proteins. Indeed, RNase R is degradosome-associated in the psychrotropic bacterium Pseudomonas syringae (Purusharth et al., 2005).
Csps are required for restoring mRNA structure during acclimation
We next examined the role of Csps during translation recovery. When deleted singly, only cspA, the major Csp induced upon cold shock, showed a significant defect in translation recovery (Figure 2B). Additional deletions of the minor cold-induced Csps had increasingly severe effects, with the quadruple deletion strain exhibiting essentially no recovery of protein synthesis, and a quintuple mutant, including Δrnr, showing further reduction in translation (Figure 2B).
The Csps are RNA chaperones, already suggested to use their mRNA unfolding capability to promote transcription terminator readthrough (Bae et al., 2000; Phadtare et al., 2002). However, there are actually a sufficient number of Csps to almost completely coat the cellular mRNA during acclimation (~ 106 CspA proteins/cell for ~107 nt of mRNA/cell). We therefore tested whether Csps are required for ORF-wide mRNA structure modulation. Indeed, contrary to WT cells, ΔcspABEG cells retained highly structured mRNA even at 8 hr after cold shock (Figure 4A), and the most structured mRNAs had the greatest defects in recovery of TE relative to WT cells (Figure 4B). These findings raise the possibility that Csps modulate mRNA structure and the consequent increase in translation efficiency that accompanies cold recovery.
Figure 4. Csps are required for decreased mRNA structure during acclimation.

(A) Histogram of Gini indices of ORFs in WT (orange) or ΔcspABEG cells (green) at 8 hr after cold shock (N = 592). Gini indices were calculated from the in vivo DMS-seq data. P-value < 2.2-16, based on K-S test.
(B) Plot of the difference in Gini indices vs the difference in translation efficiency (TE) between WT and ΔcspABEG cells at 8 hr after cold shock. Histograms of the differences in RNA structure level (above) and of TE differences (right) are shown. Most genes fall in the lower right quadrant, indicating that ΔcspABEG cells have higher mRNA structure level and lower TE than WT cells. The difference of TE between WT and ΔcspABEG cells is highly correlated with the difference of their mRNA structure level (Spearman's rank correlation coefficient ρ = −0.58).
(C) Growth curves (OD420) of WT, ΔcspA, ΔcspABEG and ΔcspABCEG cells at 37°C in MOPS rich defined media minus methionine on a log scale. Doubling times: WT 27.6 ± 0.2 min; ΔcspA 27.6 ± 0.3 min; ΔcspABEG 28.4 ± 0.2 min; ΔcspABCEG 29.8 ± 0.2 min, showing mean ± SD based on 3 replicates.
(D) Distribution of the change in TE in ΔcspABCEG cells compared to WT cells at 37°C. Genes were binned into 9 groups based on their TEs in WT cells, with mean TE of each group indicated on the X-axis. The distribution of changes in TE in ΔcspABCEG vs WT cells was then calculated for each group of ORFs, with the box center indicating the median, and the box length indicating the 25th ~ 75th percentile of TE change.
See also Table S6.
Csps also play a role in TE maintenance at normal growth temperatures
The Csps are also abundant at 37°C (Brandi et al., 1999; Taniguchi et al., 2011), comparable in number to ribosomes (Li et al., 2014). We tested whether Csps also play a role at normal growth temperature. A quintuple ΔcspABCEG strain (additionally deleted for cspC, the homologue that is well-expressed at 37°C), ha s an 8% growth defect during exponential phase at 37°C compared to WT cells (Figure 4C), indicating that Csps are required for optimal growth. TE measurements indicated that the best-translated ORFs in WT cells (≥ top 10%), which require unstructured mRNA (Burkhardt et al., 2017), exhibited an ~30% decrease in TE in the ΔcspABCEG strain, whereas the majority of ORFs are only slightly influenced (Figure 4D). Although Csps play a less pronounced role at 37°C than 10°C, Csp expression is still required for optimal growth and for translation of the highest TE genes.
Csp mRNA structure is regulated to control their expression
During acclimation, Csp production increases dramatically and then declines (Figure 2C). Cold induction involves csp message stabilization, with cspA mRNA shifting from a rapidly degraded state at 37°C (T ½ = 10–20 sec) (Fang et al., 1997) to a stable state at 10°C (T ½ > 20 min) (Giuliodori et al., 2010; Hankins et al., 2007; Yamanaka et al., 1999). The long 5’UTR of cspA acts as a thermosensor (Giuliodori et al., 2010). Structure probing in vitro, supported by in vivo data, had revealed that the structure of the 5’UTR of cspA mRNA at 10°C differs from that at 37°C, via a confo rmational change that involves the “cold box” (Giuliodori et al., 2010), a conserved element at the 5’ end of the cspA UTR that is critical for proper regulation of message stability (Fang et al., 1998; Xia et al., 2002). At 37°C, the cold box forms a helix at the 5' end of t he message, whereas at 10°C it pairs with a distant downstream region within the 5’UTR, presumably stabilizing the message. We validated the Giuliodori model that cold box interactions are altered in cspA 5’UTR immediately following cold shock (Figure 5A-C) and further showed a similar transition for the cspB 5’UTR (Figure S4A-C), using our in vivo DMS-seq data to constrain a standard minimal free energy structural prediction (Hofacker, 2003).
Figure 5. The 5’UTR of cspA changes in mRNA structure during acclimation.

(A) The normalized in vivo DMS-seq signal of A/C bases within cspA 5’UTR in WT cells at 37°C (top), 30 min (middle) or 6 hr (bottom) after cold shock. DMS-seq signals were normalized to the maximum signal within cspA message after removing outliers by 98% Winsorisation (see Methods). The red dashed line represents the signal cutoff (0.24), above which the A/C bases are predicted to be unpaired. The region highlighted in red has long-range interactions with the “cold box” element at 10°C.
(B-C) The predicted structure of the cspA 5’ UTR at (B) 37°C or (C) 30 min after cold shock. Structure predictions were generated by constraining a minimum free-energy prediction with in vivo DMS-seq data. The start codon of cspA (green), the conserved “cold box” element (blue) and its long-range interaction region at 10°C (red) are highlighted.
(D) Scatter plot comparing Gini indices of ORFs (N = 391) and 5’UTR of cspA, cspB, cspG (red dots) at 30 min vs 6 hr after cold shock. Grey dashed line: Y = X.
(E) The predicted structure of the cspA 5’ UTR at 6 hr after cold shock, as shown in (B-C). See also Figures S4, S5 and S6.
During cold recovery, csp message is destabilized in a Csp-dependent process (Bae et al., 1997) by an unknown mechanism. We found that the long 5’ UTRs of Csps were among the most dramatically changing mRNA structures during cold recovery (Figure 5D), suggesting that changes in the 5’ UTR structure might be tied to csp message destabilization. Indeed, at the end of acclimation, the 5’UTR of cspA shifts to a structure similar to that at 37°C in which the cold box is in a helix with the 5' end of the message (Figure 5A, E), and that the cspB 5’UTR shows similar changes (Figure S4A, D). These structural transitions do not occur in a ΔcspABEG strain, which lacks the csp ORFs while retaining the csp 5’UTRs (Figure S5A-B, S6A, C). However, when CspA expression drives cold shock recovery in the ΔcspBG strain, the cspB 5’UTR alters its conformation to closely resemble the 37°C structure (Figure S6B, D) . The ability of csp transcript structure to shift as a function of time at 10°C indicates th at the csp 5’UTR structure can exist in two conformations at the same temperature, and that this conformational flexibility depends on the presence of Csp proteins.
CspA autoregulates its own 5’UTR structure at 10°C to resemble the 37°C structure
To directly test whether Csp autoregulates the structure of its own 5’UTR, we used DMS-MaPseq (dimethyl sulfate mutational profiling with sequencing) (Zubradt et al., 2016) to probe the structure of an in vitro synthesized cspA transcript at 37°C, as well as at 10°C , with and without purified CspA protein. In t his method, DMS modifications are encoded as mismatches incorporated by the thermostable group II intron reverse transcriptase. DMS-MaPseq yields a higher signal-to-noise ratio as compared to DMS-seq, is suitable for target-specific investigation of RNA folding (Zubradt et al., 2016) and is highly reproducible (Figure S7A-B).
We found that cspA mRNA folds into its characteristic structures at 37°C and 10°C (Figure 6A-C), as shown previously (Giuliodori et al., 2010) and in this work (Figure 5B-C). However, when CspA protein is present in the folding buffer, the 10°C cspA transcript structure resembles that at 37°C (Figure S7C-F). Th e diagnostic feature is the accessibility of nt 113–118. At 10°C, the cold box is stably paired with nt 113–118, so that the DMS-MAPseq signal of nt 113–118 is low (Figure 6A, middle; 6C), but at 37°C, the cold box is locally paired, and nt 113–118 are accessible (Figure 6A, top; 6B). As the amount of CspA protein is increased, the signal from nt 113–118 increases (red dots in Figure S7C-E), indicating the cspA structure shifted towards its 37°C state. With 0.1mM CspA protein, the estimated cellular concentration of CspA in cold-shocked cells (Jiang et al., 1997b), the cspA 5’UTR structure predicted with constraints from the in vitro DMS-MaPseq data at 10°C closely mirrors its predicted 37°C structure ( Figure 6B, 6D, S7F). Thus, CspA binds its own mRNA to alter its 5’ UTR structure, with the extent of structural change dependent on the amount of CspA protein. Therefore, we propose that Csps remodel their own 5' UTRs, thereby tying their own regulation to their role of structure surveillance in the cell.
Figure 6. Csp protein autoregulates its own 5’ UTR in vitro.

(A) The in vitro DMS-MaPseq signal of the A/C bases within cspA 5’UTR at 37°C (top) and at 10°C without CspA protein (middle) or with 0.1mM CspA protein (bottom). The region highlighted in red has long range interactions with the “cold box” element at 10°C. The DMS-MaPseq signals from biological replicates are first normalized to the maximum signal within the cspA 5’UTR, and then averaged. Error bars indicate standard deviation of 2–4 replicates. The red dashed line indicates the threshold (0.27) above which the A/C bases are predicted to be unpaired (see Methods).
(B-D) The in vitro structures of cspA 5’UTR at (B) 37°C, (C) 10°C and (D) 10°C with 0.1mM CspA protein, generated as in Figure 5. The start codon of cspA (green), the conserved “cold box” element (blue) and its long-range interaction region at 10°C (red) are highlighted.
See also Figure S7.
Discussion
In this work, we dissect the circuitry underlying initial acclimation phase responsible for recovery from cold shock. Our key findings are three-fold. First, we reveal a hard-wired gene expression program driven predominantly by post-transcriptional control that is characteristic of the acclimation phase following cold shock. Second, we identify a key step in cold shock recovery – an ~4-fold increase in protein synthesis during acclimation, and show that the increase in translation efficiency of each ORF mRNA during acclimation is associated with a decrease in ORF-wide mRNA structure. Finally, we identify RNase R and CspA as the major actuators of the acclimation phase: Csps facilitate decreased mRNA structure, while RNase R facilitates mRNA degradation to achieve the appropriate Csp/mRNA ratio. We suggest that the mRNA surveillance circuit we have identified is broadly used to tune mRNA structure to ensure the appropriate rate of translation initiation.
Cells exhibit a kinetically and functionally structured response to cold shock
We identified three temporally distinct phases of increased protein production which together comprised 116 proteins that are upregulated ≥ 2-fold during acclimation (Figure S2B-F; Table S3). The immediate early group peaked in expression directly after cold shock and then quickly decreased by 2 hours into acclimation and is enriched for insertion elements, transposases, and cell membrane related proteins (Cluster 1, Figure S2C, F). The sustained early group maintained high expression during most of acclimation, with decreasing expression at the end of this phase and includes most of the previously identified cold shock proteins (e.g. Csp family proteins, DEAD-box helicases, RNase R), and SOS response factors (e.g. DinI, SulA, LexA) (Cluster 2, Figure S2D, F). Finally, the delayed early group was induced later in acclimation and continued to increase beyond the acclimation phase and is enriched in metabolic pathways, e.g. putrescine catabolic process (the Puu pathway) and carbon metabolism (rpiB, acnA) (Cluster 3, Figure S2E, F). Once translation resumes, a more broadly based long-term program is turned on to reactivate biosynthetic pathways and sustain cell growth and division at low temperature.
Importantly, the cold-shock-induced proteins expressed during acclimation are largely distinct from those reported to be important for continuous low temperature growth. Among the 116 genes that are upregulated ≥ 2-fold, deletions of only deaD (alias csdA; encoding a DEAD-box RNA helicase) and ymcE (encoding a predicted bitopic inner membrane protein) are reported to have defect in continuous growth at 10°C (Shiver et al., 2016). Conversely, some proteins required for long-term growth at 10°C (e.g. RbfA (Jones and Inouye, 1996) and PNPase (Luttinger et al., 1996)) are not strongly induced shortly after cold shock. Thus, the factors and pathways involved in the initial cold shock response may differ from those required for long-term growth.
We also found several strongly upregulated small RNAs (> 5-fold) upon cold shock (Table S4). Among these, the stationary phase sRNA (e.g. rybB), and the regulatory sRNA for toxin-antitoxin systems (e.g. rdlD, sokC) are upregulated immediately after shock (Figure S2G), and the two small RNAs regulating rpoS expression, rprA and dsrA, are upregulated during acclimation (Figure S2H). This agrees with the previous reports that upregulation of dsrA sRNA is essential for low temperature expression of RpoS (Repoila and Gottesman, 2001; Sledjeski et al., 1996).
An mRNA structure surveillance system is central to restoration of protein synthesis after cold shock
Our work on the cold shock response supports and extends our recent finding that the extent of ORF-wide mRNA secondary structure is the most important predictor of translation efficiency of endogenous ORF mRNAs during normal growth at 37°C (Burkhardt et al., 2017). Notably, because we were examining the same set of mRNAs following a single environmental perturbation (i.e. temperature), we were able to ask how internal changes in the cell modulate the relationship between the ORF-wide mRNA secondary structure of each ORF and its TE. We find that the decrease in protein synthesis immediately following cold shock is accompanied by a global increase in ORF-wide mRNA structure. Conversely, the increase in translation during acclimation is correlated with a decrease in ORF-wide mRNA structure (Figure 1G). Our finding that the extent of structural unfolding of individual ORF mRNAs correlates strongly with their extent of increase in translation efficiency strengthens the case for the intimate connection between mRNA structure and translatability.
This work further allowed us to identify the molecular underpinnings of the circuit that connects mRNA structure level to translatability. Our systematic search among upregulated proteins for those affecting translational recovery identified only the rnr and cspA deletions. Whereas deleting either separately had only a modest effect on translation, the double deletion strain could not recover translation (Figure 2B), indicating that these two proteins are the central players in the translation control circuit. We then identified the switch in this circuit. The long 5’UTRs of csp mRNAs had previously been shown to control Csp production in response to temperature. We show here that these 5’UTRs also control Csp production in response to cellular state (Figure 5, S4-S6), and that CspA alone is sufficient to meditate the switch in 5’UTR conformation at 10°C to the relatively inactive 37°C state (Figure 6, S7). Together, these elements comprise an mRNA surveillance system (Figure 7).
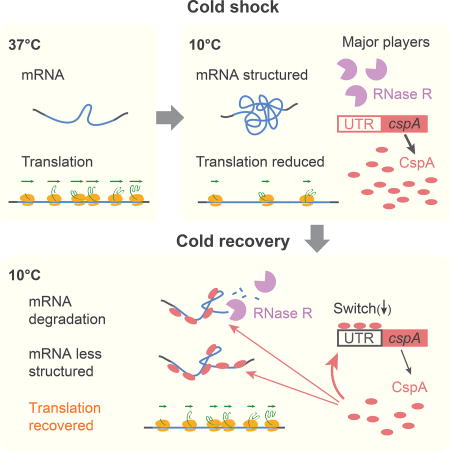
Figure 7. An mRNA structure surveillance system mediated by Csps and RNase R is central to translation recovery upon cold shock.

(A) ORF-wide mRNA structure is the strongest predictor of translation efficiency of endogenous genes in vivo during normal growth at 37°C. Orange ovals: transl ating ribosomes; green arrows: elongation rate. The level of CspA (red ovals) is limited by instability of its RNA mediated by its 5’UTR structure (indicated by black rectangle).
(B) Cold shock induces the expression of Csps and RNase R. After cold shock, genome-wide mRNA structure level increases and translation initiation and elongation decrease. The 5’UTR of cspA mRNA undergoes a structural change due to the temperature downshift (indicated by red rectangle), which is critical for increased expression.
(C) During acclimation, cellular translation is recovered via an mRNA structure surveillance system mediated by Csps and RNase R. Early after cold shock, Csps predominantly interact with cellular mRNA as RNA chaperones to decrease mRNA structure level and increase translation globally (B). As recovery proceeds and the Csp concentration increases, Csps bind their own 5’UTRs, triggering a conformational change (indicated by a black rectangle) that leads to decreased expression level. RNase R is required for facilitating degradation of the structured mRNA induced by temperature downshift, assisting Csps function by restoring the appropriate Csp/mRNA balance.
In this circuit, Csps remodel RNA secondary structure, and both our data and previous data indicate that this requires a high molar ratio of Csp/mRNA. During remodeling, there are up to 106 Csp proteins/cell (1 Csp/10 bases mRNA); decreasing the amount of Csps by successive csp deletion successively decreases remodeling (Figure 2B), validating the importance of a high Csp/mRNA ratio. Additionally, in vitro studies of the role of Csps in transcription antitermination (Bae et al., 1997) and in remodeling the cspA 5’UTR (Figure 6, S7) indicate that a high concentration of Csp relative to mRNA was required for biological effect. These findings are consistent with the fact that these small proteins bind RNA weakly and relatively nonspecifically and function as holdases to maintain an unfolded state (Jiang et al., 1997a; Phadtare and Inouye, 1999; Sachs et al., 2012).
The autoregulatory switch controlling CspA production enables the cell to monitor RNA structure. This switch sets Csp expression by monitoring the free level of Csps determined by the extent to which Csps are required to globally remodel mRNA structure. This parameter is set both by the amount of mRNA to be remodeled, and by the amount of Csps. At early times after cold shock, Csps are predominantly engaged in interacting with cellular mRNA, and do not perturb the long range pairing of the cold box element in the Csp 5’UTR triggered by temperature downshift (Figure 7B). As recovery proceeds and the Csp concentration increases, Csps bind their own 5’UTRs, triggering the conformational change and promoting decreased Csp expression (Figure 7C).
The nature of this circuit explains why deletions of either rnr or cspA led to modest reductions in translation recovery during acclimation, while deletions of both stopped translation recovery (Figure 2B). When only rnr is deleted, cells continue overexpressing their Csps until the appropriate Csp/RNA ratio that supports structure remodeling is reached. When only cspA is deleted, RNase R continues to facilitate mRNA degradation, allowing the minor Csps to eventually reach the appropriate Csp/RNA ratio. However, when both are deleted, expression of the less abundant Csps cannot restore the appropriate Csp/mRNA balance. This regulatory system closely resembles that of the bacteriophage T4 Gene32 protein (gp-32) autoregulatory circuit. Gp-32 is a single-strand DNA binding protein, and its production is translationally controlled to maintain a constant amount of free gp-32 in the face of changing amounts of ss-DNA (McPheeters et al., 1988; Shamoo et al., 1993; von Hippel et al., 1982).
The Csp RNA surveillance system is likely utilized in a wide variety of conditions and in most bacteria. We show here that during exponential growth at 37°C, Csp expression is physiologically relevant to maintain growth rate, and is required for optimal expression of the highest TE genes (Figure 4C-D). Additionally, both Csp and RNase R expression is reported to increase under suboptimal conditions (e.g. stationary phase, starvation, etc.) (Brandi et al., 1999; Chen and Deutscher, 2005; VanBogelen and Neidhardt, 1990), when decreased translation likely leads to increased mRNA structure. Csps span the gram-negative/positive divide, and Csps in B. subtilis exhibit strikingly similar properties to those in E. coli — high abundance during normal growth (Eymann et al., 2004) and induction during cold shock (Willimsky et al., 1992). The triple deletion of Csp homologs, cspBCD, in B. subtilis leads to inviability at optimal and low temperatures (Graumann et al., 1997). Finally, Csp orthologues have been identified in all domains (Karlson et al., 2002; Larrayoz et al., 2016; Nakaminami et al., 2006), and ectopic expression of bacterial Csps in maize enhances growth at cold and in water-limited conditions (Castiglioni et al., 2008), indicating that the mechanism through which they modulate protein synthesis is likely broadly relevant.
STAR Methods
CONTACT FOR REAGENT AND RESOURCE SHARING
Further information and requests for resources and reagents should be directed to and will be fulfilled by the Lead Contact, Carol A. Gross (cgrossucsf@gmail.com).
EXPERIMENTAL MODEL AND SUBJECT DETAILS
Strains and growth conditions
E. coli K-12 MG1655 was used as the wild-type strain. All culture experiments were performed in MOPS medium supplemented with 0.2% glucose, 19 amino acids (without methionine), vitamins, bases and micronutrients (MOPS rich defined medium minus methionine, Teknova). Cells were grown in an overnight liquid culture at 37°C, diluted to an OD420 = .001 in fresh medium and grown until OD420 reached 0.4 where samples were collected. For 10°C samples, cultures were grown to OD420 = 1.1 at 37°C and cold shock was performed by mixing 70mL of 37°C culture with 1 30mL of 0°C media pre-chilled in ice-water slurry, with continued growth of the culture in a 10°C shaker. Single deletion strains were generated by P1 phage transduction of FRT-flanked deletion alleles from the Keio collection (Baba et al., 2006) to MG1655 cells. Multiple deletion strains were generated by serial P1 phage transduction of FRT-flanked deletion alleles from the Keio collection (Baba et al., 2006) followed by marker excision by Flp recombinase (Cherepanov and Wackernagel, 1995) expressed from plasmid pCP20.
METHOD DETAILS
Measurement of total protein synthesis
1 µC of Perkin Elmer EasyTag 35S labeled methionine (Product # NEG709A) was mixed with 5 µL 288 µmol unlabeled methionine and 24 µL MOPS rich defined medium minus methionine, and pre-incubated at 37°C or 10°C. At the time of capture (t = 0, 10min, 30min, 60min, 2hr, 3hr, 4hr, 5hr, 6hr, 19hr, 21.5hr, 23hr, 24.5hr, 26.5hr after cold shock, as in Figure 1A), 900 µL of culture was added to this methionine mix, and was labeled on a shaker for 1 min at 37°C or for 5min at 10°C. After labeling, 100 µL of ice-cold 50% trichloracetic acid (TCA) was added to the sample, which was vortexed and placed on ice for at least 20 min to allow precipitation. Samples were then counted by running 100µL of sample through a 25mm APFC glass fiber filter (Millipore APFC02500) pre-wetted with 750 µL of 5% TCA on a vacuum stand, and washing three times with 750 µL 5% TCA and three times with 750 µL 95% ethanol. Filters were then placed in MP Ecolume scintillation fluid and counted using liquid scintillation counter. The total protein synthesis rate was calculated by the amount of 35S-methionine incorporated in newly synthesized peptides / minute / OD420 in 100µL of culture.
Ribosome profiling
The protocol for bacterial ribosome profiling was described (Li et al., 2014). 200 mL of cell culture was rapidly filtered by passing through a nitrocellulose filter with 220 nm pore size (GE MicroSep), and the cell pellet was flash-frozen in liquid nitrogen. Cells were pulverized in 10mL canisters (Retsch) pre-chilled in liquid nitrogen with 650 µL of frozen lysis buffer (10 mM MgCl2, 100mM NH4Cl, 20mM Tris-HCl pH 8.0, 0.1% NP-40, 0.4% Triton X-100, 100 U/mL DNase I (Roche), 1mM chloramphenicol) using QIAGEN TissueLyser II (5 cycles of 3 min at 15 Hz). Pulverized lysate was thawed on ice and clarified by centrifugation at 16,000×g for 10 min at 4°C. Clarified lysate containing 0.5 mg of RNA was digested for 1 h with 750 U of S7 micrococcal nuclease (Sigma-Aldrich) at 25°C. The reaction was quenched by addi ng EGTA to 6 mM and moved on ice. The monosome fraction was collected using sucrose gradient and hot-phenol extraction. Ribosome-protected mRNA fragments were isolated by size excision on a Novex 15% TBE-Urea gel (Invitrogen). Fragments with size ranging from 25 to 45 nucleotides were excised from the gel and extracted. Library generation was performed using the previously described strategy (Li et al., 2014) detailed below.
Determination of the fraction of total RNA that is stable RNA
In WT cells, it is well established that ~95% of the total RNA is stable RNA (rRNA and tRNA). Thus, total RNA per se is a good measure of stable RNA. However, we could not make that assumption in the rnr mutant strain, as there was no prior knowledge about the fate of stable RNA. We therefore used an independent method to determine the amount of total RNA in WT and rnr mutant cells. When cells are continuously labeled with 3H-uridine (Perkin Elmer, Product # NET174001MC), the cpm/ml/OD of the culture indicates the total RNA content of the cell. We therefore continuously labeled WT and rnr mutant cells with 3H-uridine during exponential growth at 37°C, by adding 10 µC of 3H-uridine to 5 mL culture (grown in MOPS complete minus Uridine and Methionine) when inoculating. After cold shock by adding 1.5 volume of 0°C medium, cells were sampled for radioactivity periodically at 20 min, 4 hr and 8 hr after temperature shift. Samples are precipitated, washed and counted as for 35S-methionine incorporation assay. The normalized counts (cpm/ml/OD) were used to normalize for the total RNA content of each cell type.
Total RNA / mRNA sequencing
For RNA-seq or mRNA seq experiments, 4mL of OD420 = 0.4 culture was added to 500µL of ice-cold stop solution (475 µL of 100% EtOH and 25µL acid phenol), vortexed, spun for 2 min at 8000rpm, and the cell pellet was flash frozen in liquid nitrogen. For RNA-seq following rifampicin treatment, rifampicin was added to a final concentration of 250 µg/mL two hours after the cold shock, and post-treatment samples were collected 2 hours later as described above. Total RNA was then hot acid phenol extracted. For experiments performed in parallel with ribosome profiling, total RNA was phenol extracted from the same lysate that was used for ribosome footprinting. If mRNA enrichment is required, ribosomal RNA and small RNA were removed from the total RNA with Ribozero (Epicenter) and MICROBExpress (Thermo Fisher), respectively. mRNA was randomly fragmented using RNA fragmentation Reagent (Ambion) by incubating at 95°C for 1 min 45 sec. The fragmented mRNA sample was size selected by running a Novex 15% TBE-Urea gel (Invitrogen) and excised between 20 and 50 nucleotides. mDNA was extracted and then converted to a complementary DNA library with the same strategy as for ribosome footprints.
Library generation for ribosome profiling and total RNA / mRNA-seq
The 3’ end of ribosome footprints or RNA fragments was dephosphorylated using 20 units of T4 polynucleotide kinase (New England Biolabs) at 37°C for 1 hr. Five picomoles of RNA were ligated to 1 mg of miRNA cloning linker-1 (IDT) 5rApp/CTGTAGGCACCATCAAT/3ddC/ using truncated T4 RNA ligase 2 K277Q (New England Biolabs) at 37°C for 2.5 hr. The ligat ed product was purified by size excision on a Novex 10% TBE-Urea polyacrylamide gel (Invitrogen). cDNA was generated by reverse transcription using Superscript III (Invitrogen) at 50°C for 30 min using the primer 5’Phos/AGATCGGAAGAGCGTCGTGTAGGGAAAGAGTGT/iSp18/CAAGCAGAAGA CGGCATACGAGATATTGATGGTGCCTACAG 3’, and isolated by size excision on a 10% TBE-Urea polyacrylamide gel (Invitrogen). Single-stranded cDNA was circularized with CircLigase (Epicenter) at 60°C fo r 2 hr. For ribosome profiling, ribosomal RNA fragments were removed using biotin-linked DNA oligos (5’Biosg/TCATCTCCGGGGGTAGAGCACTGTTTCG 3’, 5’Biosg/GGCTAAACCATGCACCGAAGCTGCGGCAG 3’, 5’Biosg/AAGGCTGAGGCGTGATGACGAGGCACT 3’, 5’Biosg/CGGTGCTGAAGCAACAAATGCCCTGCTT 3’) and MyOne Streptavidin C1 Dynabeads (Invitrogen). The remaining cDNA was amplified using Phusion DNA polymerase (NEB) with oNTI231 primer (5’ CAAGCAGAAGACGGCATACGA 3’) and indexing primers (5’ AATGATACGGCGACCACCGAGATCTACACGATCGGAAGAGCACACGTCTGAAC TCCAGTCACNNNNNNACACTCTTTCCCTACAC 3’) (NNNNNN represents the index sequence). After 8–10 rounds of PCR amplification, the library was selected by size excision on a Novex 8% TBE gel (Invitrogen) and purified.
DMS modification
For in vivo DMS modification, 15 mL of exponentially growing E. coli cells were incubated with 750 µL DMS. Incubation was performed for 2 min at 37°C or for 45 min at 10°C. DMS was quenched by adding 30 mL 0°C s top solution (30% β-mercaptoethanol, 25% isoamyl alcohol), after which cells were quickly put on ice, collected by centrifugation at 8000×g, 4 °C for 2 min, and washed with 8 mL 30% β-mercaptoethanol solution. Cells were then resuspended in 450 µL total RNA lysis buffer (10 mM EDTA, 50 mM sodium acetate pH 5.5), and total RNA was purified with hot acid phenol (Ambion). For kasugamycin experiments, kasugamycin was added to a final concentration of 10 mg/mL after 6 hr at 10°C for 40 min prior to DMS modification. For in vitro DMS modifications, 2 µg of mRNA was denatured at 95 °C for 2 min, cooled on ice and refolded in 90 µL RNA folding buffer (10 mM Tris pH 8.0, 100 mM NaCl, 6mM MgCl2) at 10°C for 30 min then inc ubated in 4% DMS for 40 min at 10°C. The DMS reaction was quenched using 30% BM E, 0.3 M sodium acetate pH 5.5, 2 µL GlycoBlue solution (Ambion) and precipitated with 1X volume of 100% isopropanol.
Library generation for DMS-seq
Sequencing libraries were prepared as described (Rouskin et al., 2014). DMS treated mRNA samples were denatured for 2 min at 95 °C and fragmented at 95 °C for 2 min in 1× RNA fragmentation buffer (Ambion). The reaction was stopped by adding 1/10 volume of 10X Stop solution (Ambion) and quickly placed on ice. The fragmented RNA was run on a Novex 10% TBE-Urea gel (Invitrogen) for 60 min, and fragments of 60–70 nucleotides in size were excised. These fragments were then ligated to linker and converted to DNA as described in the ribosome profiling section.
Library sequencing
Sequencing was performed on an Illumina HiSeq 2000 system. The linker sequence was clipped using FASTX-Toolkit (http://hannonlab.cshl.edu/fastx_toolkit/). Clipped sequences were mapped to the reference genome NC_000913.2.fna obtained from the NCBI Reference Sequence Bank using Bowtie v. 0.12.0 (http://bowtie-bio.sourceforge.net/index.shtml). Sequencing data from mutated strains were aligned to appropriately modified genome. For ribosome footprint and mRNA-seq samples, the center residues that were at least 12 nucleotides from either end were given a score of 1/N in which N equals the number of positions leftover after discarding the 12nt 5' and 3' ends. For DMS-seq samples, read counts were assigned to the base immediately 5' of the 5' end of each read, which is the base that was modified by DMS.
Identification of cold-induced genes
The relative translation rate of each ORF at different time points was determined by multiplying general cellular translation rate (measured by 35S-methionine incorporation) and the relative ribosomal density within that ORF (1).
| (1) |
T(x, t): Relative translation rate of gene x at time point t;
M(t): General cellular translation rate at time point t, measured by 35S-methionine incorporation rate;
R(x, t): RPKM (Reads Per Kilobase of transcript per Million mapped reads) of ribosome profiling signal of gene x at time point t.
Since protein degradation in the cell is marginal compared to protein synthesis, the protein abundance at 37°C was calculated as protein production during one doubling time at 37°C, and scaled to the published protein c opy number per cell at 37°C (Li et al., 2014) (2).
| (2) |
P37(x): Protein abundance of gene x during steady state growth at 37°C;
T37(x): Relative translation rate of gene x during steady state growth at 37°C, calculated as in (1);
Δt37: Doubling time (26min) of WT cells during steady state growth at 37°C;
C, C0: Scaling constant by comparing to the published protein copy number per cell (Li et al., 2014).
To quantify protein synthesis during acclimation, the relative protein synthesis rates between each two adjacent time-points after cold shock were averaged and multiplied by the length of time window. The total synthesis during all windows spanning the acclimation phase was then summed, referred to as protein synthesis during acclimation (3). The estimated protein abundances before cold shock P37(x) and that after the acclimation phase (6hr after cold shock) P10(x) were compared (4). ORFs with protein abundance increased > 5-fold during acclimation (P10(x)/P37(x) > 5) were listed in Table S2.
| (3) |
| (4) |
ΔPacc(x): Protein synthesis during acclimation of gene x;
Tacc(x, t): Relative translation rate of gene x at time point t during acclimation, calculated as in (1);
P10(x): Protein abundance of gene x at the end of acclimation (6hr after cold shock).
Meta-gene analysis of ribosome run-off after cold shock
At 5 min and 15 min after cold shock, the median of ribosome density at each position relative to the ORF start codon was calculated across well-expressed genes and normalized to the median ribosome density within the window between 1000 nt and 1180 nt downstream of start codon. Analysis is limited to ORFs ≥ 1200 nt long, and curves are smoothed by calculating the median within rolling windows of 25 nt (~ footprint size of ribosomes). In Figure 1C, we only show ribosome density signals starting from the +15nt of the ORFs, because it is unclear whether the ribosome enrichment near start codons is an actual signal, or represents post-association of ribosomes.
Translation efficiency (TE) calculation
To calculate mRNA abundance, the number of mRNA sequencing reads mapped to a gene, following a Winsorization applied to trim the top and bottom 5% of reads, was divided by the length of the gene to yield the number of reads corresponding to per kb message per million total sequencing reads. The protein synthesis rate of individual ORFs was measured by average ribosome footprint density of the ORF calculated as described in (Burkhardt et al., 2017; Li et al., 2014). First, genes with < 128 mapped reads in all samples and genes with unconventional translation events were excluded from the analysis. Second, sequencing reads from ribosome profiling mapped to the first and last five codons of the gene were excluded to remove effects of translation and termination. Third, correction for the variations in translation elongation rate (including possible ribosome pausing) was done by using 90% Winsorization, i.e. removing the outlier effect of the top and bottom 5% of the ribosome profiling signal. Finally, the average ribosome footprint density of a gene was calculated by dividing the corrected number of mapped ribosome footprint reads by the corrected length of the gene. Translation efficiency (TE) of a gene was calculated by normalizing the average ribosome footprint density by the mRNA abundance of the gene defined above. Note that when comparing TE of ORFs between different strains (e.g. WT cells versus ΔcspABEG cells), TE values were adjusted by the different overall protein synthesis rate, which was measured by the amount of 35S-methionine incorporated in newly synthesized peptides / minute / OD420 in 100µL of culture.
Computational prediction of RNA structures
For identification of unpaired bases, raw DMS-seq data from different biological replicates were pooled after checking the reproducibility, and then normalized to the most highly reactive residue after removing outliers by 98% Winsorisation. A/C bases with DMS-seq signal greater that 24% of the signal on the most highly reactive residue were called "unpaired" (Burkhardt et al., 2017). This signal cutoff was determined from comparing DMS-seq signal of cspA transcript to the cspA structure model probed in (Giuliodori et al., 2010). For determination of mRNA structures, a Viennafold (Hofacker, 2003) (http://rna.tbi.univie.ac.at/) minimum free energy model of the indicated region was generated, constrained by bases experimentally determined to be unpaired in the indicated dataset. mRNA structural model was visualized using VARNA (http://varna.lri.fr/).
Calculation of Gini index from DMS-seq data
The R package "ineq" was used to calculate Gini indices over As and Cs in the region specified for each experiment. For each DMS-seq sample, Gini indices were calculated only for genes that had greater than an average of 5 reads per nucleotide across the ORF (Figure S1C-D). Genes with discontinuous mRNA-seq reads (due to an early termination event or an internal promoter) were excluded from the analysis.
Purification of CspA protein
BL21 pLysS cells expressing N-terminus His-tagged CspA (with plasmid pET21a-cspA) were grown in LB with 75 µg/mL ampicillin and 10 µg/mL chloramphenicol at 37°C until exponential phase. CspA expression was i nduced by 1mM IPTG for 3hr and cells were collected by centrifuging at 5000rpm for 12min at 4°C. Cell pellet was resuspended in 20mL Buffer A (20mM Tris pH7.5, 300mM NaCl) and lysed with LM10 Microfluidizer. Cell lysate was centrifuged at 28600 rpm for 1hr at 4°C and supernatant was applied through column with TALON Cobalt affinity resin (Clontech Laboratories) pre-equilibrated with Buffer A. To eliminate the RNA/DNA associated with CspA, the column was extensively washed with 20CV of Buffer A with 8M Urea, and 2CV of Buffer A with 6, 4, 2, 1, 0.5, 0.1, 0.02, 0M Urea sequentially to remove the urea from buffer. The column was then washed with 3CV Buffer A with 5mM Imidazole and His-CspA protein was eluted using Buffer A with 200mM Imidazole. N-terminus His tag of the protein was cut by PreScission protease (GE Healthcare) during 16hr dialysis into RNase-free Buffer A (Slide-A-Lyzer™ MINI Dialysis Devices, ThermoFisher Scientific) and removed by glutathione affinity beads (Glutathione Sepharose 4B, GE Healthcare). Finally, CspA protein from the flow-through was concentrated to a final concentration of 6mg/mL within RNase-free Buffer A with 50% glycerol and kept at −20°C.
In vitro DMS modification of cspA mRNA
Full-length cspA mRNA was synthesized from an in vitro transcription assay (MAXIscript T7 Transcription Kit, Ambion) and purified with RNA Clean & Concentrator (Zymo Research). 500 ng of purified cspA mRNA was denatured at 95°C in RNase-free water for 1.5 min and shifted to 85 µL Folding Buffer (0.4M Sodium Cacodylate pH7.2, 6mM MgCl2) at 37°C or 10°C. For samples with CspA protein, different amount of protein (3, 6, 12 µL) was pre-incubated within the folding buffer at 37°C or 10°C before adding the denatured mRNA. mRNA was refolded at different temperature for 30 min. 10 µL DMS was added into the mixture and the reaction was continued for 10 min at 37°C or 2 hr a t 10°C with shaking at 500rpm, until quenched by adding 60µL β-mercaptoethanol.
cspA mRNA structure probing using DMS-MaPseq
The protocol for DMS-MaPseq was described (Zubradt et al., 2016). DMS-modified mRNA was purified with RNA Clean & Concentrator (Zymo Research), and reverse transcribed with 1µM cspA-specific primer (5’ GTACGAACACATCTTTAGAGCCATCGTCAGGAGTGATGAAG 3’), First strand buffer (Invitrogen), 1mM dNTP, 10mM DTT (freshly prepared), 10U SUPERase Inhibitor (Ambion) and 100 U TGIRT-III enzyme (InGex) at 57°C for 1hr 30min. The enzyme was inactivated by incubation at 85°C for 5m in, and mRNA template was digested by RNase H at 37°C for 20min. cDNA was PCR amplified using cspA-specific primers (Forward: 5’ GAACGGTTTGACGTACAGACC 3’; Reverse: 5’ GAGCCATCGTCAGGAGTGAT 3’) and Phusion HF Polymerase (NEB). Illumina libraries were constructed using the Beckman Coulter SPRIworks to adenylate ends and ligate adaptors to amplicons. PCR was then used to index libraries. Libraries were quantified using the Fragment Analyzer (Advanced Analytical) and qPCR before being loaded for paired-end sequencing using an Illumina MiSeq 250×250 Ver2 or 300×300 Ver3. Reads were aligned to the 5’UTR of cspA using bowtie2 and an alignment seed of 12nt. Low sequence quality bases (Q score < 20%) and missing bases due to truncated reads were set to question marks. Reads that consisted of more than 20% question marks were filtered out. Only mutations that agreed between the forward and the reverse read were considered true mutations. Mutation rate per base was calculated as number of reads with a mutation at the base divided by total number of reads covering the base. For identification of unpaired bases, DMS-MaPseq data was normalized to the most highly reactive residue within cspA 5’UTR. Biological replicates of samples were adjusted by 90% percentile of signals (to ensure they are directly comparable) and then averaged. A/C bases with signal greater that 27% of the maximum signal were called "unpaired". This signal cutoff was determined from comparing DMS-MaPseq signal of cspA transcript to the cspA structure model probed in (Giuliodori et al., 2010). Note that in Figure 6A and Figure S7, signals from +1 to +44 nt of cspA transcript are not included. PCR forward primer anneals to the first 20 nt (so no mutation rate was measured in this region), and the following 20 nt were excluded due to their possible low quality measurement of mutation rates. For determination of cspA 5’UTR structures, a Viennafold (Hofacker, 2003) (http://rna.tbi.univie.ac.at/) minimum free energy model was generated, constrained by A/C bases experimentally determined to be unpaired in the indicated dataset. mRNA structural model was visualized using VARNA (http://varna.lri.fr/).
QUANTIFICATION AND STATISTICAL ANALYSIS
All of the statistical details of results (including statistical tests used, sample number N, dispersion and precision measures) were indicated in the relevant figure legends. P-values were calculated using students’ t test if not specified otherwise, with p < 0.05 indicating significant. All the error bars used in the figures were obtained from more than two independent experiments as indicated in the figure legends, and data were represented as mean ± standard deviation (SD).
DATA AND SOFTWARE AVAILABILITY
The raw and processed data for the high throughput sequencing results have been deposited in NCBI GEO database with the accession number GSE103421. The source data related to figures are reported in Supplemental Tables as indicated in
Supplementary Material
Translation efficiency (TE) and mRNA secondary structure (Gini) of genes after cold shock
Comparison of protein abundance before and after cold shock
Relative translation level and mRNA level of genes across the acclimation phase
ncRNA level during the acclimation phase after cold shock
mRNA level of genes before and after rifampicin treatment in wild type and Δrnr cells during the acclimation phase
Comparison of RNA secondary structure (Gini) and translation efficiency (TE) between wild type and ΔcspABEG mutant cells after cold shock
Highlights.
mRNA unfolding drives translation recovery during acclimation after cold shock.
Csps and RNase R are the major players in the response.
Csps promote mRNA unfolding and RNase R degrades mRNA during translation recovery.
CspA modulates its 5' UTR structure to tune expression to demand.
Acknowledgments
This research was supported by the Center for RNA Systems Biology (J.S.W. P50 GM102706), the Howard Hughes Medical Institute (J.S.W.), the Helen Hay Whitney Foundation (G.W.L.), the Smith Family Award for Excellence in Biomedical Research (G.W.L.) and the National Institutes of Health (C.A.G. R01 GM036278 and R35 GM118061; and D.H.B., T32GM8284 and T32 EB009383, G.W.L., K99GM105913).
Footnotes
Publisher's Disclaimer: This is a PDF file of an unedited manuscript that has been accepted for publication. As a service to our customers we are providing this early version of the manuscript. The manuscript will undergo copyediting, typesetting, and review of the resulting proof before it is published in its final citable form. Please note that during the production process errors may be discovered which could affect the content, and all legal disclaimers that apply to the journal pertain.
Author Contributions
YZ, DHB, SR, GWL, JSW, and CAG designed the experiments. YZ, DHB and SR performed the experiments. YZ, DHB, SR and GWL analyzed the data. YZ, DHB, SR, GWL, JSW, and CAG drafted and revised the manuscript.
Declaration of Interests
The authors declare no competing interests.
References
- Awano N, Rajagopal V, Arbing M, Patel S, Hunt J, Inouye M, Phadtare S. Escherichia coli RNase R has dual activities, helicase and RNase. J. Bacteriol. 2010;192:1344–1352. doi: 10.1128/JB.01368-09. [DOI] [PMC free article] [PubMed] [Google Scholar]
- Baba T, Ara T, Hasegawa M, Takai Y, Okumura Y, Baba M, Datsenko KA, Tomita M, Wanner BL, Mori H. Construction of Escherichia coli K-12 in-frame, single-gene knockout mutants: the Keio collection. Mol Syst Biol. 2006;2 doi: 10.1038/msb4100050. 2006.0008. [DOI] [PMC free article] [PubMed] [Google Scholar]
- Bae W, Jones PG, Inouye M. CspA, the major cold shock protein of Escherichia coli, negatively regulates its own gene expression. J. Bacteriol. 1997;179:7081–7088. doi: 10.1128/jb.179.22.7081-7088.1997. [DOI] [PMC free article] [PubMed] [Google Scholar]
- Bae W, Xia B, Inouye M, Severinov K. Escherichia coli, CspA-family RNA chaperones are transcription antiterminators. Proc. Natl. Acad. Sci. U. S. A. 2000;97:7784–7789. doi: 10.1073/pnas.97.14.7784. [DOI] [PMC free article] [PubMed] [Google Scholar]
- Brandi A, Pietroni P, Gualerzi CO, Pon CL. Post-transcriptional regulation of CspA expression in Escherichia coli. Mol. Microbiol. 1996;19:231–240. doi: 10.1046/j.1365-2958.1996.362897.x. [DOI] [PubMed] [Google Scholar]
- Brandi a, Spurio R, Gualerzi CO, Pon CL. Massive presence of the Escherichia coli “major cold-shock protein” CspA under non-stress conditions. EMBO J. 1999;18:1653–1659. doi: 10.1093/emboj/18.6.1653. [DOI] [PMC free article] [PubMed] [Google Scholar]
- Burkhardt DH, Rouskin S, Zhang Y, Li GW, Weissman JS, Gross CA. Operon mRNAs are organized into ORF-centric structures that predict translation efficiency. Elife. 2017;6:1–23. doi: 10.7554/eLife.22037. [DOI] [PMC free article] [PubMed] [Google Scholar]
- Cairrão F, Cruz A, Mori H, Arraiano CM. Cold shock induction of RNase R and its role in the maturation of the quality control mediator SsrA/tmRNA. Mol. Microbiol. 2003;50:1349–1360. doi: 10.1046/j.1365-2958.2003.03766.x. [DOI] [PubMed] [Google Scholar]
- Castiglioni P, Warner D, Bensen RJ, Anstrom DC, Harrison J, Stoecker M, Abad M, Kumar G, Salvador S, D ’ordine R, Navarro S, Back S, Fernandes M, Targolli J, Dasgupta S, Bonin C, Luethy MH, Heard JE. Bacterial RNA Chaperones Confer Abiotic Stress Tolerance in Plants and Improved Grain Yield in Maize under Water- Limited Conditions. 2008;147:446–455. doi: 10.1104/pp.108.118828. [DOI] [PMC free article] [PubMed] [Google Scholar]
- Chen C, Deutscher MP. Elevation of RNase R in Response to Multiple Stress Conditions. 2005;280:34393–34396. doi: 10.1074/jbc.C500333200. [DOI] [PubMed] [Google Scholar]
- Cheng ZF, Deutscher MP. Quality control of ribosomal RNA mediated by polynucleotide phosphorylase and RNase. R. Proc Natl Acad Sci U S A. 2003;100:6388–6393. doi: 10.1073/pnas.1231041100. [DOI] [PMC free article] [PubMed] [Google Scholar]
- Cherepanov PP, Wackernagel W. Gene disruption in Escherichia coli: TcR and KmR cassettes with the option of Flp-catalyzed excision of the antibiotic-resistance determinant. Gene. 1995;158:9–14. doi: 10.1016/0378-1119(95)00193-a. [DOI] [PubMed] [Google Scholar]
- Darty K, Denise A, Ponty Y. VARNA: Interactive drawing and editing of the RNA secondary structure. BIOINFORMATICS. 2009;25:1974–1975. doi: 10.1093/bioinformatics/btp250. [DOI] [PMC free article] [PubMed] [Google Scholar]
- Eymann C, Dreisbach A, Albrecht D, Bernhardt J, Becher D, Gentner S, Tam LT, Büttner K, Buurman G, Scharf C, Venz S, Völker U, Hecker M. A comprehensive proteome map of growing Bacillus subtilis cells. Proteomics. 2004;4:2849–2876. doi: 10.1002/pmic.200400907. [DOI] [PubMed] [Google Scholar]
- Fang L, Hou Y, Inouye M. Role of the cold-box region in the 5’ untranslated region of the cspA mRNA in its transient expression at low temperature in Escherichia colt. J. Bacteriol. 1998;180:90–95. doi: 10.1128/jb.180.1.90-95.1998. [DOI] [PMC free article] [PubMed] [Google Scholar]
- Fang L, Jiang W, Bae W, Inouye M. Promoter-independent cold-shock induction of cspA and its derepression at 37° C by mRNA stabilization. Mol. Microbiol. 1997;23:355–64. doi: 10.1046/j.1365-2958.1997.2351592.x. [DOI] [PubMed] [Google Scholar]
- Farewell a, Neidhardt FC. Effect of temperature on in vivo protein synthetic capacity inEscherichia coli. J. Bacteriol. 1998;180:4704–10. doi: 10.1128/jb.180.17.4704-4710.1998. [DOI] [PMC free article] [PubMed] [Google Scholar]
- Francez-charlot A, Gutierrez C, Cam K, Castanie M. Osmotic Regulation of the Escherichia coli bdm (Biofilm-Dependent Modulation) Gene by the RcsCDB His-Asp Phosphorelay Osmotic Regulation of the Escherichia coli bdm (Biofilm-Dependent Modulation) Gene by the RcsCDB His-Asp Phosphorelay. 2005;187:1–6. doi: 10.1128/JB.187.11.3873. [DOI] [PMC free article] [PubMed] [Google Scholar]
- Friedman H, Lu P, Rich a. Temperature control of initiation of protein synthesis in Escherichia coli. J. Mol. Biol. 1971;61:105–121. doi: 10.1016/0022-2836(71)90209-9. [DOI] [PubMed] [Google Scholar]
- Friedman H, Ponzy L, Rich A. An In Vivo Block in the Initiation of Protein Synthesis. 1969 doi: 10.1101/sqb.1969.034.01.031. [DOI] [PubMed] [Google Scholar]
- Giuliodori AM. Cold shock response in Escherichia coli : a model system to study posttranscriptional regulation. 2016:859–872. [Google Scholar]
- Giuliodori AM, Pietro FDi, Marzi S, Masquida B, Wagner R, Romby P, Gualerzi CO, Pon CL. Article The cspA mRNA Is a Thermosensor that Modulates Translation of the Cold-Shock Protein CspA. Mol. Cell. 2010;37:21–33. doi: 10.1016/j.molcel.2009.11.033. [DOI] [PubMed] [Google Scholar]
- Goldenberg D, Azar I, Oppenheim AB. Differential mRNA stability of the cspA gene in the cold-shock response of Escherichia coli. Mol. Microbiol. 1996;19:241–8. doi: 10.1046/j.1365-2958.1996.363898.x. [DOI] [PubMed] [Google Scholar]
- Goldstein J, Pollitt NS, Inouye M. Major cold shock protein of Escherichia coli. Proc. Natl. Acad. Sci. U. S. A. 1990;87:283–7. doi: 10.1073/pnas.87.1.283. [DOI] [PMC free article] [PubMed] [Google Scholar]
- Graumann P, Wendrich TM, Weber MHW, Schröder K, Marahiel MA. A family of cold shock proteins in Bacillus subtilis is essential for cellular growth and for efficient protein synthesis at optimal and low temperatures. Mol. Microbiol. 1997;25:741–756. doi: 10.1046/j.1365-2958.1997.5121878.x. [DOI] [PubMed] [Google Scholar]
- Gualerzi CO, Giuliodori AM, Brandi A, Di Pietro F, Piersimoni L, Fabbretti A, Pon CL. Translation initiation at the root of the cold-shock translational bias. Ribosomes. 2011:143–154. doi: 10.1007/978-3-7091-0215-2_12. [DOI] [Google Scholar]
- Gualerzi CO, Giuliodori AM, Pon CL. Transcriptional and post-transcriptional control of cold-shock genes. J. Mol. Biol. 2003;331:527–539. doi: 10.1016/S0022-2836(03)00732-0. [DOI] [PubMed] [Google Scholar]
- Hankins JS, Zappavigna C, Prud’homme-Généreux A, Mackie GA. Role of RNA structure and susceptibility to RNase E in regulation of a cold shock mRNA, cspA mRNA. J. Bacteriol. 2007;189:4353–4358. doi: 10.1128/JB.00193-07. [DOI] [PMC free article] [PubMed] [Google Scholar]
- Hofacker IL. Vienna RNA secondary structure server. Nucleic Acids Res. 2003;31:3429–3431. doi: 10.1093/nar/gkg599. [DOI] [PMC free article] [PubMed] [Google Scholar]
- Inoue T, Cech TR. Secondary structure of the circular form of the Tetrahymena rRNA intervening sequence: a technique for RNA structure analysis using chemical probes and reverse transcriptase. Proc. Natl. Acad. Sci. U.S.A. 1985;82:648–52. doi: 10.1073/pnas.82.3.648. [DOI] [PMC free article] [PubMed] [Google Scholar]
- Jiang W, Hou Y, Inouye M. CspA, the Major Cold-shock Protein of Escherichia coli, Is an RNA Chaperone. 1997a;272:196–202. doi: 10.1074/jbc.272.1.196. [DOI] [PubMed] [Google Scholar]
- Jiang W, Hou Y, Inouye M. CspA, the major cold-shock protein of Escherichia coli, is an RNA chaperone. J. Biol. Chem. 1997b;272:196–202. doi: 10.1074/jbc.272.1.196. [DOI] [PubMed] [Google Scholar]
- Jones PG, Inouye M. RbfA, a 30S ribosomal binding factor, is a cold-shock protein whose absence triggers the cold-shock response. Mol. Microbiol. 1996;21:1207–1218. doi: 10.1111/j.1365-2958.1996.tb02582.x. [DOI] [PubMed] [Google Scholar]
- Jones PG, Mitta M, Kim Y, Jiang W, Inouye M. Cold shock induces a major ribosomal-associated protein that unwinds double-stranded RNA in Escherichia coli. Proc. Natl. Acad. Sci. U.S.A. 1996;93:76–80. doi: 10.1073/pnas.93.1.76. [DOI] [PMC free article] [PubMed] [Google Scholar]
- Jones PG, VanBogelen RA, Neidhardt FC. Induction of proteins in response to low temperature in Escherichia coli. J. Bacteriol. 1987;169:2092–5. doi: 10.1128/JB.169.5.2092-2095.1987. [DOI] [PMC free article] [PubMed] [Google Scholar]
- Karlson D, Nakaminami K, Toyomasu T, Imai R. A cold-regulated nucleic acid-binding protein of winter wheat shares a domain with bacterial cold shock proteins. J. Biol. Chem. 2002;277:35248–35256. doi: 10.1074/jbc.M205774200. [DOI] [PubMed] [Google Scholar]
- Langmead B, Trapnell C, Pop M, Salzberg SL. Ultrafast and memory-efficient alignment of short DNA sequences to the human genome. Genome Biol. 2009;10:R25. doi: 10.1186/gb-2009-10-3-r25. [DOI] [PMC free article] [PubMed] [Google Scholar]
- Larrabee KL, Phillips JO, Williams GJ, Larrabee AR. The relative rates of protein synthesis and degradation in a growing culture of Escherichia coli. J. Biol. Chem. 1980;255:4125–4130. [PubMed] [Google Scholar]
- Larrayoz IM, Rey-Funes M, Contartese DS, Rolón F, Sarotto A, Dorfman VB, Loidl CF, Martínez A. Cold shock proteins are expressed in the retina following exposure to low temperatures. PLoS One. 2016;11:1–16. doi: 10.1371/journal.pone.0161458. [DOI] [PMC free article] [PubMed] [Google Scholar]
- Li GW, Burkhardt D, Gross C, Weissman JS. Quantifying absolute protein synthesis rates reveals principles underlying allocation of cellular resources. Cell. 2014;157:624–635. doi: 10.1016/j.cell.2014.02.033. [DOI] [PMC free article] [PubMed] [Google Scholar]
- Lim B, Gross CA. Cellular Response to Heat Shock and Cold Shock. In: Storz G, Hengge R, editors. Bacterial Stress Responses. Second. ASM Press; Washington, DC: 2011. pp. 93–114. [DOI] [Google Scholar]
- Limsuwun K, Jones PG. Spermidine acetyltransferase is required to prevent spermidine toxicity at low temperatures in Escherichia coli. J. Bacteriol. 2000;182:5373–5380. doi: 10.1128/JB.182.19.5373-5380.2000. [DOI] [PMC free article] [PubMed] [Google Scholar]
- Luttinger a, Hahn J, Dubnau D. Polynucleotide phosphorylase is necessary for competence development in Bacillus subtilis. Mol. Microbiol. 1996;19:343–356. doi: 10.1046/j.1365-2958.1996.380907.x. [DOI] [PubMed] [Google Scholar]
- McPheeters DS, Stormo GD, Gold L. Autogenous regulatory site on the bacteriophage T4 gene 32 messenger RNAJMol. Biol. 1988;201:517–535. doi: 10.1016/0022-2836(88)90634-1. [DOI] [PubMed] [Google Scholar]
- Nakaminami K, Karlson DT, Imai R. Functional conservation of cold shock domains in bacteria and higher plants. Proc. Natl. Acad. Sci U. S. A. 2006;103:10122–10127. doi: 10.1073/pnas.0603168103. [DOI] [PMC free article] [PubMed] [Google Scholar]
- Phadtare S, Inouye M. Sequence-selective interactions with RNA by CspB, CspC and CspE, members of the CspA family of Escherichia coli. Mol. Microbiol. 1999;33:1004–1014. doi: 10.1046/j.1365-2958.1999.01541.x. [DOI] [PubMed] [Google Scholar]
- Phadtare S, Inouye M, Severinov K. The nucleic acid melting activity of Escherichia coli CspE is critical for transcription antitermination and cold acclimation of cells. J. Biol. Chem. 2002;277:7239–7245. doi: 10.1074/jbc.M111496200. [DOI] [PubMed] [Google Scholar]
- Phadtare S, Severinov K. Nucleic acid melting by Escherichia coli CspE. Nucleic Acids Res. 2005;33:5583–5590. doi: 10.1093/nar/gki859. [DOI] [PMC free article] [PubMed] [Google Scholar]
- Purusharth RI, Klein F, Sulthana S, Jäger S, Jagannadham MV, Evguenieva-Hackenberg E, Ray MK, Klug G. Exoribonuclease R interacts with endoribonuclease E and an RNA helicase in the psychrotrophic bacterium Pseudomonas syringae Lz4W. J.Biol. Chem. 2005;280:14572–14578. doi: 10.1074/jbc.M413507200. [DOI] [PubMed] [Google Scholar]
- Repoila F, Gottesman S. Signal Transduction Cascade for Regulation of RpoS : Temperature Regulation of DsrA Signal Transduction Cascade for Regulation of RpoS : Temperature Regulation of DsrA. Growth (Lakeland) 2001;183:4012–4023. doi: 10.1128/JB.183.13.4012. [DOI] [PMC free article] [PubMed] [Google Scholar]
- Richards J, Mehta P, Karzai AW. RNase R degrades non-stop mRNAs selectively in an SmpB-tmRNA-dependent manner. Mol. Microbiol. 2006;62:1700–1712. doi: 10.1111/j.1365-2958.2006.05472.x. [DOI] [PubMed] [Google Scholar]
- Rouskin S, Zubradt M, Washietl S, Kellis M, Weissman JS. Genome-wide probing of RNA structure reveals active unfolding of mRNA structures in vivo. Nature. 2014;505:701–705. doi: 10.1038/nature12894. [DOI] [PMC free article] [PubMed] [Google Scholar]
- Sachs R, Max KEa, Heinemann UDO, Balbach J. RNA single strands bind to a conserved surface of the major cold shock protein in crystals and solution. Cold Harb. Lab Press ISSN. 2012;18:65–76. doi: 10.1261/rna.02809212. [DOI] [PMC free article] [PubMed] [Google Scholar]
- Shamoo Y, Tam A, Konigsberg WH, Williams KR. Translational Repression by the Bacteriophage T4 Gene 32 Protein Involves Specific Recognition of an RNA Pseudoknot Structure. J. Mol. Biol. 1993 doi: 10.1006/jmbi.1993.1372. [DOI] [PubMed] [Google Scholar]
- Shiver AL, Osadnik H, Kritikos G, Li B, Krogan N, Typas A, Gross CA. A Chemical-Genomic Screen of Neglected Antibiotics Reveals Illicit Transport of Kasugamycin and Blasticidin S. PLoS Genet. 2016;12:e1006124. doi: 10.1371/journal.pgen.1006124. [DOI] [PMC free article] [PubMed] [Google Scholar]
- Sledjeski DD, Gupta a, Gottesman S. The small RNA, DsrA, is essential for the low temperature expression of RpoS during exponential growth in Escherichia coli. EMBO J. 1996;15:3993–4000. [PMC free article] [PubMed] [Google Scholar]
- Taniguchi Y, Choi PJ, Li G, Chen H, Babu M, Hearn J, Emili A, Xie XS. Sensitivity in Single Cells. Science. 2011;329:533–539. doi: 10.1126/science.1188308. [DOI] [PMC free article] [PubMed] [Google Scholar]
- VanBogelen Ra, Neidhardt FC. Ribosomes as sensors of heat and cold shock in Escherichia coli. Proc. Natl. Acad. Sci. U. S. A. 1990;87:5589–5593. doi: 10.1073/pnas.87.15.5589. [DOI] [PMC free article] [PubMed] [Google Scholar]
- von Hippel PH, Kowalczykowski SC, Lonberg N, Newport JW, Paul LS, Stormo GD, Gold L. Autoregulation of gene expression. J. Mol. Biol. 1982;162:795–818. doi: 10.1016/0022-2836(82)90548-4. [DOI] [PubMed] [Google Scholar]
- White-Ziegler CA, Um S, Pérez NM, Berns AL, Malhowski AJ, Young S. Low temperature (23 °C) increases expression of bio film-, cold-shock- and RpoS-dependent genes in Escherichia coli K-12. Microbiology. 2008;154:148–166. doi: 10.1099/mic.0.2007/012021-0. [DOI] [PubMed] [Google Scholar]
- Willimsky G, Bang H, Fischer G, Marahiel Ma. Characterization of Cspb, a Bacillus-Subtilis Inducible Cold Shock Gene Affecting Cell Viability at Low-Temperatures. J.Bacteriol. 1992;174:6326–6335. doi: 10.1128/jb.174.20.6326-6335.1992. 0021-9193/92/206326-10$02.00/0. [DOI] [PMC free article] [PubMed] [Google Scholar]
- Xia B, Ke H, Inouye M. Acquirement of cold sensitivity by quadruple deletion of the cspA family and its suppression by PNPase S1 domain in Escherichia coli. Mol. Microbiol. 2001;40:179–188. doi: 10.1046/j.1365-2958.2001.02372.x. [DOI] [PubMed] [Google Scholar]
- Xia B, Ke H, Jiang W, Inouye M. The Cold Box stem-loop proximal to the 5′- end of the Escherichia coli cspA gene stabilizes its mRNA at low temperature. J. Biol. Chem. 2002;277:6005–6011. doi: 10.1074/jbc.M109700200. [DOI] [PubMed] [Google Scholar]
- Yamanaka K, Inouye M. Selective mRNA Degradation by Polynucleotide Phosphorylase in Cold Shock Adaptation in Escherichia coli. 2001;183:2808–2816. doi: 10.1128/JB.183.9.2808. [DOI] [PMC free article] [PubMed] [Google Scholar]
- Yamanaka K, Mitta M, Inouye M. Mutation Analysis of the 5’ Untranslated Region of the Cold Shock cspA mRNA of Escherichia coli. 1999;181:6284–6291. doi: 10.1128/jb.181.20.6284-6291.1999. [DOI] [PMC free article] [PubMed] [Google Scholar]
- Zubradt M, Gupta P, Persad S, Lambowitz AM, Weissman JS, Rouskin S. DMS-MaPseq for genome-wide or targeted RNA structure probing in vivo. Nat. Methods. 2016;14:75–82. doi: 10.1038/nmeth.4057. [DOI] [PMC free article] [PubMed] [Google Scholar]
Associated Data
This section collects any data citations, data availability statements, or supplementary materials included in this article.
Supplementary Materials
Translation efficiency (TE) and mRNA secondary structure (Gini) of genes after cold shock
Comparison of protein abundance before and after cold shock
Relative translation level and mRNA level of genes across the acclimation phase
ncRNA level during the acclimation phase after cold shock
mRNA level of genes before and after rifampicin treatment in wild type and Δrnr cells during the acclimation phase
Comparison of RNA secondary structure (Gini) and translation efficiency (TE) between wild type and ΔcspABEG mutant cells after cold shock