Abstract
To evaluate the presence and types of artifacts seen in the color elastograms in thyroid elastography using Shear-Wave elastography. This HIPAA-compliant study was approved by the ethics committee of our institution, and all patients provided written informed consent. 178 patients (40 men and 138 women; mean age, 49 years; range, 19–84 years) were enrolled for a total of 241 thyroid nodules. After a short Ultrasound (US) examination, SWE images were acquired at multiple levels in the nodule in transverse and longitudinal orientations. A total of 1297 images were obtained from 241 nodules for an average of 5.4 ± 2.7 (SD) images per nodule. A retrospective review of all images was performed by one reviewer experienced in thyroid elastography. 280 images (21.6%) were rated as good quality and 112 (8.6%) were rated as moderate quality without artifacts. A total of 905 (69.8%) images had some artifact present, though most of these images (73.4%) were still interpretable. There were 241 images (18.6% of all images) considered uninterpretable due to artifact. The most common types of artifacts were from operator error (44.6% of all images), primarily due to compression (36.5% of all images). Other artifacts seen were due to anatomy (presence of carotid pulsation or adjacent to thyroid or location in isthmus, 11% of all images), nodule characteristics (cystic and calcified nodules or large nodules with lack of penetration, 17% of all images) and other artifacts which could not be explained by the prior mentioned causes (13% of all images). Our study indicates that artifacts are commonly present in the elastography images. Operator error was the most common type of artifact that we saw. This should be easily correctable by adequate knowledge and recognition with subsequent correction of the artifacts.
Keywords: Elastography, Thyroid, Artifacts
INTRODUCTION
Thyroid elastography is commonly used in combination with thyroid ultrasound (US) in the evaluation of nodules for the risk of malignancy. Its use is particularly prevalent outside of the United States - in Europe and Asia (Andrioli and Persani 2014). US can identify nodule features that are associated with higher risk of malignancy as well as benign features, both of which help determine which nodules are appropriate to biopsy (Frates, et al. 2005).
Shearwave elastography (SWE) is a relatively new diagnostic tool that measures tissue stiffness by estimating the speed of shear waves generated by the acoustic radiation force of ultrasound push pulses. In this approach, a planar shear wave is generated from push pulses focused at increasing depths (Kim, et al. 2012). A Doppler-like acquisition is used to detect and track the resulting tissue displacements generated from the passing shear wave, which is used to estimate the local tissue’s shear wave speed. Because the shear wave speed can be directly related to the elastic or Young’s modulus, a quantitative estimate of tissue stiffness (in kilopscal; kPa) can be obtained (Lyshchik, et al. 2005). SWE is currently the most reproducible and least operator-dependent technique among the different elastographic techniques available today (Lim, et al. 2012). SWE has been studied to differentiate benign from malignant thyroid nodules, as most of the malignant nodules are stiffer than the benign nodules (Andrioli and Persani 2014). However, various factors influence the elastographic evaluation of thyroid nodules including carotid pulsation, patient body habitus, tracheal motion, rim calcification, compressive force, etc. (Kim, et al. 2012, Lim, et al. 2012). Due in part to these factors, SWE imaging has a number of different artifacts that can influence the true thyroid stiffness measurement. In our experience, we have seen multiple artifacts in the SWE images of the thyroid gland and these artifacts, as of yet, have not been described in literature. Knowledge of the artifacts is important to avoid mistakes in interpretation of images and also to be able to modify the acquisition technique to acquire the best and most consistent images for accurate diagnosis. Our objective was to describe the artifacts encountered in SWE imaging of thyroid nodules so as to avoid them in future studies and improve diagnostic performance.
MATERIALS AND METHODS
This study was HIPAA compliant, approved by the institutional review board. All patients provided written informed consent. The authors were the study guarantors and had complete control of the data.
Patients
Patients were referred to the US clinic for preoperative mapping of the neck for lymph nodes in patients undergoing partial or complete thyroidectomy or guided Fine Needle Aspiration (FNA). Society of Radiologists in Ultrasound (SRU) guidelines for thyroid nodule biopsy are implemented at our institution and these patients were invited to participate in the study. Patients were selected for FNA based on the SRU guidelines (Frates, et al. 2005)or because they were at high risk based on their history such as radiation exposure or family history of thyroid cancer. Patients less than 18 years of age, who were unable to consent, or with a diffuse abnormality of the thyroid without discrete nodules were excluded. Both gray scale US and Color Doppler (CD) was performed followed by SWE. US gray scale and CD images were not evaluated for the purpose of this study.
Elastography
SWE was performed prior to the FNA or after the clinical US for preoperative mapping with an ultrasound machine (SuperSonic Imagine’s Aixplorer, Aix en Provence, France) with a broadband (4–15 MHz) linear array transducer. After obtaining B-mode and CD, SWE images were obtained for the thyroid nodules by seven sonographers trained in elastography for at least 5 years, though they were relatively new to SWE imaging. The exam was performed with the patient in the supine position with mild extension of the neck. After application of adequate US gel, imaging was performed by lightly placing the transducer on the patient’s neck. The patient was asked to hold their breath for a short time while elastography images were acquired.
Retrospective review of images for artifacts
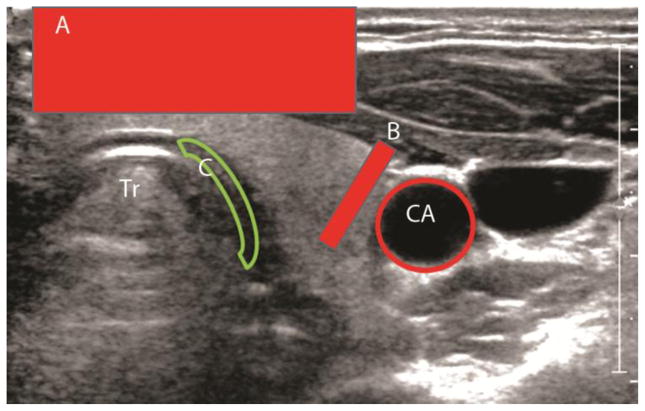
The authors in the study evaluated a subset of the images for quality and defined which images would be considered as good, moderate quality, artifacts present with either interpretable or non-interpretable images. In addition, the type of artifacts seen were listed by the authors by consensus. Overall image quality was rated as good without artifacts, moderate without artifacts, artifacts present but interpretable, and artifacts present and not interpretable. Images were also classified by each type of artifact present, if any. Artifacts were categorized as due to patient anatomy (trachea, common carotid artery pulsation, jugular vein, and vertebral bodies), nodule characteristics (cystic, calcified shell, macrocalcifications, and depth >3cm), operator-dependent factors (compression, probe frequency too high, blurring due to probe motion, and lack of contact of probe with neck), and lack of SWE signal not otherwise explained by the preceeding factors (noise/low signal-to-noise ratio [SNR] and incomplete/weak SWE signal in nodule). One of the authors (J.T.) who was blinded to cytopathology or histopathology results then retrospectively reviewed the images for presence of artifacts. For each type of artifact, the reviewer also indicated whether the artifact made the SWE images uninterpretable or not. Some examples are shown in Figure 1.
Figure 1.
Various types of artifacts seen in the thyroid during SWE imaging. A – Artifact due to compression, B- Artifact due to carotid artery pulsation, C – artifact due compression against hard surface - trachea
Tr-Trachea. CA – Carotid artery
STATISTICAL ANALYSIS
The frequency of each type of artifact were summarized as count (percentage). The frequencies of each type of artifact were further broken down by whether the artifact made the image interpretable or not. The rates of each major type of artifact were further broken down by sonographer. Mixed effect logistic regression models were used to test for variation in the artifact rates between sonographers and for trends in artifact rates over time. For each model, the dependent variable was the presence of artifact and random intercept terms were included for each patient and each sonographer. A variable indicating the number of SWE exams performed by the sonographer (counting from 1, 2, 3, etc. across all exams in this study) was included as an independent variable when assessing trends in artifact rates over time. The sonographer variance components and trends were tested using likelihood ratio tests. All statistical calculations were conducted with the statistical computing language R (version 3.1.1; R Foundation for Statistical Computing, Vienna, Austria) and the lme4 package (Bates, et al. 2015).
RESULTS
One hundred seventy eight patients (40 men and 138 women; mean age, 49 years; range, 19–84 years) were enrolled, from which a total of 241 thyroid nodules were imaged. A total of 1297 images were obtained from these 241 nodules for an average of 5.4 ± 2.7 (SD) images per nodule on an average.
Table 1 lists the four different quality categories images were grouped into during retrospective review. Twenty two percent (280 images) were rated as good quality with no evidence of artifacts in the images. Nine percent (112 images) were rated as moderate quality without artifacts. The remaining 905 images of 1297 (69.8%) had some artifacts present. Of these 905 images with one or more artifacts, 664 (73.4%) were still interpretable and usable for measuring tissue stiffness within nodules if the artifacts were avoided.
Table 1.
Image quality ratings across all 1297 images.
| Image Quality Rating | No. (%) |
|---|---|
| Good | 280 (21.6) |
| Moderate | 112 (8.6) |
| Artifact(s) present but interpretable | 664 (51.2) |
| Artifact(s) present and not interpretable | 241 (18.6) |
A total of 241 (18.6% of 1297) images were considered uninterpretable due to presence of some artifact. The most common types of artifacts making an image uninterpretable are listed in Table 2. Operator error (43.6% of the 241 uninterpretable images) was the most common class of artifact seen in our dataset, followed by lack of SWE signal (37.8%), nodule characteristics (26.1%) and anatomy (3.7%).
Table 2.
Artifact types seem in the 241 uninterpretable images.
| Artifacts | No. (%) |
|---|---|
| Due to anatomy | 9 (3.7) |
| Due to nodule characteristics | 63 (26.1) |
| Due to operator error | 105 (43.6) |
| Lack of SWE signal* | 91 (37.8) |
Artifact not explained by presence of any of the above anatomic, nodule or operator-dependent factors.
As shown in Table 3, the most common type of artifact seen in the operator error category was artifact due to over compression, which was seen in 36.5% of all images though only made the images uninterpretable 5.1% of the time (out of 1297 images). The next most common type of operator-dependent artifact was due to the probe frequency being too high, which led to poor penetration (10.3% total and 3.3% rendering the images uninterpretable). Artifacts due to the nodule characteristics were seen in 16.6% of images and made the images uninterpretable in 4.9% (Table 3). The most common reason was cystic nodules (9.3% and 1.8%). Artifacts due to anatomy occurred in 11.4% of all images but only made the images uninterpretable in 0.7%. The last group of artifacts were those associated with a lack of SWE signal within nodules for reasons not already attributed to operator error or obvious nodule characteristics. These were observed in 12.7% of all images and rendered images uninterpretable in 7.0%, as shown in Table 3.
Table 3.
Artifact types present across all images. The denominator for all percentages as 1297 images. Artifacts were further subdivided by whether they made the images uninterpretable or not. The sum of the values in the “Yes” and “No” columns add up to the values in the “All “ column.
| Variable | All | Still Interpretable | |
|---|---|---|---|
|
| |||
| Yes | No | ||
| Artifacts: Anatomy | 148 (11.4) | 139 (10.7) | 9 (0.7) |
|
| |||
| Trachea | 83 (6.4) | 74 (5.7) | 9 (0.7) |
| Common carotid artery pulsation | 47 (3.6) | 47 (3.6) | 0 (0.0) |
| Jugular vein | 6 (0.5) | 6 (0.5) | 0 (0.0) |
| Vertebral bodies | 21 (1.6) | 21 (1.6) | 0 (0.0) |
| Artifacts: Nodule characteristics | 215 (16.6) | 152 (11.7) | 63 (4.9) |
|
| |||
| Cyst | 121 (9.3) | 97 (7.5) | 24 (1.8) |
| Calcified shell | 7 (0.5) | 0 (0.0) | 7 (0.5) |
| Macrocalcifications | 37 (2.8) | 32 (2.5) | 5 (0.4) |
| Nodule too deep (>3 cm) | 52 (4.0) | 23 (1.8) | 29 (2.2) |
| Artifacts: Operator-dependent | 578 (44.6) | 475 (36.6) | 105 (8.1) |
|
| |||
| Compression | 473 (36.5) | 407 (31.4) | 66 (5.1) |
| Probe frequency too high (poor penetration) | 134 (10.3) | 91 (7.0) | 43 (3.3) |
| Blurring due to probe motion | 25 (1.9) | 14 (1.1) | 11 (0.8) |
| Lack of contact of probe with neck | 7 (0.5) | 6 (0.5) | 1 (0.1) |
| Artifacts: Lack of SWE signal* | 165 (12.7) | 74 (5.7) | 91 (7.0) |
|
| |||
| Noise (low SNR) | 17 (1.3) | 14 (1.1) | 3 (0.2) |
| Incomplete/weak signal in nodule | 140 (10.8) | 63 (4.9) | 77 (5.9) |
Artifact not explained by presence of any of the above anatomic, nodule or operator-dependent factors.
Table 4 summarizes the rate of each type of artifact by sonographer. There were no significant differences in rates of artifacts due to anatomy (rate: 5.2% to 21.6% per sonographer, p=0.35) or nodule characteristics (rate: 9.3% to 33.3%, p>0.99). There was significant variation in rates of operator-dependent artifacts (rate: 26.0% to 66.7%, p<0.001) and artifacts associated with a lack of SWE signal, not otherwise explained (rate: 4.0% to 28.1%, p=0.010). The latter class of artifacts may also be due to operator-dependent factors though the specific cause of the artifact was not clear. There were no significant trends in artifact reduction over time across all sonographers (p>0.30 for all types).
Table 4.
Artifacts by sonographer across the 1297 images.
| Artifacts | Sonographer
|
P-value† | |||||
|---|---|---|---|---|---|---|---|
| S1 (N=346) | S2 (N=324) | S3 (N=237) | S4 (N=231) | S5 (N=108) | Others * (N=51) | ||
| Any type | 189 (54.6) | 230 (71.0) | 198 (83.5) | 156 (67.5) | 89 (82.4) | 43 (84.3) | 0.002 |
| Due to anatomy | 22 (6.4) | 47 (14.5) | 37 (15.6) | 12 (5.2) | 19 (17.6) | 11 (21.6) | 0.35 |
| Due to nodule characteristics | 65 (18.8) | 45 (13.9) | 39 (16.5) | 39 (16.9) | 10 (9.3) | 17 (33.3) | >0.99 |
| Due to operator error | 118 (34.1) | 174 (53.7) | 123 (51.9) | 60 (26.0) | 69 (63.9) | 34 (66.7) | <0.001 |
| Lack of SWE signal‡ | 14 (4.0) | 27 (8.3) | 45 (19.0) | 65 (28.1) | 12 (11.1) | 2 (3.9) | 0.010 |
Two sonographers who imaged 6 nodules were combined into a single category to increase the sample size;
Test for the presence of variability in artifact rates between sonographers based on a mixed model;
Artifact not explained by presence of any of the above anatomic, nodule or operator-dependent factors.
DISCUSSION
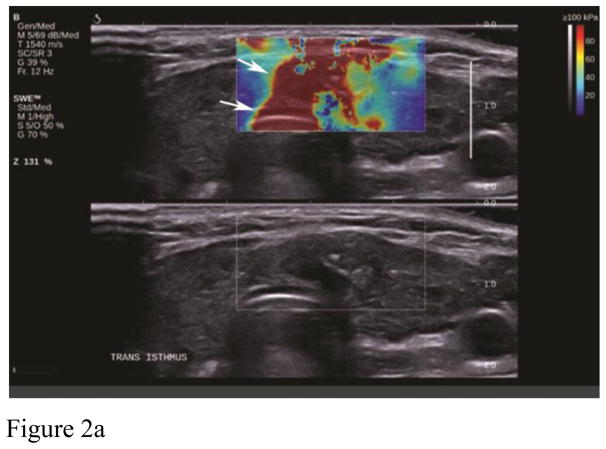
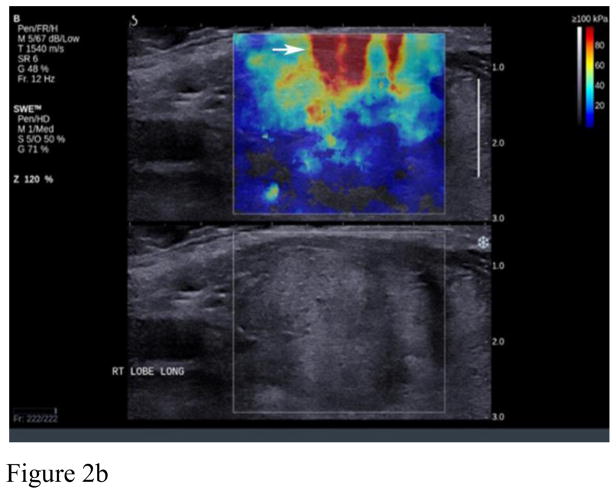
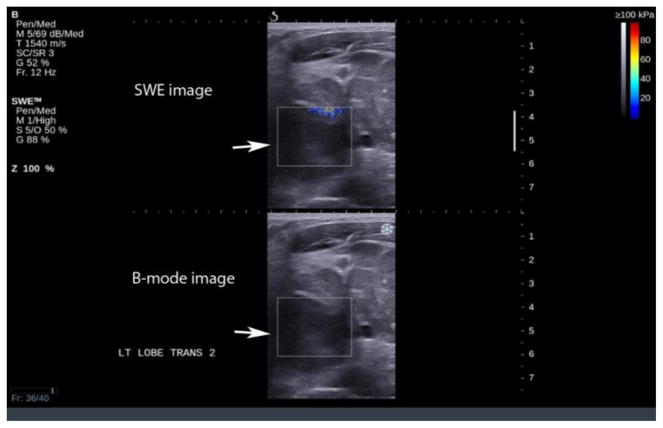
Artifacts are commonly seen in SWE imaging of thyroid nodules and were found in 70% of our images in retrospective analysis. The most common artifact seen in our study database (36.5% of cases) was the over compression artifact from operator error (Figure 2). Much less probe pressure on the skin surface is required than typically used in conventional ultrasound scanning. The weight of the transducer and the sonographer’s hand can easily over-compress superficial and thyroid tissue resulting in over-compression artifacts and bias of nodule stiffness measurements. Recognition of this artifact is important since it can be avoided by use of a thick layer of gel or a standoff pad, especially when the nodule is located in the isthmus. The superficial location of the thyroid and compression of this gland against the hard trachea make this region of thyroid especially susceptible to over compression artifacts. On the other hand, inadequate compression may result in poor quality elastograms in the far field (Figure 3). Since SWE in thyroid nodules is performed with a linear high frequency transducer, reliable measurements on SWE were obtained with depths up to 4–5 cm. Deeper tissues beyond 4–5 cm were affected by attenuation either diminishing the ability to generate an effective push or the ability to image and track the shear wave displacements. This was seen in approximately 14.3% of our cases. Generally, if the Bmode image of the nodule is weak or has some amount of noise in it, the SWE acquisition will not be successful. Lack of SWE signal in the images could also be due to inadequate time in between acquisition and acquiring the image. This leads to inadequate accumulation of the signal on SWE images and hence a poor quality of the image. This could be thought of as an operator error or a lack of SWE information in the nodule.
Figure 2.
Example of artifacts from compression. A. shows the area of high stiffness (red) extend through the whole image (arrows) and hence recognizable as an artifact. B. shows the characteristic “finger-like” projections seen from compression artifact (arrow).
Figure 3.
Lack of SWE information in a deep nodule (arrow), note the lack of elastography information in the nodule due to its deep location.
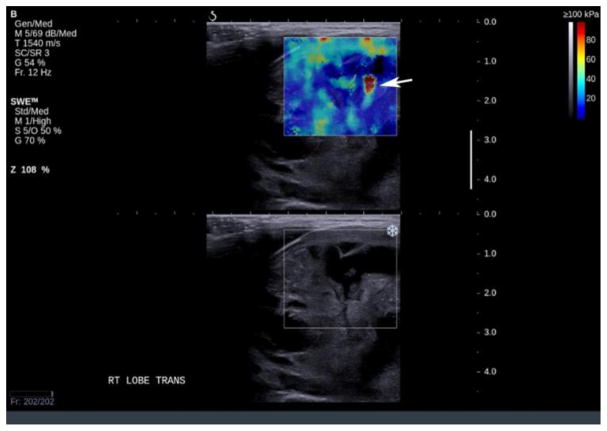
Nodule composition can lead to artifacts as well. In our study, artifacts around cystic portions in nodules was seen in 9.3% of cases. It has been hypothesized that the elevation in stiffness of benign lesions with cystic components could be attributed to the pressure exerted by the liquid compartment (Bhatia, et al. 2011). As a result, cystic components creating areas of elevated stiffness within nodules limits the utility of mean and maximum lesion elasticity for differentiation. However, if this the only feature of the nodule of concern, FNA can likely be avoided in this nodule, as the elevation in lesion stiffness is associated with the cyst and not the solid component of the lesion (Bhatia, et al. 2011). Cystic regions should be avoided when measuring stiffness because they can lead to an artifactually high stiffness assessment. In our experience with cases such as this, the region of interest to assess stiffness should be placed lateral or superficial, but not posterior, to the cystic area (Figure 4).
Figure 4.
Typical BGR artifact seen in a partially cystic nodule – the artifact appears as an area of high stiffness distal to the cystic part of the nodule (arrow). Recognition of this artifact is important since measurement of stiffness in this region will lead to an artefactual stiff assessment.
We found artifacts due to rim calcification or macro-calcification in 3.3% of our cases (Figure 5). Rim calcifications can shadow underlying tissue, making SWE assessment of the nodule distal to the calcifications difficult or impossible. (Hong, et al., Lyshchik, et al. 2005, Rago, et al.) Szczepanek-Parulska et al found benign lesions with micro or macro-calcifications were stiffer than benign lesions without calcifications, complicating the use of maximal SWE stiffness to discriminate benign and malignant lesions (Szczepanek-Parulska, et al.). Similar confounding observations of benign lesions with calcifications appearing stiffer have been observed using strain-based elastography approaches. Asteria et al found in their study that macro-calcifications can increase stiffness in the nodule and make benign nodules appear “stiff” (Asteria, et al. 2008). Volander et al reported that thyroid lesions with coarse calcifications are not a suitable group for elastographic evaluation due to false positive results (Vorländer, et al. 2010). In our experience, macro and micro calcifications can make a nodule stiffer than a nodule with similar pathology without these findings. Exclusion of malignancy in these case is at present difficult with Bmode features only and further work on usefulness of elastography in differentiating between these lesions is required.
Figure 5.
Artifact due to macrocalcification, note the lack of elastography (double arrows) information behind the area of macrocalcification (arrow) which is due to lack of transmission of sound waves beyond the dense calcification.
Nodule location relative to surrounding structures can create artifacts within a nodule on SWE elastography. A nodule near (generally less than 1cm) the carotid artery may have a motion artifact within it due to tissue displacements generated from carotid artery pulsation. SWE relies on Doppler -like processing to detect tissue displacements created by the passing shear wave. Lyschik et al in their study found that the quality of strain images and the resulting diagnostic performance was significantly affected by pulsation of the carotid artery, adjacent to the thyroid (Lyshchik, et al. 2005).
Limitations of our study include the retrospective study design with an inability to correct for these artifacts by changing the technique of acquiring the images. Although this study was performed by experienced ultrasound users, this study was their first formal use of SWE. As a result, this study results represents a typical lab’s first experience with SWE, where a proportion of operator error would decrease over time. In addition, we are limited by the lack of phantom studies to guide us in the actual cause of these artifacts. In the future, we plan to study these artifacts with phantom studies to understand the reason for some of the artifacts and develop techniques to avoid these artifacts. In addition, knowledge from this and other studies on artifacts can be used to investigate how training and education could reduce the occurrence of artifacts, be able to advise manufacturers on how they can improve the product design, provide quality indicators and other ways to assist scanning using Shear-wave elastography technique. Information from such studies can also help evaluate other factors that could impact diagnosis including repeatability and reproducibility.
CONCLUSIONS
Our study indicates that different types of artifacts are commonly present in elastography images. Operator error was the most common type of artifact that we experienced. This should be correctable by adequate knowledge and recognition with subsequent correction of the artifact. However, this study is solely based on the investigation with one ultrasound system (SuperSonic Imagine’s Aixplorer) and the results may vary with other systems and systems from other manufacturers. Recognition of the artifacts in the images on thyroid elastography can help in avoidance of these artifacts and accurate evaluation of thyroid nodules.
Acknowledgments
This study was funded by NIH R21CA164112 from August 2012 to July 2015.
Footnotes
Publisher's Disclaimer: This is a PDF file of an unedited manuscript that has been accepted for publication. As a service to our customers we are providing this early version of the manuscript. The manuscript will undergo copyediting, typesetting, and review of the resulting proof before it is published in its final citable form. Please note that during the production process errors may be discovered which could affect the content, and all legal disclaimers that apply to the journal pertain.
Contributor Information
Manjiri Dighe, University of Washington, Department of Radiology.
Daniel S. Hippe, University of Washington, Department of Radiology.
Jeff Thiel, University of Washington, Department of Radiology.
References
- Andrioli M, Persani L. Elastographic techniques of thyroid gland: current status. Endocrine. 2014;46:455–61. doi: 10.1007/s12020-014-0178-1. [DOI] [PubMed] [Google Scholar]
- Asteria C, Giovanardi A, Pizzocaro A, Cozzaglio L, Morabito A, Somalvico F, Zoppo A. US-elastography in the differential diagnosis of benign and malignant thyroid nodules. Thyroid. 2008;18:523–31. doi: 10.1089/thy.2007.0323. [DOI] [PubMed] [Google Scholar]
- Bates D, Maechler M, Bolker B, Walker S. Fitting linear mixed-effects models using lme4. Journal of Statistical Software. 2015;67:1–48. [Google Scholar]
- Bhatia KS, Rasalkar DP, Lee YP, Wong KT, King AD, Yuen HY, Ahuja AT. Cystic change in thyroid nodules: a confounding factor for real-time qualitative thyroid ultrasound elastography. Clin Radiol. 2011;66:799–807. doi: 10.1016/j.crad.2011.03.011. [DOI] [PubMed] [Google Scholar]
- Frates MC, Benson CB, Charboneau JW, Cibas ES, Clark OH, Coleman BG, Cronan JJ, Doubilet PM, Evans DB, Goellner JR, Hay ID, Hertzberg BS, Intenzo CM, Jeffrey RB, Langer JE, Larsen PR, Mandel SJ, Middleton WD, Reading CC, Sherman SI, Tessler FN Society of Radiologists in U. Management of thyroid nodules detected at US: Society of Radiologists in Ultrasound consensus conference statement. Radiology. 2005;237:794–800. doi: 10.1148/radiol.2373050220. [DOI] [PubMed] [Google Scholar]
- Hong Y, Liu X, Li Z, Zhang X, Chen M, Luo Z. Real-time ultrasound elastography in the differential diagnosis of benign and malignant thyroid nodules. J Ultrasound Med. 2009;28:861–7. doi: 10.7863/jum.2009.28.7.861. [DOI] [PubMed] [Google Scholar]
- Kim JK, Baek JH, Lee JH, Kim JL, Ha EJ, Kim TY, Bae Kim W, Shong YK. Ultrasound elastography for thyroid nodules: a reliable study? Ultrasound in medicine & biology. 2012;38:1508–13. doi: 10.1016/j.ultrasmedbio.2012.05.017. [DOI] [PubMed] [Google Scholar]
- Lim DJ, Luo S, Kim MH, Ko SH, Kim Y. Interobserver agreement and intraobserver reproducibility in thyroid ultrasound elastography. AJR Am J Roentgenol. 2012;198:896–901. doi: 10.2214/AJR.11.7009. [DOI] [PubMed] [Google Scholar]
- Lyshchik A, Higashi T, Asato R, Tanaka S, Ito J, Hiraoka M, Brill AB, Saga T, Togashi K. Elastic moduli of thyroid tissues under compression. Ultrason Imaging. 2005;27:101–10. doi: 10.1177/016173460502700204. [DOI] [PubMed] [Google Scholar]
- Lyshchik A, Higashi T, Asato R, Tanaka S, Ito J, Mai J, Pellot-Barakat C, Insana M, Brill A, Saga T, Hiraoka M, Togashi K. Thyroid gland tumor diagnosis at US elastography. Radiology. 2005;237:202–11. doi: 10.1148/radiol.2363041248. [DOI] [PubMed] [Google Scholar]
- Rago T, Santini F, Scutari M, Pinchera A, Vitti P. Elastography: new developments in ultrasound for predicting malignancy in thyroid nodules. J Clin Endocrinol Metab. 2007;92:2917–22. doi: 10.1210/jc.2007-0641. [DOI] [PubMed] [Google Scholar]
- Szczepanek-Parulska E, Woliński K, Stangierski A, Gurgul E, Ruchała M. Biochemical and ultrasonographic parameters influencing thyroid nodules elasticity. Endocrine. 2014;47:519–27. doi: 10.1007/s12020-014-0197-y. [DOI] [PubMed] [Google Scholar]
- Vorländer C, Wolff J, Saalabian S, Lienenlüke RH, Wahl RA. Real-time ultrasound elastography--a noninvasive diagnostic procedure for evaluating dominant thyroid nodules. Langenbecks Arch Surg. 2010;395:865–71. doi: 10.1007/s00423-010-0685-3. [DOI] [PubMed] [Google Scholar]


