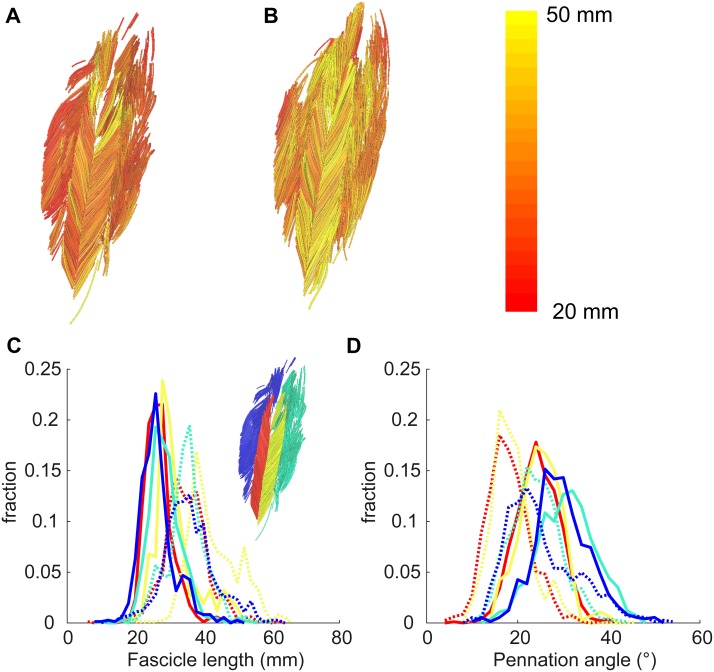
Figure 4. Example of 3D reconstruction and muscle architecture measurements.
Anterior view of the soleus muscle of one subject with the muscle at a short (A) and a long length (B). Fascicles are coloured according to their length. Distribution of (C) fascicle lengths (bin size = 2 mm) and (D) pennation angle (bin size = 2°) for all four compartments (same colours as in Fig. 1; see also inset in C). The solid and dashed lines present measurements obtained at the short and long muscle length, respectively. Fraction, fraction of total number of successfully reconstructed fascicles.

