

Abstract
Purpose
To help rein in surgical spending, there is growing interest in the application of payment bundles to common outpatient procedures like ureteroscopy (URS) and shockwave lithotripsy (SWL). However, before urologists can move to such a payment system, they need to know where their episode costs are concentrated.
Materials and Methods
Using claims data from the Michigan Value Collaborative, we identified patients who underwent URS or SWL at hospitals in Michigan (2012 to 2015). We then totaled expenditures for all relevant services during these patients’ 30-day surgical episodes and categorized component payments [i.e., those for the index procedure, subsequent hospitalizations, professional services, and post-acute care (PAC)]. Finally, we quantified variation in total episode expenditures for URS and SWL across hospitals, examining drivers of this variation.
Results
In total, 9,449 URS and 6,446 SWL procedures were performed at 62 hospitals. Among these hospitals, there was three-fold variation in URS and SWL spending. The index procedure accounted for the largest payment difference between high- and low-cost hospitals (URS: $7,936 vs. $4,995, P<0.01; SWL: $4,832 vs. $3,207, P<0.01), followed by payments for PAC (URS: $2,207 vs. $1,711, P<0.01; SWL: $2,138 vs. $1,104, P<0.01). The index procedure explained 68% and 44%, and PAC payments explained 15% and 28% of the variation in episode spending for URS and SWL, respectively, across hospitals.
Conclusions
There exists substantial variation in ambulatory surgical spending across Michigan hospitals for urinary stone episodes, most of which can be explained by payment differences for the index procedure and PAC services.
Introduction
With treatment-related expenditures in excess of $2 billion annually, urinary stone disease ranks as the second most costly urologic condition in the United States.1 The disease’s high costs are due, in large part, to surgery for its management.2 Thus, efforts to rein in spending for urinary stone disease must include a focus on surgical care. One approach that may produce savings is payment bundling, whereby providers are paid a single payment for all services rendered to a patient during a pre-specified episode of care, including readmissions, emergency department care, and other post-acute care (PAC) such as home nursing.3 By making providers responsible for costs that exceed the pre-arranged episode reimbursement, bundled payments encourage more cost-effective healthcare decisions.
Before urologists can move towards an episode-based payment system for urinary stone surgery, they will require additional information from several sources. This includes billing and cost accounting data for not only their index procedure, but also for the care delivered by other service providers during the surgical episode. This information will help urologists benchmark their performance. Further, it will give them a better understanding of where their episode costs are concentrated. Such an understanding is essential for urologists to determine where cost reduction opportunities are likely to be found and which partnerships are most important to them.
In this context, we used claims data to identify patients who underwent ambulatory surgery for urinary stone disease at hospitals in Michigan. After defining surgical episodes, we totaled expenditures for all relevant services during these episodes. We then categorized component payments for the index procedure, professional services, subsequent hospitalizations, and PAC. Finally, we quantified the variation in total episode expenditures across hospitals where procedures for urinary stones were performed and examined drivers of this variation. Findings from our study serve to inform policymakers about the design and implementation of payment bundles for urinary stone surgery.
Methods
Data sources and study population
Our study was based on data from the Michigan Value Collaborative (MVC)4. Funded by Blue Cross Blue Shield of Michigan (BCBSM), MVC is a quality improvement initiative whose goal is to enhance the quality and efficiency of healthcare delivery in Michigan. MVC collects complete inpatient and outpatient medical claims from residents enrolled in Medicare fee-for-service or by BCBSM’s preferred provider organization. From claims filed between 2012 and 2015, we used International Classification of Diseases (56.0, 56.31, 98.51, 0TF6XZZ, 0TF7XZZ, 0TF3XZZ, 0TF4XZZ, 0TF38ZZ, 0TF48ZZ, 0TF68ZZ, 0TF78ZZ, 0TF37ZZ, 0TF47ZZ, 0TF67ZZ, and 0TF77ZZ) and Current Procedural Terminology codes (50590, 52320, 52352, 52353, 52325, and 52356) to identify patients with urinary stone disease who underwent ureteroscopy (URS) or shockwave lithotripsy (SWL) at an MVC-participating hospital.
Measuring total episode expenditures and component payments
To measure total episode expenditures, we extracted payments for all services from the date of a patient’s surgery to 30 days following discharge. We chose a 30-day window given prior empirical work suggesting that spending tends to drop to near patients’ baseline approximately four weeks after URS and SWL.5 Using a validated claims-based attribution method,6 we decomposed total episode expenditures into four components: 1) payments for the index procedure, 2) subsequent hospitalizations, 3) professional services, and 4) post-acute care (PAC). Berenson-Eggers Type of Service codes were used to subcategorize payments for professional services.7 Index procedure payments include index facility base and outlier payments for services rendered on the date of surgery. Professional services payments include, among others, evaluation and management payments for office and hospital outpatient department visits and consultations, surgeon and anesthesia professional fees, and payments for imaging and laboratory test interpretation. We further subdivided PAC payments based on where the care was delivered and the type of service.
We performed price standardization, applying methods used by the Medicare Payment Advisory Commission because provider differences in total episode expenditures and component payments for URS and SWL may be confounded by differences in contractual provider-payer reimbursement and regional pricing.8 Specifically, we assigned a standardized payment amount to each service that reflects the average payment for that service in Michigan Medicare data. We also risk-adjusted all payments to control for differences between providers with regards to their patients’ age, comorbidity (using hierarchical condition categories9), procedure acuity, and high prior 30-day healthcare spending.
Statistical analysis
For our initial analytic step, we aggregated 30-day total episode expenditures to the hospital level by procedure type. To ensure stability in our point estimates, we required that at least 10 URS and 10 SWL procedures were performed at a hospital over the study interval for its inclusion. After ranking hospitals from lowest to highest by their average total episode expenditures for both URS and SWL, we calculated the variation in spending for stone surgery across hospitals. We also evaluated whether a hospital’s rank for average total episode expenditures was stable from year to year and the extent to which its rank for URS correlated with its rank for SWL.
Next, we sorted hospitals into four equally-sized groups, or quartiles, of spending for stone surgery, and we used parametric and non-parametric tests, where appropriate, to compare hospitals in the highest and lowest spending quartiles. Specifically, we examined differences in average total episode expenditures, as well as differences in the means for each of the four component payment categories, by procedure type. We then determined which component payment category contributed the most to the variation in spending for stone surgery across hospitals, and quantified the amount of the variation explained by each component category.
Finally, given growing interest among payers in unplanned hospital utilization following ambulatory surgery, especially emergency department (ED) visits,10 we assessed the overall rate of ED visits after URS and SWL. For patients with PAC related to a postoperative ED visit, we evaluated how the occurrence of an ED visit affected average total episode expenditures. We then compared mean ED visit payments for hospitals in the highest and lowest quartiles of mean total episode expenditures for URS and SWL.
We performed all analyses using SAS software Version 9.4 (Cary, NC). Tests were two-tailed, and we set the probability of Type 1 error at 0.05. The Health Sciences Institutional Review Board of the University of Michigan deemed this study to be exempt from its oversight.
Results
In total, 9,449 URS and 6,446 SWL procedures were performed at 62 hospitals in Michigan over the study interval. The mean 30-day total episode expenditures for URS were significantly higher than those for SWL {$11,504 [standard deviation (SD), $1,797] vs. $7,668 [SD, $1,556], respectively, P<0.01}. In Figure 1, hospitals are ranked from lowest to highest in terms of their mean 30-day total episode expenditures for URS (panel A) and SWL (B). There was a three-fold variation in spending on ambulatory stone surgery across providers. A hospital’s spending rank varied from year to year (e.g., the rank correlation, as measured by r2, for a hospital’s mean total URS episode expenditures was only 0.33 between 2013 and 2014). In addition, a hospital’s spending rank for URS was not strongly correlated with its rank for SWL (r2=0.47).
Figure 1.
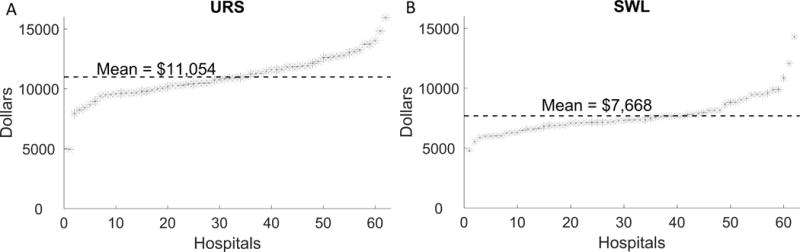
Hospitals ranked according to mean total spending during the study interval for ureteroscopy (A) and shockwave lithotripsy (B).
Figure 2A compares payments for component categories between hospitals in the lowest and highest spending quartiles, stratified by procedure type. For both URS and SWL, payments related to the index procedure, professional services, and PAC were significantly higher at the highest quartile hospitals. When SWL was performed, payments for subsequent hospitalizations were also higher at the highest quartile hospitals. The index procedure accounted for the largest difference in payments between the highest and lowest quartile hospitals (URS: $7,936 vs. $4,995, P<0.01; SWL: $4,832 vs. $3,207, P<0.01), followed by payments for PAC (URS: $2,207 vs. $1,711, P<0.01; SWL: $2,138 vs. $1,104, P<0.01). The index procedure explained 68% and 44%, and PAC payments explained 15% and 28% of the variation in total episode expenditures for URS and SWL, respectively, between highest and lowest quartile hospitals (Figure 2B).
Figure 2.
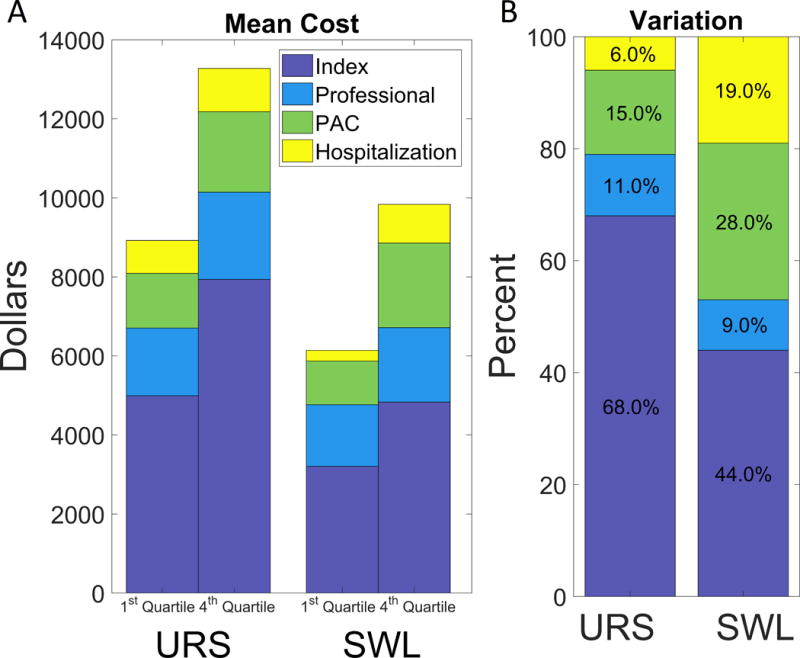
(A) Mean spending for the lowest and highest quartile hospitals by procedure type divided into the four component categories (index procedure, professional services, post-acute care, and subsequent hospitalization). (B) Percent variation attributable to each subcategory by procedure type.
As shown in Table 1, differences in PAC payments between the highest and lowest quartile hospitals for URS were driven by spending on rehabilitation services ($90 vs. $8, P=0.01) and skilled nursing facilities ($338 vs. $157, P=0.03). For SWL, payments for durable medical equipment ($33 vs. $12, P=0.01) and procedural care ($1,000 vs. $598, P=0.04) underlie differences in PAC payments. While mean 30-day total episode expenditures for URS and SWL are significantly higher when a postoperative ED visit occurs [URS: $15,958 (SD, $8,792) with an ED visit vs. $10,037 (SD, $6,291) without an ED visit, P<0.01; SWL: $12,960 (SD, $8,480) vs. $6,977 (SD, $4,137), P<0.01], neither rates of postoperative ED visit nor payments for postoperative ED care differed between the highest and lowest quartile hospitals.
Table 1.
Breakdown of post-acute care payment subcategories by procedure type.
| URS | SWL | |||||||
|---|---|---|---|---|---|---|---|---|
| Lowest-Cost Hospitals (dollars) |
Highest-Cost Hospitals (dollars) |
Difference (dollars) |
P-value | Lowest-Cost Hospitals (dollars) |
Highest-Cost Hospitals (dollars) |
Difference (dollars) |
P-value | |
| Home health | 82 | 123 | 41 | 0.14 | 17 | 36 | 19 | 0.09 |
| Imaging | 88 | 89 | 1 | 0.91 | 103 | 141 | 38 | 0.08 |
| Procedures | 482 | 576 | 94 | 0.35 | 598 | 1000 | 402 | 0.04 |
| Rehabilitation | 8 | 90 | 81 | 0.01 | 14 | 17 | 4 | 0.81 |
| Emergency department | 251 | 326 | 75 | 0.37 | 190 | 174 | −16 | 0.73 |
| E&M visits | 13 | 11 | −2 | 0.52 | 9 | 16 | 7 | 0.24 |
| Laboratories and tests | 32 | 38 | 6 | 0.23 | 29 | 32 | 3 | 0.62 |
| Ambulance or transportation | 4 | 18 | 15 | 0.26 | 0 | 8 | 8 | 0.35 |
| SNF | 157 | 338 | 181 | 0.03 | 4 | 53 | 49 | 0.1 |
| Other medications | 68 | 42 | −26 | 0.38 | 22 | 40 | 18 | 0.1 |
| Durable medical equipment | 26 | 28 | 2 | 0.67 | 12 | 33 | 22 | 0.01 |
| Other | 199 | 349 | 150 | 0.01 | 138 | 530 | 392 | < .01 |
Abbreviation: E&M, evaluation and management; SNF, skilled nursing facility; SWL, shockwave lithotripsy; URS, ureteroscopy.
Discussion
Our study has three principal findings. First, there exists substantial variation in ambulatory surgical spending across Michigan hospitals for urinary stone episodes. Second, most of the variation in between low- and high-cost providers can be explained by differences for the index procedure and PAC services. Third, while the occurrence of unplanned healthcare encounters like postoperative ED visits add substantially to total episode expenditures, they are not significant drivers of spending variation. Taken together, these findings suggest that efforts to decrease provider variation in spending for the index procedure and PAC are likely to go a long way towards reducing the costs associated with urinary stone care.
Prior empirical work examining the surgical costs of urinary stones is somewhat limited. Investigators from the Urologic Diseases in America Project analyzed administrative data on urinary stone management from a convenience sample of working-age adults with employer-sponsored insurance.2 They found that average procedural-related expenditures for those undergoing ambulatory surgery ranged from $1,426 for URS to $2,295 for SWL. More recently, Scales and colleagues used commercial claims from MarketScan to estimate incremental expenditures attributable to unplanned healthcare encounters following URS and SWL.11 To our knowledge, our study is the first population-based analysis to quantify provider-level variation in surgical spending for urinary stones and its determinants.
The variability between the highest and lowest quartile hospitals in payments for the index procedure may be explained, in part, by higher intensity care delivery. BCBSM and Medicare allow payments for multiple procedures. Although subject to a multiple-procedure discount, an increase in the average number of procedures performed during the same ambulatory stone surgery encounter could contribute to higher index procedure payments. So, too, could the unbundling of procedure billing codes into component procedures. To test whether variation in index procedure payments was driven by care intensity, we conducted an exploratory analysis, comparing the mean number of line items from paid claims on the index procedure date between hospitals. We found that highest quartile hospitals delivered significantly more services.
Our study has several limitations that merit further discussion. First, all analyses based on claims data are subject to the accuracy of medical coding. And while we used established methods to account for case-mix differences between providers, we cannot exclude the possibility of unmeasured confounders between providers’ patient panels, which may help explain some of the observed variation in surgical spending. Second, despite the fact that BCBSM and Medicare insure nearly three-quarters of Michigan residents, our data are from a single state, and the spending patterns that we observed may not be generalizable to the country as a whole.
Despite these limitations, our findings serve to inform policymakers and other stakeholders about possible levers around ambulatory stone surgery that may be pulled to help reduce the costs of urinary stone care. For instance, leaders at the Centers for Medicare and Medicaid Services might consider expanding the Bundled Payments for Care Improvement (BCPI) Initiative to encompass urinary stone surgery. Currently, BPCI has 1,364 participants and includes 48 different episodes.12 Much like urinary stone surgery, the episodes selected for the BCPI thus far have been those that occur in high frequency and have a high associated cost.13 Providers participating in BCPI have seen a decline of $864 in payments for episodes related to lower extremity joint replacement without compromising quality.14
Although there is a fair amount of optimism surrounding bundled payment programs like BPCI for cost savings, their effects on urinary stone care are hard to predict. For example, savings will only occur if the bundled amount is lower than the mean amount currently spent and will also depend on the type of procedures/services that are covered.15 Moreover, implementation of bundled payments could result in no net change in total spending if the savings resulting from the decreased payment to high-cost providers are offset by the loss incurred from paying low cost providers more than what they currently receive. Our work serves as a foundation for future studies to define what to include in a possible urinary stone bundle and where to set the bundle amount.
Conclusions
We have shown that the variation in surgical spending for ambulatory stone surgery between low- and high-cost hospitals in Michigan are largely attributable to differences in spending on the index procedure and PAC. Our findings on the drivers of cost variation serve to inform policymakers for the implementation of value-based purchasing initiatives.
Acknowledgments
Support for the Michigan Value Collaborative is provided by Blue Cross Blue Shield of Michigan as part of the Value Partnerships Program. The opinions, beliefs, and viewpoints expressed by the authors do not necessarily reflect those of Blue Cross Blue Shield of Michigan or any of its employees.
References
- 1.Pearle MS, Calhoun EA, Curhan GC. Urologic Disease in America Project: Urolithiasis. J. Urol. 2005;173:848. doi: 10.1097/01.ju.0000152082.14384.d7. [DOI] [PubMed] [Google Scholar]
- 2.Saigal CS, Joyce G, Timilsina AR, et al. Direct and indirect costs of nephrolithiasis in an employed population: opportunity for disease management? Kidney Int. 2005;68:1808. doi: 10.1111/j.1523-1755.2005.00599.x. [DOI] [PubMed] [Google Scholar]
- 3.Miller HD. From volume to value: better ways to pay for health care. Health Aff (Millwood) 2009;28:1418. doi: 10.1377/hlthaff.28.5.1418. [DOI] [PubMed] [Google Scholar]
- 4.Michigan Value Collaborative (MVC). Available at: http://michiganvalue.org/, accessed June 24, 2017.
- 5.Hollingsworth JM, Saigal CS, Lai JC, et al. Medicare payments for outpatient urological surgery by location of care. J. Urol. 2012;188:2323. doi: 10.1016/j.juro.2012.08.031. [DOI] [PMC free article] [PubMed] [Google Scholar]
- 6.Ellimoottil C, Syrjamaki JD, Voit B, et al. Validation of a claims-based algorithm to characterize episodes-of-care. Am J Manag Care. (In Press) [PubMed] [Google Scholar]
- 7.Centers for Medicare & Medicaid Services: Berenson-Eggers Type of Service (BETOS) Codes, 2014. Available at: https://www.cms.gov/Research-Statistics-Data-and-Systems/Statistics-Trends-and-Reports/MedicareFeeforSvcPartsAB/downloads/betosdesccodes.pdf, accessed June 24, 2017.
- 8.Birkmeyer JD, Gust C, Baser O, et al. Medicare payments for common inpatient procedures: Implications for episode-based payment bundling. Health Serv. Res. 2010;45:1783. doi: 10.1111/j.1475-6773.2010.01150.x. [DOI] [PMC free article] [PubMed] [Google Scholar]
- 9.Centers for Medicare & Medicaid Services: 2013 Model Software/ICD-9-CM Mappings, Available at: https://www.cms.gov/Medicare/Health-Plans/MedicareAdvtgSpecRateStats/Risk-Adjustors-Items/Risk2013.html, accessed August 1, 2015.
- 10.Centers for Medicare & Medicaid: Hospital Quality Initiative, Available at: https://www.cms.gov/Medicare/Quality-Initiatives-Patient-Assessment-Instruments/HospitalQualityInits/Downloads/Hospital-Visits-after-Hospital-Outpatient-Surgery-Measure.pdf, accessed June 24, 2017.
- 11.Scales CD, Jr, Saigal CS, Hanley JM, et al. The impact of unplanned postprocedure visits in the management of patients with urinary stones. Surgery. 2014;155:769. doi: 10.1016/j.surg.2013.12.013. [DOI] [PMC free article] [PubMed] [Google Scholar]
- 12.Centers for Medicare & Medicaid Services: Bundled Payments for Care Improvement (BPCI) Initiative: General Information | Center for Medicare & Medicaid Innovation, Available at: https://innovation.cms.gov/initiatives/bundled-payments/, accessed May 23, 2017.
- 13.Herrel LA, Syrjamaki JD, Linsell SM, et al. Identifying drivers of episode cost variation with radical prostatectomy. Urology. 2016;97:105. doi: 10.1016/j.urology.2016.05.071. [DOI] [PubMed] [Google Scholar]
- 14.Mulvany C. BCPI year two report findings and implications. Healthc Financ Manage. 2016;70:36. [PubMed] [Google Scholar]
- 15.Miller DC, Gust C, Dimick JB, et al. Large variations in Medicare payments for surgery highlight savings potential from bundled payment programs. Health Aff (Millwood) 2011;30:2107. doi: 10.1377/hlthaff.2011.0783. [DOI] [PMC free article] [PubMed] [Google Scholar]