

Abstract
One of the most widely used measures of psychosis-related symptoms and characteristics is the 74-item Schizotypal Personality Questionnaire (SPQ). Using multidimensional Item Response Theory (bifactor 2-parameter model), we calibrated SPQ items in a sample of 375 youths aged 9-24 years and constructed a fully functional computerized adaptive form of the SPQ on an open-source platform for public use. To assess validity, we used the above parameters to simulate CAT sessions in a separate validation sample (N = 100) using three test-length-based stopping rules: 8 items, 16 items, and 32 items. Those scores were then compared to full-form and SPQ-Brief scores on their abilities to predict psychosis or clinical risk status. Areas under the receiver operating characteristic curves indicated mediocre predictive ability, but did not differ among any of the forms, even when only eight adaptive items were administered. The Youden index for the 16-item adaptive version was higher than that for the 22-item SPQ-Brief. Classification accuracy for the full SPQ was 73% compared to 66% for the both the SPQ-Brief and adaptive versions (average of three stopping rules). The SPQ-CAT shows promise as a much shorter but valid assessment of schizotypy which can save time with minimal loss of information.
Keywords: Schizotypal Personality Questionnaire, Schizotypy, Item Response Theory, Computerized Adaptive Testing, Psychosis
1. Introduction
Considerable efforts have aimed to assess clinical characteristics reflecting risk for schizophrenia and other psychotic disorders. The term “schizotype” was originally coined by (Rado, 1953), who described schizotypy as one of the possible phenotypic outcomes of a common schizophrenia diathesis. Meehl (1962, 1990) later extended this construct into a highly influential model of the pathogenesis of schizophrenia positing schizotypy as the personality and psychological organization developed by individuals with a latent genetic predisposition to schizophrenia. Schizotypy can be manifested in both biobehavioral (neurocognitive, psychophysiological and physiological) phenotypes, and in clinical symptoms, such as subtle thought disorder and perceptual aberrations. While schizotypal features and psychotic like experiences may be distinct clinical indicators of an underlying liability for psychosis spectrum disorders (Lenzenweger, 2015), cross-sectionally assessed schizotypal features in young people may be associated with early, prodromal stages of psychosis or schizophrenia (Debbané et al., 2015; Fonseca Pedrero and Debbané, 2017). Thus, schizotypy instruments have increasingly been used to screen young people who may be at risk for developing psychosis (Cicero et al., 2014), as well as to investigate behavioral, neurophysiological and genetic concomitants of the psychosis spectrum in various populations (Ettinger et al., 2014). To this end, brief, computerized, reliable and valid measures are imperative for large-scale investigations of the psychosis spectrum in community and population samples. Moreover, such tools would be well suited for clinical settings, where access to rapid screening could facilitate early identification and intervention for at-risk youths (Chisolm et al., 2009; Kline and Schiffman, 2014; Michel et al., 2014).
The Schizotypal Personality Questionnaire (SPQ) (Raine, 1991) is a widely used and well validated 74-item paper and pencil measure originally designed to assess multi-dimensional characteristics of schizotypal personality disorder as defined by the DSM-III-R (Peskin and Raine, 2010). More than 500 published studies to date have used the SPQ to investigate clinical, neural, cognitive, and genetic aspects of schizotypy. International interest in the SPQ has resulted in its translation from English into numerous languages including Arabic, Chinese, French, German and Greek. To enhance its utility, Raine and Benishay (1995) developed an abbreviated form of the SPQ, the 22-item SPQ-B using four independent samples, which demonstrated good internal consistency and criterion validity. Although brief and psychometrically sound, the choice of items on a short form will always be fixed, making it sub-optimal for some individuals in the population. Conversely, computerized adaptive testing (CAT) (Wainer et al., 2000), which is a method of test administration in which item presentation proceeds in such a way as to maximize the information gained from each item, has the advantage of administering only the most informative items. To our knowledge, there is only one published account of an adaptive test for psychosis or schizotypy (Fonseca-Pedrero et al., 2013), which was based on the Spanish-language OVIEDO Schizotypy Assessment Questionnaire (ESQUIZO-Q) and has a large calibration sample size. Although suggestive, primary limitations of the adaptive ESQUIZO-Q hampering wider scale utility are that it was simulated and does not yet have a functional version on any known platform, and that the English-language version of the ESQUIZO-Q has not yet been calibrated or used in any study (Fonseca-Pedrero, personal communication, February 29th, 2016). In addition, while the ESQUIZO-Q 51-item bank was specifically designed for adolescents, and therefore calibrated only among 14- to 18-year-olds, it would be advantageous for the field to have a CAT that is applicable across the wider age range corresponding to onset of subthreshold psychosis symptoms.
1.1 Item Response Theory
The above considerations motivated us to apply item response theory (IRT) (Embretson and Reise, 2000; Lord, 1980) to develop a functional and adaptive version of the SPQ. IRT is a psychometric method for characterizing test or scale items based on various parameters. The two most commonly modeled parameters are discrimination (how precisely the item can place an individual on a trait spectrum) and difficulty. In the case of non-cognitive (clinical and personality) scales, “difficulty” is characterized by the likelihood of endorsement, where the more likely an item is to be endorsed, the “easier” it is. The most widely used IRT model, the 2-parameter model, is described by the following equation.
| (1) |
Where pi(θ) is the probability of endorsement (or a correct response in the case of cognitive testing), ai is the item discrimination, bi is the item difficulty, and θ is the trait level of the person. Graphically, this function is a sigmoidal curve with a lower asymptote at 0 and an upper asymptote at 1. The discrimination parameter determines the slope of the curve at its inflection point, and the difficulty parameter determines where on the x-axis (θ) there is a 0.5 probability of endorsement. A curve shifted far to the left would be an “easy” item because the person could be very low on the trait and still have a 0.5 probability of endorsement; a curve shifted far to the right would be a “difficult” item, because the person would have to be very high on the trait before having a 0.5 probability of endorsement.
Here, because the SPQ is multidimensional (see below; also see Fonseca-Pedrero et al. (2018)), we used multidimensional IRT (MIRT) (Edwards et al., 2014; Reckase, 2009), which models multiple latent dimensions simultaneously. Specifically, we used bifactor modeling (Reise, 2012; Reise et al., 2010), which allows items to load on one general factor (in this case, Schizotypy) and one specific factor (depending on the sub-factor to which it belongs). If a unidimensional IRT model is used on multidimensional data, this can result in biased discrimination parameter estimates (Reise et al., 2011; Reise et al., 2015). An advantage of bifactor modeling is that it allows one to account for such multidimensionality to arrive at optimally estimated item parameters on the general trait of interest (in this case, Schizotypy). Note that bifactor modeling has been applied to the SPQ previously (Preti et al., 2015); however, that analysis was performed on the sub-scales of the SPQ rather than the individual items. Another recent application of the bifactor model to the SPQ (Fonseca-Pedrero et al., 2018) did use item-level data, but allowed items related to Suspiciousness to load on both the Cognitive-Perceptual and Interpersonal deficits factors. Here, our assignment of items to factors was based purely on theory, with no cross-loadings allowed. To further clarify the model used here, Supplemental Figure S1 shows a conceptual representation of a bifactor model in this context. Specifically, each item loads on two factors: 1) a general schizotypy factor, and 2) one sub-factor as determined by theory (during scale-construction). These sub-factors are “Cognitive-Perceptual”, “Social”, and “Disorganized” (Raine, 1991). Here, item parameter estimates on the general factor only were used; the sub-factors were modeled only to ensure unbiased estimation of the item parameters for the general factor.
A key advantage of IRT over classical test theory (Crocker and Algina, 1986) is that its emphasis on the individual items allows a researcher to assess item quality when, for example, deciding whether to include the item on a test or scale. “Quality” in this case means the amount of information the item produces at any given point on the trait continuum, which is a direct function of the item parameters:
| (2) |
Where I(θ) is the information produced by the item, ai is the item discrimination, pi(θ) is the probability of endorsement, and qi(θ) is the probability of non-endorsement. Thus the item produces maximum information at the point where the probability of endorsement and non-endorsement are both exactly 0.5, and information always increases with increasing ai. An implication of this is that an item always provides maximum information at the point where its difficulty is the same as the person’s trait level—i.e. an “easy” item will provide very little information about a person high on the trait, and vice versa. The information function described by Equation 2 allows for one of the most common applications of IRT, computerized adaptive testing.
In CAT, after the first item-administration (and response), a scoring algorithm estimates the examinee’s trait level, and based on this rough estimate, chooses the most appropriate next item to administer, where “most appropriate” is determined by how much information it will provide. After this next item administration (and response), the algorithm now uses both item responses to estimate the examinee’s ability. Then the next most appropriate item is selected, and so on. The test stops when some stopping criterion is met—e.g. when the examinee’s standard error of measurement reaches some lower bound. Please see the Supplement for a worked example of how the algorithm chooses items based on Equations 1 and 2, above.
The purpose of the present study was to build a computerized adaptive version of the SPQ using parameter estimates derived from IRT calibrated SPQ items. We hypothesize that the adaptive SPQ will perform almost as well as the full SPQ in predicting Psychosis Spectrum status in our validation sample.
2. Methods
2.1 Participants
Participants were recruited from the original (T1) Philadelphia Neurodevelopmental Cohort based on psychosis spectrum screening at T1 (Calkins et al., 2015; Calkins et al., 2014). Recruitment for Time 2 (T2) participants in the present study was focused on obtaining longitudinal imaging in youths with and without significant PS symptoms at T1 (Calkins et al., 2017). From the cohort of 9,498 youths age 8-21 at T1, a subsample of participants was enrolled based on the presence or absence of baseline psychosis spectrum symptoms, prior participation in neuroimaging, and current neuroimaging eligibility. They were invited to participate in a Time 2 assessment two years on average following Time 1 if they, were generally physically healthy at TI (no moderate or severe physical conditions requiring multiple procedures and monitoring; see Merikangas et al. (2015)), had completed the neuroimaging protocol >= 18 months previously, and had good quality neuroimaging data (Satterthwaite et al., 2014). To maximize the number of subjects scanned at T2, a subset of participants screening positive for psychosis spectrum symptoms who had not previously completed neuroimaging were also included in the recruitment pool. A total of 512 participants continued to be medically eligible and were enrolled (see Calkins et al. (2017)) for further details), though only N = 475 of these 512 participants had valid SPQ data. After complete description of the study, written informed consent was obtained for participants aged at least 18, and written assent and parental permission were obtained from children aged less than 18 and their parents/legal guardian. All procedures were approved by the University of Pennsylvania and the Children’s Hospital of Philadelphia Institutional Review Boards. As described below, participants were randomly split into separate calibration and validation samples, and their respective demographics are as follows. The calibration sample (N = 375) was 52% female, 45% Caucasian and 45% African-American, with a mean age of 17.1 (SD = 3.2). The validation sample (N = 100) was 51% female, 38% Caucasian and 52% African-American, with a mean age of 17.2 (SD = 3.0). Supplemental Figure S2 shows the distribution of participant ages, by sample type (calibration/validation). The percentages of participants with a psychosis spectrum (clinical risk or psychosis) classification in the calibration and validation samples were 30% and 36%, respectively. The percentages of participants who met diagnostic criteria for threshold psychosis in the calibration and validation samples were 4% and 5%, respectively.
2.2 Measures
The SPQ is a multi-dimensional True/False self-report measure assessing each of the nine major features of schizotypal personality disorder as defined by the DSM (Raine, 1991). The SPQ was computerized locally and self-administered on a laptop computer, proctored by a trained research coordinator. Seven items modeled after the Infrequency Scale of the Personality Research Form (Jackson, 1974) were interspersed among SPQ items to assess random or careless responding (Calkins et al., 2014). Participants were removed from the analysis if they endorsed three or more out of the seven infrequency items, resulting in N = 37 being removed. When completing the SPQ, participants were instructed to refrain from considering episodes when they were under the influence of drugs or alcohol and from periods when they were just falling asleep or awakening. Scores for the total SPQ and SPQ-Brief were “sum scores”—i.e. they were an unweighted linear combination of the SPQ items endorsed in the psychopathological direction.
Participants were separately administered the Structured Interview for Prodromal Syndromes (McGlashan et al., 2001) and a modified version of the Kiddie Schedule for Affective Disorders and Schizophrenia (Kiddie-SADS) (Calkins et al., 2017), conducted by assessors blind to T1 screen status and to SPQ scores. Scale of Prodromal Symptoms ratings and best estimate final categorical diagnoses of psychotic and clinical high risk disorders according to criteria detailed previously were assigned by consensus of >= two doctoral level clinicians with expertise in psychosis (Calkins et al., 2017). These “diagnoses” (psychotic or clinical high-risk) were the classifications used in the tests of validity below.
Item text for the 74-item SPQ can be found in Supplementary Table S1. Cronbach’s alpha for the full SPQ in our sample was 0.95 (0.98 based on tetrachoric correlations). Alpha for the SPQ-Brief was 0.85 (0.91 based on tetrachoric correlations).
2.3 Item Calibration and Validity Analyses
Unless otherwise noted, all analyses described below were performed in IRTPRO 4.0 (Cai et al., 2011) or the psych (Revelle, 2015) or mokken (Van der Ark, 2007) packages in R (Team”, 2015). Three assumptions of IRT are monotonicity, unidimensionality, and local independence. Monotonicity was tested before beginning analyses. Due to the theoretical basis and well-documented empirical evidence for multidimensionality of SPQ data, there was a need to account for said multidimensionality during item calibration. Because the adaptive SPQ described here is designed to assess only a single trait, we accounted for multidimensionality using a bifactor model, which includes a general factor comprising all items. The number of factors to extract was first determined by theory—i.e. three factors, “Cognitive-Perceptual”, “Social”, and “Disorganized” (Raine, 1991)—and due to the fit of this model (see below), the theory-based three-factor solution was retained. Our intentional multidimensional modeling of the SPQ obviated the need to test unidimensionality, but local independence was assessed based on the bifactor solution. Additionally, item fit was assessed using the signed χ2 test (Orlando and Thissen, 2000).
Items were calibrated using a bifactor 2-parameter logistic (2PLM) MIRT model in a random subsample (N = 375) of participants, leaving N = 100 as a validation sample. These parameter estimates (general factor only) were then input to Firestar (Choi, 2009) to simulate CAT sessions in the validation sample (N = 100). The first item was selected based on maximum information at the mean (theta = 0), and the stopping criterion was based on total number of items administered (8, 16, and 32). All other Firestar settings were left as default— namely, the item selection method was maximum posterior weighted information (MPWI) (van der Linden, 1998) and the interim theta estimator was expected a posteriori (EAP) (Bock and Mislevy, 1982). After each simulation (8-, 16-, and 32-item), mean standard error of measurement (SEM) was noted, and for comparison, these SEMs were converted to their Cronbach’s alpha equivalent using α = 1 – SEM2. Note that this conversion is based in classical test theory (CTT) where both α and SEM are at the level of the scale rather than the person, but IRT-based SEM can still be converted in this way, providing a convenient CTT-based equivalent of measurement precision for comparison to established standards (e.g. α > 0.90 is excellent).
To assess one aspect of the validity of score interpretations, the scores of the full SPQ, SPQ-Brief, and three adaptive scores (8 items, 16 items, and 32 items) were used to predict (using logistic regression) psychotic and clinical risk diagnostic status (see “Measures” sub-section above) in the validation sample. Note that the SPQ-Brief scores were obtained by scoring only the 22 SPQ-Brief items from the full 74-item SPQ administration; the SPQ-Brief was not administered separately. The predictive performance of these scores was compared based on sensitivity, specificity, positive predictive value (PPV), negative predictive value (NPV), raw classification accuracy, and the area under the receiver operating characteristic (ROC) curve. Additionally, differences in the ROC curves for the various scores were assessed for statistical significance using the nonparametric DeLong method (DeLong et al., 1988). Finally, intra-class correlations (ICCs) between the full form and the three adaptive forms were calculated.
2.4 CAT Construction for External Use
Because the above analyses were based on CAT simulations, it was not necessary to build a fully functional adaptive version of the SPQ in order to conduct them. However, to encourage the use of the adaptive SPQ, we did construct a publicly available and functional version using the open-source Concerto software (Scalise and Allen, 2015) (http://www.psychometrics.cam.ac.uk/newconcerto). Additional information about how to access the adaptive SPQ, as well as how to manipulate the adaptive algorithm to suit one’s needs, are provided in the supplemental materials.
3. Results
The assumption of monotonicity was confirmed for all items. Table 1 shows the bifactor item parameter estimates (discrimination, intercept, and approximated difficulty). Mean discrimination was 2.19 (range = 0.68 - 3.92) and mean difficulty was 0.68 (range = −0.27 – 1.74). Fit of the model was acceptable (comparative fit index = 0.95; root mean-square error of approximation = 0.026 ± 0.002). Item fit was also excellent, with no items showing significant misfit after controlling for multiple comparisons using the false discovery rate (FDR) (Benjamini and Hochberg, 1995) method1. Tests of local independence revealed some violation of the assumption, with 35% of pairwise χ2 values > 3.0 and 2% of pairwise χ2 values > 10. Figure 1 shows the Test Information Function corresponding to the item parameters described above. Maximum information is achieved at a theta (score) of ~0.75.
Table 1.
Bifactor Model Item Parameter Estimates for the SPQ.
| Item | SPQ Factor | SPQ Sub-Factor | Intercept | ag | ac | as | ad | Difficulty† |
|---|---|---|---|---|---|---|---|---|
| 1 | CogPercep | IdeasRef | −0.91 | 1.28 | 0.25 | 0.42 | ||
| 10 | CogPercep | IdeasRef | 0.29 | 1.32 | −0.02 | −0.13 | ||
| 19 | CogPercep | IdeasRef | −1.62 | 2.22 | −0.12 | 0.58 | ||
| 28 | CogPercep | IdeasRef | −1.27 | 1.90 | 0.77 | 0.48 | ||
| 37 | CogPercep | IdeasRef | −2.65 | 2.40 | 0.70 | 0.88 | ||
| 45 | CogPercep | IdeasRef | −1.99 | 3.03 | −0.31 | 0.57 | ||
| 53 | CogPercep | IdeasRef | −1.71 | 2.47 | −0.71 | 0.55 | ||
| 60 | CogPercep | IdeasRef | −2.30 | 3.49 | 0.28 | 0.59 | ||
| 63 | CogPercep | IdeasRef | −1.73 | 3.87 | −1.29 | 0.39 | ||
| 3 | CogPercep | MagicThink | −2.77 | 1.41 | 1.28 | 1.09 | ||
| 12 | CogPercep | MagicThink | −2.79 | 2.06 | 1.15 | 0.96 | ||
| 21 | CogPercep | MagicThink | −2.27 | 1.86 | 0.65 | 0.87 | ||
| 30 | CogPercep | MagicThink | −2.73 | 1.79 | 1.43 | 0.96 | ||
| 39 | CogPercep | MagicThink | −2.63 | 1.31 | 0.70 | 1.17 | ||
| 47 | CogPercep | MagicThink | −4.89 | 2.41 | 2.34 | 1.30 | ||
| 55 | CogPercep | MagicThink | −4.68 | 2.69 | 1.78 | 1.28 | ||
| 4 | CogPercep | Perceptual | −1.10 | 2.10 | 0.30 | 0.40 | ||
| 13 | CogPercep | Perceptual | −1.86 | 2.57 | 1.08 | 0.57 | ||
| 22 | CogPercep | Perceptual | −3.73 | 2.21 | 0.83 | 1.28 | ||
| 31 | CogPercep | Perceptual | −3.74 | 2.55 | 0.95 | 1.17 | ||
| 40 | CogPercep | Perceptual | −3.60 | 2.36 | 1.11 | 1.16 | ||
| 48 | CogPercep | Perceptual | −3.24 | 2.66 | 0.44 | 1.02 | ||
| 56 | CogPercep | Perceptual | −1.87 | 2.35 | 0.64 | 0.63 | ||
| 61 | CogPercep | Perceptual | −1.32 | 2.19 | 0.71 | 0.46 | ||
| 64 | CogPercep | Perceptual | −2.06 | 2.88 | 0.80 | 0.60 | ||
| 9 | CogPercep | Suspicious | −1.24 | 2.44 | −0.64 | 0.41 | ||
| 18 | CogPercep | Suspicious | −3.49 | 2.70 | 0.04 | 1.09 | ||
| 27 | CogPercep | Suspicious | −0.95 | 2.45 | −0.68 | 0.31 | ||
| 36 | CogPercep | Suspicious | −2.03 | 2.74 | −0.39 | 0.62 | ||
| 44 | CogPercep | Suspicious | −2.00 | 2.36 | 0.06 | 0.69 | ||
| 52 | CogPercep | Suspicious | −0.24 | 1.72 | −0.13 | 0.10 | ||
| 59 | CogPercep | Suspicious | −3.65 | 2.93 | −0.48 | 1.07 | ||
| 65 | CogPercep | Suspicious | −1.11 | 2.02 | −0.25 | 0.42 | ||
| 2 | Social | SocAnxiety | −1.41 | 1.39 | 0.61 | 0.62 | ||
| 11 | Social | SocAnxiety | −2.82 | 1.94 | 1.35 | 0.97 | ||
| 20 | Social | SocAnxiety | −0.75 | 2.12 | 0.59 | 0.27 | ||
| 29 | Social | SocAnxiety | −0.51 | 1.51 | 0.90 | 0.21 | ||
| 38 | Social | SocAnxiety | −0.03 | 2.14 | 1.50 | 0.01 | ||
| 46 | Social | SocAnxiety | −2.04 | 2.55 | 1.65 | 0.59 | ||
| 54 | Social | SocAnxiety | 0.32 | 1.32 | 0.73 | −0.14 | ||
| 71 | Social | SocAnxiety | −1.60 | 2.39 | 1.76 | 0.47 | ||
| 6 | Social | NoFriends | −2.77 | 1.73 | 0.89 | 1.07 | ||
| 15 | Social | NoFriends | −0.67 | 1.96 | 1.30 | 0.23 | ||
| 24 | Social | NoFriends | −1.32 | 1.65 | 1.55 | 0.47 | ||
| 33 | Social | NoFriends | −2.29 | 2.11 | 1.11 | 0.78 | ||
| 41 | Social | NoFriends | −2.86 | 1.79 | 1.02 | 1.07 | ||
| 49 | Social | NoFriends | −1.63 | 0.68 | 0.20 | 0.88 | ||
| 57 | Social | NoFriends | −1.35 | 1.71 | 1.39 | 0.49 | ||
| 62 | Social | NoFriends | −2.52 | 2.09 | 0.37 | 0.93 | ||
| 66 | Social | NoFriends | −3.38 | 2.78 | 1.36 | 0.96 | ||
| 8 | Social | ConstrictAffect | −2.01 | 1.71 | 0.76 | 0.80 | ||
| 17 | Social | ConstrictAffect | −2.05 | 2.07 | 0.79 | 0.73 | ||
| 26 | Social | ConstrictAffect | −4.07 | 1.34 | 0.90 | 1.74 | ||
| 35 | Social | ConstrictAffect | −3.63 | 2.18 | 1.06 | 1.23 | ||
| 43 | Social | ConstrictAffect | −3.46 | 2.19 | 0.86 | 1.19 | ||
| 51 | Social | ConstrictAffect | −2.20 | 1.82 | 1.04 | 0.82 | ||
| 68 | Social | ConstrictAffect | −2.02 | 1.53 | 0.67 | 0.85 | ||
| 73 | Social | ConstrictAffect | 0.09 | 1.56 | 1.14 | −0.03 | ||
| 5 | Disorganized | OddBehav | −2.88 | 3.26 | 3.07 | 0.60 | ||
| 14 | Disorganized | OddBehav | −1.56 | 2.04 | 0.87 | 0.56 | ||
| 23 | Disorganized | OddBehav | −1.99 | 3.92 | 3.46 | 0.36 | ||
| 32 | Disorganized | OddBehav | −4.33 | 3.10 | 2.11 | 1.05 | ||
| 67 | Disorganized | OddBehav | −3.70 | 3.78 | 2.94 | 0.73 | ||
| 70 | Disorganized | OddBehav | −1.33 | 1.86 | 1.55 | 0.45 | ||
| 74 | Disorganized | OddBehav | −3.64 | 2.75 | 0.64 | 1.10 | ||
| 7 | Disorganized | OddSpeech | −1.94 | 2.21 | 0.84 | 0.67 | ||
| 16 | Disorganized | OddSpeech | −0.22 | 1.60 | 0.66 | 0.09 | ||
| 25 | Disorganized | OddSpeech | 0.67 | 1.74 | 0.24 | −0.27 | ||
| 34 | Disorganized | OddSpeech | −1.24 | 1.55 | 0.66 | 0.52 | ||
| 42 | Disorganized | OddSpeech | −3.06 | 2.51 | 0.91 | 0.97 | ||
| 50 | Disorganized | OddSpeech | −1.53 | 2.70 | 1.07 | 0.45 | ||
| 58 | Disorganized | OddSpeech | −0.89 | 1.93 | 0.47 | 0.34 | ||
| 69 | Disorganized | OddSpeech | −1.90 | 2.26 | 0.14 | 0.67 | ||
| 72 | Disorganized 4 | OddSpeech | −2.25 | 2.18 | 0.69 | 0.79 |
Note.
Difficulty parameters are for the General factor and are approximations based on the conversions reported in Cai (2010), Eq. 9; CogPercept = Cognitive-Perceptual; OddBehav = Odd Behavior; SocAnxiety = Social Anxiety; IdeasRef = Ideas of Reference; ag = discrimination parameter for General factor; ac = discrimination parameter for Cognitive-Perceptual factor; as = discrimination parameter for Social factor; ad = discrimination parameter for Disorganized factor.
Figure 1.

Test Information Function for the Full SPQ.
Simulated CAT administration proceeded normally, and the 8-, 16- and 32-item adaptive versions produced average standard errors of measurement (SEMs) of 0.30, 0.22, and 0.17, respectively. These correspond to classical test theory based Cronbach’s alpha values of 0.91, 0.95, and 0.97, respectively. Supplementary document “SPQ_CAT_responses_catR.csv” shows, 1) the progression of simulated adaptive item administrations for the 8-item version administered to the validations sample, 2) examinee responses to the above items, and 3) interim theta estimates as the test progressed.
Table 2 shows the ROC analysis results for the full SPQ, SPQ-Brief, and three adaptive versions with maximum item administration of 8, 16, and 32. For area under the curve (AUC) for the ROCs, the full SPQ had the highest with 0.72, followed by the 32-item adaptive version with 0.70. The two lowest were for the SPQ-Brief and 8-item adaptive version, with 0.68 for both. However, none of these differences was statistically significant. For sensitivity and specificity, a common metric for assessing them is the Youden Index (Youden, 1950) (sensitivity + specificity − 1). The highest value for the Youden Index was for the full SPQ with 0.48, followed by the 32-item adaptive with 0.38. The two lowest Youden indices were for the SPQ-Brief and 8-item adaptive, with 0.34 and 0.32, respectively. For PPV, the highest was for the full SPQ (0.60) and lowest was for 8- and 16-item adaptive (0.51 for both). For NPV, the highest was for the full SPQ and 16-item adaptive (0.85 for both), and lowest was for the 8-item adaptive (0.79). For classification accuracy, the highest was for the full SPQ (0.73) and lowest was for the 8- and 16-item adaptive (0.65 for both). Finally, the conventional logistic regression results (coefficient and odds ratio) replicate the above, with the full SPQ performing best, followed by the 32-item adaptive version. Figure 2 shows the receiver operating characteristic (ROC) curves for the full SPQ, SPQ-Brief, and 16-item adaptive version. As noted in Table 2, all differences among ROC curves were non-significant according to the nonparametric Delong method (DeLong et al., 1988).
Table 2.
ROC Analysis Results for the Full SPQ, SPQ-Brief, and Adaptive SPQ, by Length.
| Full SPQ | SPQ-Brief | 8-Item | Adaptive 16-Item |
32-Item | |
|---|---|---|---|---|---|
| AUC | 0.72 | 0.68 | 0.68 | 0.69 | 0.70 |
| Sensitivity/Specificity | 0.78/0.70 | 0.72/0.62 | 0.72/0.60 | 0.83/0.54 | 0.78/0.60 |
| Youden Index | 0.48 | 0.34 | 0.32 | 0.37 | 0.38 |
| PPV/NPV | 0.60/0.85 | 0.52/0.80 | 0.51/0.79 | 0.51/0.85 | 0.53/0.83 |
| Classification Accuracy | 0.73 | 0.66 | 0.65 | 0.65 | 0.67 |
| LR Coefficient | 0.81 | 0.65 | 0.70 | 0.77 | 0.80 |
| LR Odds Ratio | 2.25 | 1.91 | 2.01 | 2.16 | 2.23 |
Note. AUC = area under the curve; PPV = positive predictive value; NPV = negative predictive value; LR = logistic regression; all logistic regression coefficients are significant at the p< 0.01 level; all differences across forms are statistically non-significant (p > 0.05)
Figure 2.
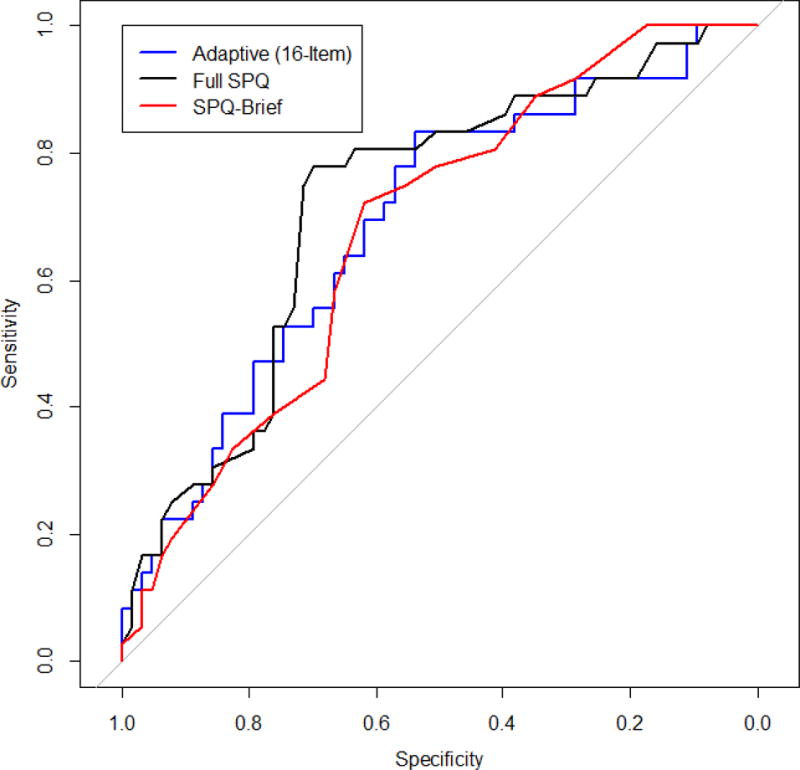
ROC Curves for the Adaptive, Brief, and Full SPQ.
One somewhat surprising finding apparent in Table 2 is that the performance of the adaptive versions does not have a very steep decline with decreasing numbers of items. Even with only 8 items, the AUC remains as high as the 22-item SPQ-Brief. Indeed, the classification accuracy with only 8 items administered adaptively is only 1% lower than for the SPQ-Brief.
Finally, ICCs between the full SPQ and 8-,16-, and 32-item CATs were 0.90, 0.95, and 0.96, respectively. All ICCs were significant at the p < 0.001 level.
4. Discussion
This investigation used item response theory to calibrate SPQ items in a large and diverse sample of community youth, and used those parameter estimates to construct a fully functional computerized adaptive (CAT) form of the SPQ on a free, open-source platform for public use, including collection and storage of the data produced thereby (see Supplement for details). The SPQ-CAT shows promise as a much shorter but about equally valid assessment of overall schizotypal features as the original full form SPQ, and as a practical alternative to the psychometrically derived short form (SPQ-B). CAT has the advantage of administering the most informative items—i.e. items with a high discrimination parameter and for which the test-taker has a 50% probability of an affirmative response. For example, if a person were to respond yes to some of the more extreme SPQ items (e.g. “When you look at a person, or yourself in a mirror, have you ever seen the face change right before your eyes?”), the CAT algorithm obtains maximum information by administering more items around that trait range. This is how the simulated CAT administrations described here were able to achieve such low standard errors (e.g. 0.30 with only eight items). Indeed, with 32 items, the CAT version of the SPQ obtained a Cronbach’s alpha equivalent of 0.97, which is very high. A fixed short-form cannot adapt in this way, and therefore inevitably administers some items that provide almost no information. This limitation is true even if the method used to create the short form involves CAT simulation (Moore et al., 2015; Roalf et al., 2016), because even the best-constructed short-form will not perform as well as a CAT of the same length.
Despite our promising results, several caveats should be noted by investigators considering use of the SPQ-CAT. First, given the relatively limited age range used here, replication in older samples is required for application of the SPQ in participants older than those included here. Second, interpretations of the SPQ-CAT’s predictive ability are necessarily limited to our broad psychosis spectrum category applied to largely non-help seeking community youths. Indeed, note that the AUCs reported here are quite low—i.e. most, even for the full SPQ, are around the minimum conventionally acceptable threshold of 0.70—suggesting that the psychosis spectrum categorization used here as our validity criterion might be sub-optimal. Further investigations are required to assess the adaptive SPQs prediction of more narrowly defined schizotypal groups and help-seeking clinical high-risk groups. Third, the calibration sample size used here (N = 375) is arguably too small for IRT (De Ayala, 2013; Embretson and Reise, 2000). However, others have shown that, when test length is high (many items), smaller sample sizes are necessary for accurate parameter estimation (Harwell and Janosky, 1991; Sahin and Anil, 2017). Fourth, note that the adaptive SPQ, as such, has not been tested/validated here. Items were calibrated, simulated adaptive scores were validated, and a fully functional adaptive SPQ was built, but the adaptive version has not yet been administered in any study. To assess the true reliability and validity of the adaptive SPQ, we plan to administer it in a separate sample along with other relevant validation criteria. Fifth, while the SPQ was originally designed to include three sub-scales, the adaptive SPQ includes only one score—i.e. overall Schizotypy—on a z-score metric, allowing conversion to percentile. Researchers interested in measuring or comparing specific sub-components of schizotypy would be unable to do so using the adaptive SPQ. A future direction for the present work is to expand the CAT SPQ to include sub-scale scores. Finally, it is important to note that CAT itself comes with some unique caveats—e.g. effects of accidental, misunderstood, or random responding are different in CAT compared to a fixed form. See Chang (2015) and Gibbons et al. (2016) for further discussion of the unique characteristics of CAT, including those especially important for clinical applications of CAT.
Overall, the SPQ-CAT shows promise as a publicly available, brief, computerized assessment of schizotypal features. This tool, which will save time with minimal loss of information, potentially has wide applications in research and clinical settings requiring rapid and efficient assessment of the psychosis spectrum. A future direction is to make the adaptive SPQ available not only on desktops and laptops, but also on portable devices. The open-source technology used here will make the above possible in the near future. With further validation in a variety of contexts and settings (Michel et al., 2014), future investigations could increase capacity to comprehensively screen for and detect early psychosis, with the ultimate goal of strengthening pathways to clinical care and reducing lengthy durations of untreated psychosis associated with poorer outcomes (Kline and Schiffman, 2014).
Supplementary Material
Highlights.
A computerized adaptive (CAT) version of the Schizotypal Personality Questionnaire is proposed, calibrated, simulated, and built on an open-source CAT platform for public access. The fully functional adaptive version is not administered in the present study, but adaptive test sessions are simulated.
Even the longest adaptive version explored here (32 items) is only half the length of the full SPQ.
Validity of the adaptive SPQs does not significantly differ from the full form. Areas under receiver operating characteristic curves indicated that both the full and adaptive forms of the SPQ demonstrated only low to moderate ability to predict psychosis spectrum status.
Acknowledgments
This work was supported by NIMH grants MH089983, MH019112, MH096891, the Lifespan Brain Institute (LiBI), and the Dowshen Program for Neuroscience.
Footnotes
Publisher's Disclaimer: This is a PDF file of an unedited manuscript that has been accepted for publication. As a service to our customers we are providing this early version of the manuscript. The manuscript will undergo copyediting, typesetting, and review of the resulting proof before it is published in its final citable form. Please note that during the production process errors may be discovered which could affect the content, and all legal disclaimers that apply to the journal pertain.
Before correction, 8 out of 74 items showed significant misfit.
References
- Benjamini Y, Hochberg Y. Controlling the false discovery rate: A practical and powerful approach to multiple testing. Journal of the Royal Statistical Society Series B. 1995;57:289–300. [Google Scholar]
- Bock RD, Mislevy RJ. Adaptive EAP estimation of ability in a microcomputer environment. Appl Psychol Meas. 1982;6(4):431–444. [Google Scholar]
- Cai L. High-dimensional exploratory item factor analysis by a Metropolis-Hastings Robbins-Monro algorithm. Psychometrika. 2010;75(1):33–57. [Google Scholar]
- Cai L, Thissen D, du Toit SHC. IRTPRO for Windows. Scientific Software International; Lincolnwood, IL: 2011. [Google Scholar]
- Calkins ME, Merikangas KR, Moore TM, Burstein M, Behr MA, Satterthwaite TD, et al. The Philadelphia Neurodevelopmental Cohort: constructing a deep phenotyping collaborative. Journal of Child Psychology and Psychiatry. 2015;56(12):1356–1369. doi: 10.1111/jcpp.12416. [DOI] [PMC free article] [PubMed] [Google Scholar]
- Calkins ME, Moore TM, Merikangas KR, Burstein M, Satterthwaite TD, Bilker WB, et al. The psychosis spectrum in a young U.S. community sample: findings from the Philadelphia Neurodevelopmental Cohort. World Psychiatry. 2014;13(3):296–305. doi: 10.1002/wps.20152. [DOI] [PMC free article] [PubMed] [Google Scholar]
- Calkins ME, Moore TM, Satterthwaite TD, Wolf DH, Turetsky BI, Roalf DR, et al. Persistence of psychosis spectrum symptoms in the Philadelphia Neurodevelopmental Cohort: a prospective two‐year follow‐up. World Psychiatry. 2017;16(1):62–76. doi: 10.1002/wps.20386. [DOI] [PMC free article] [PubMed] [Google Scholar]
- Chang HH. Psychometrics behind computerized adaptive testing. Psychometrika. 2015;80(1):1–20. doi: 10.1007/s11336-014-9401-5. [DOI] [PubMed] [Google Scholar]
- Chisolm DJ, Klima J, Gardner W, Kelleher KJ. Adolescent behavioral risk screening and use of health services. Administration and Policy in Mental Health and Mental Health Services Research. 2009;36(6):374. doi: 10.1007/s10488-009-0245-8. [DOI] [PubMed] [Google Scholar]
- Choi SW. Firestar: Computerized Adaptive Testing Simulation Program for Polytomous Item Response Theory Models. Applied Psychological Measurement. 2009;33(8):644–645. [Google Scholar]
- Cicero DC, Martin EA, Becker TM, Docherty AR, Kerns JG. Correspondence between psychometric and clinical high risk for psychosis in an undergraduate population. Psychol Assess. 2014;26(3):901–915. doi: 10.1037/a0036432. [DOI] [PMC free article] [PubMed] [Google Scholar]
- Crocker L, Algina J. Introduction to Classical and Modern Test Theory. Wadsworth; Belmont, CA: 1986. [Google Scholar]
- De Ayala RJ. The Theory and Practice of Item Response Theory. Guilford Publications; New York: 2013. [Google Scholar]
- Debbané M, Eliez S, Badoud D, Conus P, Flückiger R, Schultze-Lutter F. Developing psychosis and its risk states through the lens of schizotypy. Schizophr Bull. 2015;41(Supplement 2):S396–S407. doi: 10.1093/schbul/sbu176. [DOI] [PMC free article] [PubMed] [Google Scholar]
- DeLong ER, DeLong DM, Clarke-Pearson DL. Comparing the areas under two or more correlated receiver operating characteristic curves: a nonparametric approach. Biometrics. 1988;44(3):837. [PubMed] [Google Scholar]
- Edwards MC, Wirth RJ, Houts CR, Bodine AJ. Three (or four) factors, four (or three) models. In: Reise SP, Revicki D, editors. Handbook of Item Response Theory Modeling. Routledge; New York, NY: 2014. [Google Scholar]
- Embretson SE, Reise SP. Item Response Theory for Psychologists. Psychology Press; New York, NY: 2000. [Google Scholar]
- Ettinger U, Meyhöfer I, Steffens M, Wagner M, Koutsouleris N. Genetics, cognition, and neurobiology of schizotypal personality: a review of the overlap with schizophrenia. Frontiers in Psychiatry. 2014;5 doi: 10.3389/fpsyt.2014.00018. [DOI] [PMC free article] [PubMed] [Google Scholar]
- Fonseca-Pedrero E, Debbané M, Ortuño-Sierra J, Chan R, Cicero D, Zhang L, et al. The structure of schizotypal personality traits: a cross-national study. Psychol Med. 2018;48(3):451–462. doi: 10.1017/S0033291717001829. [DOI] [PubMed] [Google Scholar]
- Fonseca-Pedrero E, Menéndez LF, Paino M, Lemos-Giráldez S, Muñiz J. Development of a computerized adaptive test for schizotypy assessment. PLoS One. 2013;8(9):e73201. doi: 10.1371/journal.pone.0073201. [DOI] [PMC free article] [PubMed] [Google Scholar]
- Fonseca-Pedrero E, Debbané M. Schizotypal traits and psychotic-like experiences during adolescence: An update. Psicothema. 2017;29(1):5–17. doi: 10.7334/psicothema2016.209. [DOI] [PubMed] [Google Scholar]
- Gibbons RD, Weiss DJ, Frank E, Kupfer D. Computerized adaptive diagnosis and testing of mental health disorders. Annu Rev Clin Psychol. 2016;12 doi: 10.1146/annurev-clinpsy-021815-093634. [DOI] [PubMed] [Google Scholar]
- Harwell MR, Janosky JE. An empirical study of the effects of small datasets and varying prior variances on item parameter estimation in BILOG. Appl Psychol Meas. 1991;15(3):279–291. [Google Scholar]
- Jackson DN. Personality Research Form Manual. Research Psychologists Press; Goshen, NY: 1974. [Google Scholar]
- Kline E, Schiffman J. Psychosis risk screening: a systematic review. Schizophrenia Research. 2014;158(1):11–18. doi: 10.1016/j.schres.2014.06.036. [DOI] [PubMed] [Google Scholar]
- Lenzenweger MF. Thinking clearly about schizotypy: hewing to the schizophrenia liability core, considering interesting tangents, and avoiding conceptual quicksand. Schizophr Bull. 2015;41(suppl_2):S483–S491. doi: 10.1093/schbul/sbu184. [DOI] [PMC free article] [PubMed] [Google Scholar]
- Lord FM. Applications of Item Response Theory to Practical Testing Problems. Erlbaum; Hilldale, NJ: 1980. [Google Scholar]
- McGlashan T, Miller T, Woods S, Rosen J, Hoffman R, Davidson L. Structured interview for prodromal syndromes. PRIME Research Clinic, Yale School of Medicine; New Haven, CT: 2001. [Google Scholar]
- Meehl PE. Schizotaxia, schizotypy, schizophrenia. Am Psychol. 1962;17(12):827–838. [Google Scholar]
- Meehl PE. Toward an integrated theory of schizotaxia, schizotypy, and schizophrenia. Journal of Personality Disorders. 1990;4(1):1–99. [Google Scholar]
- Merikangas KR, Calkins ME, Burstein M, He JP, Chiavacci R, Lateef T, et al. Comorbidity of physical and mental disorders in the neurodevelopmental genomics cohort study. Pediatrics. 2015;135(4):e927–e938. doi: 10.1542/peds.2014-1444. [DOI] [PMC free article] [PubMed] [Google Scholar]
- Michel C, Schultze-Lutter F, Schimmelmann BG. Screening instruments in child and adolescent psychiatry: general and methodological considerations. Eur Child Adolesc Psychiatry. 2014;23(9):725–727. doi: 10.1007/s00787-014-0608-x. [DOI] [PubMed] [Google Scholar]
- Moore TM, Scott JC, Reise SP, Port AM, Jackson CT, Ruparel K, et al. Development of an abbreviated form of the Penn Line Orientation Test using large samples and computerized adaptive test simulation. Psychol Assess. 2015;27(3):955–964. doi: 10.1037/pas0000102. [DOI] [PMC free article] [PubMed] [Google Scholar]
- Orlando M, Thissen D. Likelihood-based item-fit indices for dichotomous item response theory models. Appl Psychol Meas. 2000;24(1):50–64. [Google Scholar]
- Peskin M, Raine A. Schizotypal Personality Disorder, The Corsini Encyclopedia of Psychology. John Wiley & Sons, Inc; Hoboken, NJ: 2010. [Google Scholar]
- Preti A, Siddi S, Vellante M, Scanu R, Muratore T, Gabrielli M, et al. Bifactor structure of the Schizotypal Personality Questionnaire (SPQ) Psychiatry Res. 2015;230(3):940–950. doi: 10.1016/j.psychres.2015.11.010. [DOI] [PubMed] [Google Scholar]
- R Core Team. R: A language and environment for statistical computing. R Foundation for Statistical Computing; Vienna, Austria: 2015. [Google Scholar]
- Rado S. Dynamics and classification of disordered behavior. Am J Psychiatry. 1953;110(6):406–416. doi: 10.1176/ajp.110.6.406. [DOI] [PubMed] [Google Scholar]
- Raine A. The SPQ: A Scale for the Assessment of Schizotypal Personality Based on DSM-III-R Criteria. Schizophr Bull. 1991;17(4):555–564. doi: 10.1093/schbul/17.4.555. [DOI] [PubMed] [Google Scholar]
- Raine A, Benishay D. The SPQ-B: A Brief Screening Instrument for Schizotypal Personality Disorder. Journal of Personality Disorders. 1995;9(4):346–355. [Google Scholar]
- Reckase MD. Multidimensional Item Response Theory Models, Multidimensional Item Response Theory. Springer; New York: 2009. pp. 79–112. [Google Scholar]
- Reise S, Moore T, Maydeu-Olivares A. Target rotations and assessing the impact of model violations on the parameters of unidimensional item response theory models. Educ Psychol Meas. 2011;71(4):684–711. [Google Scholar]
- Reise SP. The Rediscovery of Bifactor Measurement Models. Multivariate Behavioral Research. 2012;47(5):667–696. doi: 10.1080/00273171.2012.715555. [DOI] [PMC free article] [PubMed] [Google Scholar]
- Reise SP, Cook KF, Moore TM. Evaluating the impact of multidimensionality on unidimensional Item Response Theory model parameters. In: Reise SP, Revicki D, editors. Handbook of Item Response Theory Modeling. Routledge; New York, NY: 2015. [Google Scholar]
- Reise SP, Moore TM, Haviland MG. Bifactor Models and Rotations: Exploring the Extent to Which Multidimensional Data Yield Univocal Scale Scores. J Pers Assess. 2010;92(6):544–559. doi: 10.1080/00223891.2010.496477. [DOI] [PMC free article] [PubMed] [Google Scholar]
- Revelle W. psych: Procedures for Personality and Psychological Research. 1.5.4. Northwestern University; Evanston, IL USA: 2015. [Google Scholar]
- Roalf DR, Moore TM, Wolk DA, Arnold SE, Mechanic-Hamilton D, Rick J, et al. Defining and validating a short form Montreal Cognitive Assessment (s-MoCA) for use in neurodegenerative disease. J Neurol Neurosurg Psychiatry. 2016 doi: 10.1136/jnnp-2015-312723. jnnp-2015-312723. [DOI] [PMC free article] [PubMed] [Google Scholar]
- Sahin A, Anil D. The effects of test length and sample size on item parameters in item response theory. Educational Sciences: Theory and Practice. 2017;17(1n):321–335. [Google Scholar]
- Satterthwaite TD, Elliott MA, Ruparel K, Loughead J, Prabhakaran K, Calkins ME, et al. Neuroimaging of the Philadelphia Neurodevelopmental Cohort. Neuroimage. 2014;86:544–553. doi: 10.1016/j.neuroimage.2013.07.064. [DOI] [PMC free article] [PubMed] [Google Scholar]
- Scalise K, Allen DD. Use of open-source software for adaptive measurement: Concerto as an R-based computer adaptive development and delivery platform. The British journal of mathematical and statistical psychology. 2015;68(3):478–496. doi: 10.1111/bmsp.12057. [DOI] [PubMed] [Google Scholar]
- Van der Ark LA. Mokken scale analysis in R. Journal of statistical software. 2007;20(11):1–19. [Google Scholar]
- van der Linden WJ. Bayesian item selection criteria for adaptive testing. Psychometrika. 1998;63(2):201–216. doi: 10.1007/s11336-008-9097-5. [DOI] [PMC free article] [PubMed] [Google Scholar]
- Wainer H, Dorans NJ, Eignor D, Flaugher R, Green BF, Mislevy RJ, et al. Computerized Adaptive Testing: A Primer. 2nd. Routledge; New York, NY: 2000. [Google Scholar]
- Youden WJ. Index for rating diagnostic tests. Cancer. 1950;3(1):32–35. doi: 10.1002/1097-0142(1950)3:1<32::aid-cncr2820030106>3.0.co;2-3. [DOI] [PubMed] [Google Scholar]
Associated Data
This section collects any data citations, data availability statements, or supplementary materials included in this article.