Abstract
Invasive electrophysiological and neuroanatomical studies in nonhuman mammalian experimental preparations have helped elucidate the lamina (layer) dependence of neural computations and interregional connections. Noninvasive functional neuroimaging can, in principle, resolve cortical laminae (layers), and thus provide insight into human neural computations and interregional connections. However human neuroimaging data are noisy and difficult to interpret; biologically realistic simulations can aid experimental interpretation by relating the neuroimaging data to simulated neural activity. We illustrate the potential of laminar neuroimaging by upgrading an existing large-scale, multiregion neural model that simulates a visual delayed match-to-sample (DMS) task. The new laminar-based neural unit incorporates spiny stellate, pyramidal, and inhibitory neural populations which are divided among supragranular, granular, and infragranular laminae (layers). We simulated neural activity which is translated into local field potential-like data used to simulate conventional and laminar fMRI activity. We implemented the laminar connectivity schemes proposed by Felleman and Van Essen (Cerebral Cortex, 1991) for interregional connections. The hemodynamic model that we employ is a modified version of one due to Heinzle et al. (Neuroimage, 2016) that incorporates the effects of draining veins. We show that the laminar version of the model replicates the findings of the existing model. The laminar model shows the finer structure in fMRI activity and functional connectivity. Laminar differences in the magnitude of neural activities are a prominent finding; these are also visible in the simulated fMRI. We illustrate differences between task and control conditions in the fMRI signal, and demonstrate differences in interregional laminar functional connectivity that reflect the underlying connectivity scheme. These results indicate that multi-layer computational models can aid in interpreting layer-specific fMRI, and suggest that increased use of laminar fMRI could provide unique and fundamental insights to human neuroscience.
Keywords: Laminar fMRI, neural mass models, high-resolution fMRI, human, computational modeling, cortical layers
Introduction
The layered structure of cortex shapes neural computations, both within and between brain regions. Felleman and Van Essen showed in the primate visual system that feedforward and feedback connections have different laminar projections (Felleman and Van Essen, 1991). Feedforward and feedback suggest directed information flow between regions. Discovery of these laminar connections required invasive techniques, but high-field laminar fMRI could non-invasively reveal feedforward and feedback connections. High-field fMRI, 7T and greater, can achieve submillimeter spatial resolution that can identify different cortical laminae. In several human studies, laminar fMRI has been collected in visual (Koopmans et al., 2010; Olman et al., 2012; Ress et al., 2007), auditory (De Martino et al., 2015) and motor cortex (Guidi et al., 2016; Huber et al., in press). One potential use of laminar fMRI will be to discern the laminar connections; using laminar functional connectivity measures in conjunction with the stereotyped laminar connections (e.g. (Felleman and Van Essen, 1991)), it may become possible to infer laminar-specific effective connectivity between regions (see (Polimeni et al., 2010) for an example). However, because interpreting neuroimaging data is difficult, deriving insight from data can be aided by biologically informed neural simulations (Horwitz and Husain, 2007; Horwitz et al., 2005). Specifically, because the actual activity and connectivity of every element are known in a model, one can evaluate whether inferences based on neuroimaging data accurately reflect the underlying neural substrate (e.g., (Lee et al., 2006)).
An example of this kind of simulation is a visual delayed-match-to-sample (DMS) task (Tagamets and Horwitz, 1998; Ulloa and Horwitz, 2016; Liu et al., 2017) that used a Wilson-Cowan neural mass model (NMM) (Wilson and Cowan, 1972), which can be considered as representing the total excitatory and inhibitory activity of a single cortical column. The visual DMS task model has multiple nodes that represent different brain regions connected in biologically realistic patterns suggested by Felleman and Van Essen (Felleman and Van Essen, 1991). In this paper, we extend the original DMS task model by replacing the Wilson-Cowan NMM units with a laminar microcircuit proposed by Wang and Knosche (2013) to investigate laminar and interregional computations during a visual DMS task. We partially validate the extended laminar model by comparing its results to the results obtained from the original model. We then show how the simulations provide insight into laminar computations and connections. Laminar computations show the combination of inputs to a given layer changes the activity relative to other regions. Examining these connections allows us to infer feedforward, feedback, and lateral relations between nodes.
Neural mass models such as the Jansen-Rit unit (Jansen and Rit, 1995) are used in popular connectivity analysis techniques such as Dynamic Causal Modeling for EEG and MEG (David et al., 2004; David and Friston, 2003; Moran et al., 2013). Figure 1 shows a family of neural mass models in terms of increasing complexity. The Jansen-Rit model makes the Wilson-Cowan model’s recurrent excitatory connections explicit by dividing the Wilson-Cowan excitatory neural mass into excitatory stellate and pyramidal populations. We replace the Wilson-Cowan units in our large-scale neural model (LSNM) with the neural mass model proposed by Wang and Knosche (2013) that represents a 3-layer cortical microcircuit comprising a supragranular layer, layer 4, and an infragranular layer. The Wang-Knosche model divides the Jansen-Rit pyramidal and inhibitory cells between supragranular and infragranular layers. The Wang-Knosche unit reduces to the Wilson-Cowan unit by lumping the pyramidal and excitatory stellate cells into a single excitatory unit and likewise with the inhibitory neural populations. The laminar nature of the Wang-Knosche model allows detailed interregional connectivity schemes.
Figure 1. Cortical Microcircuit Models.
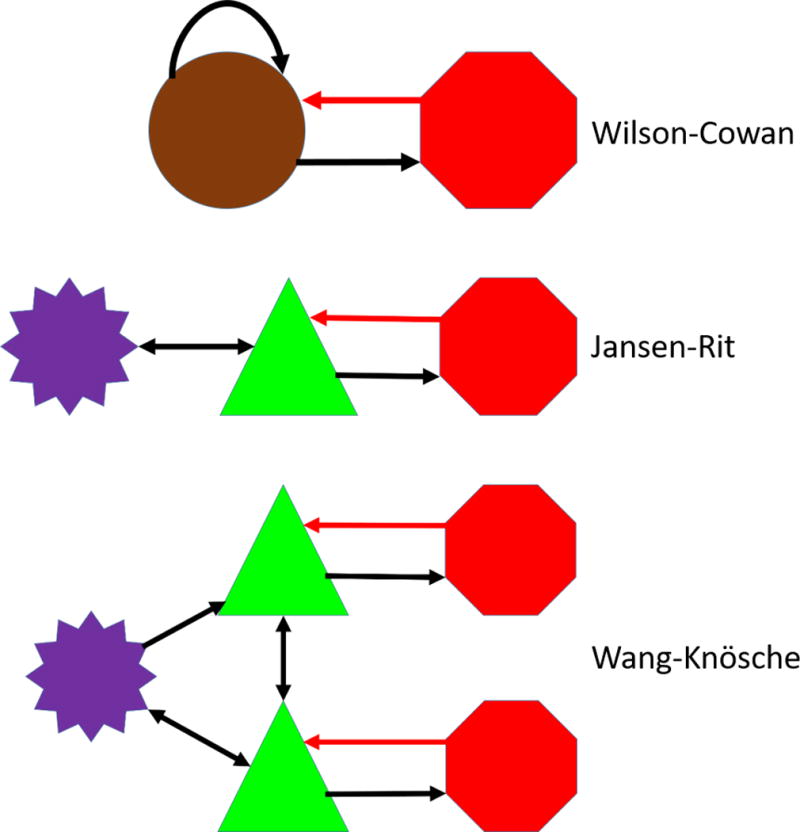
Shown in order of increasing complexity are three neural mass models representing a cortical microcircuit. Excitatory stellate neural masses are purple, pyramidal masses green, and inhibitory masses are red. The excitatory Wilson-Cowan unit is a brown color to reflect that it is a combination of stellate and pyramidal cells. The Wang-Knosche microcircuit can be divided into three layers: the supragranular layer composed of the top pyramidal and inhibitory neural masses, layer 4 composed of the excitatory stellate neural mass, and the infragranular (deep) layer composed of the bottom pyramidal and inhibitory neural masses. The Wang-Knosche model shows the connections used in the LSNM. Connection weights for the Wilson-Cowan microcircuit listed in Table 2A and the Wang-Knosche microcircuit are detailed in Table 2B. Black arrows indicate excitatory connections, red arrows denote inhibitory connections.
The DMS task is used to assess working memory. In our LSNM we use simple visual stimuli to simulate object processing and working memory. The advantage of modeling a task are twofold. First, all aspects of a simulated experiment are controlled. Thus, simulated measurements represent ideal data. Second, the simulations can provide data at a number of spatial scales, from neural population activity to fMRI voxel level activity. The Wilson-Cowan based DMS model matched experimental findings in the literature (Horwitz, 2004; Horwitz et al., 2005; Tagamets and Horwitz, 1998), thus informing the interpretation of electrophysiological (Funahashi et al., 1989), PET (Haxby et al., 1995), and fMRI (Dale and Buckner, 1997) studies. The simulated neural network used here that performs the visual DMS task is embedded in a whole brain framework called The Virtual Brain (TVB) (Sanz Leon et al., 2013), as reported in (Ulloa and Horwitz, 2016), which provides realistic neural noise to the DMS network. A simulation produces two distinct measures of neural activity: average firing rates representing output activity and integrated synaptic activity, which is similar to local field potential (LFP) data, representing input activity. The integrated synaptic activity, convolved with a model of the hemodynamic response function is used to model fMRI BOLD data. Because our simulations are aimed at high-field, laminar fMRI, the hemodynamic model we use is a modified version of the model recently developed by Heinzle et al. (2016) that also incorporates the laminar effects of venous blood draining back to the cortical surface perpendicular to the laminar cortical structure. Note that there have been reports of laminar differences in the hemodynamic response (e.g., Huber et al., 2014). Nevertheless, for simplicity, we will assume in this paper that the laminar fMRI data are generated with a hemodynamic model using identical parameters for all layers, modified by the aforementioned draining vein effect. As is done with empirical data, these simulated fMRI time series provide the ability to examine interregional functional connectivity.
The laminar-based extended LSNM generates an integrated picture of a cognitive task and informs our understanding of new and existing imaging data. A laminar NMM allows the incorporation of a number of features. In particular, we can implement biologically realistic connectivity schemes such as those reported by Felleman and Van Essen (1991). Felleman and Van Essen designated three general types of interregional connections: feedforward, feedback, and lateral connections (Figure 2). Feedforward connections originate in supragranular and sometimes infragranular layers and innervate layer 4 excitatory stellate cells. Feedback connections project from infragranular and sometimes supragranular to cells in the infragranular and supragranular layers. Lateral connections starting in infragranular and supragranular can project to all cortical laminae. We use these connection patterns in building our laminar LSNM. One can differentiate feedforward and feedback connections by comparing the functional connectivity of two ‘regions’, A and B. For example, if layer 4 of B has larger functional connectivity with region A than the supragranular and infragranular layers of B with region A, this suggests a feedforward connection from A to B. Likewise, if the supragranular and infragranular layers of B have larger functional connectivity with region A than layer 4 of B with region A, this suggests feedback or lateral connection from A to B. This type of analysis can be used to infer the nature of the connection between ‘regions’. In the model we, of course, know the “answer” so we can discover if these hypothesized inferences are valid for a particular experimental design. This is our focus in this paper on the laminar LSNM.
Figure 2.
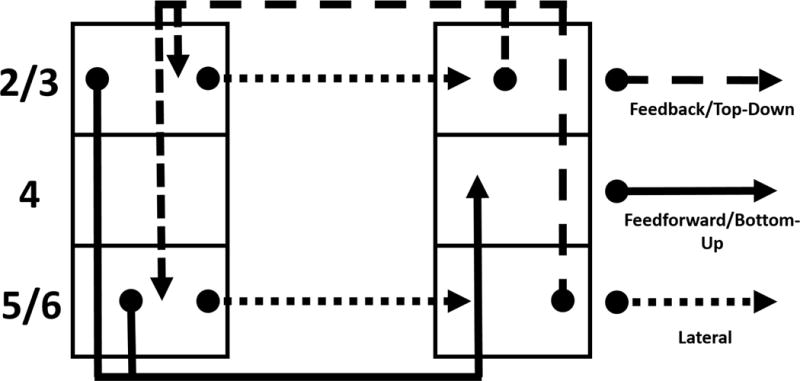
This shows the modified version of the Felleman and Van Essen interregional connections between cortical layers used in our model. See Table 4 for the specific connections between all regions of our model.
Methods
1. Overview of model construction
The large-scale neural model (LSNM) we construct is composed of three sub-models: (1) a structural network model comprising the nodes of the network and the connections between the nodes; this represents the anatomical network; (2) a neural model corresponding to each node; this represents the units that generate the electrophysiological activity of each node. (3) a hemodynamic forward model that converts the electrophysiological activity of each node into a simulated fMRI time series. We thus combine three submodels, each of which has been shown to be consistent with experimental data, to produce the LSNM we present in this paper. Note that each of the submodels can be upgraded or extended as new empirical data are obtained.
2. Naming conventions
We begin by specifying the parts of our large-scale neural model (LSNM) and their correspondence with cortical structures. When discussing the model, we use a precise set of terms. The smallest element of the LSNM is the neural mass, the mathematical representation for a population of neurons. Neural masses do not represent single neurons, but a collection of similar neurons. The neural masses in these simulations represent excitatory stellate, excitatory pyramidal, and inhibitory neurons. Combining neural masses creates a NMM that is a mathematical realization of a cortical microcircuit. Each microcircuit, represents a cortical column. The next level of organization is the module which represents a neural population. In our LSNM, modules are represented by nine-by-nine arrays of microcircuits that have a similar function. For example, in the V1 node there are two modules V1h and V1v; h and v denote selectivity for horizontal and vertical lines, respectively. The LSNM’s modules are V1h, V1v, V4c, V4h, V4v, IT, FS, D1, D2, and FR. The nine-by-nine array is a computational tool, not a spatial distribution of cortical columns. The term node designates collections of modules that correspond to a brain region. The nodes in the model are V1, V4, IT, FS, D1, D2, and FR. Note some modules are nodes; the full list of the names of the modules and their respective functions are listed in Table 1. Note that FS, D1, D2 and FR may occupy the same macroscopic part of prefrontal cortex (PFC); for illustrative purposes, we treat these nodes as representing spatially distinct brain regions.
Table 1.
List of modules and nodes of the LSNM and their function.
| Node | Module | Function |
|---|---|---|
| LGN | LGN | contains the visual stimulus; elements are either in a high or low state |
| V1 | V1h | module activated by horizontal lines |
| V1 | V1v | module activated by vertical lines |
| V4 | V4h | module activated by horizontal lines; larger spatial receptive field than V1v |
| V4 | V4v | module activated by vertical lines; larger spatial receptive field than V1h |
| V4 | V4c | module activated by combinations of horizontal and vertical lines |
| IT | IT | module that builds compact representation with input from V4 modules |
| FS | FS | module activated when a stimulus is present |
| D1 | D1 | module activated once first stimulus is removed; elements of working memory circuit |
| D2 | D2 | module activated when stimuli is present and throughout the trial; element of working memory circuit |
| FR | FR | module that shows high activity when stimuli match |
| ATTS | ATTS | top - down region that projects the task/attention signal to node D2 |
3. Overview of the visual DMS network model
We begin by reviewing the earlier version of the LSNM whose microcircuit is upgraded in this paper.
The visual object processing model (see Figure 3) developed by Tagamets and Horwitz (1998) consists of interconnected neuronal populations representing the cortical ventral pathway that processes visual object features (Haxby et al., 1991; Ungerleider and Mishkin, 1982). The model uses shape features to characterize visual objects. Beginning in striate visual cortex, the ventral processing pathway extends into the inferior temporal cortex and projects into ventrolateral prefrontal cortex. The nodes that comprise the visual model include ones representing primary and secondary visual cortex (V1/V2), area V4, inferior temporal cortex (IT), and prefrontal cortex (PFC). Stimuli are initially activated in the lateral geniculate nucleus (LGN), which is not realistically modelled. The connection of model nodes is shown in Figure 3, while Figure 4 shows details of the early visual modules. Regions V1/V2 and V4 contain two and three modules, respectively, with different functional attributes discussed below. Model neurons in V1/V2 and V4 were assumed to be orientation selective (for simplicity, horizontal and vertical orientations were used). In the visual model, the spatial receptive fields of simulated neurons increase along the ventral processing pathway, as reported in experimental findings (Desimone and Ungerleider, 1989). The response properties of the simulated prefrontal neural elements (FS, D1, D2 and FR) are based on primate electrophysiological data (Funahashi et al., 1990). The original model employs modified Wilson-Cowan (W-C) units as the microcircuit (Tagamets and Horwitz, 1998; Wilson and Cowan, 1972). The synaptic inputs to neuronal masses can be combined and related to the fMRI or MEG/EEG signals via forward models (Banerjee et al., 2012; Horwitz and Tagamets, 1999). In this paper, we will focus on simulated fMRI. A full discussion of parameter selection for the original model can be found in Tagamets and Horwitz (1998).
Figure 3. Large-Scale Neural Model.
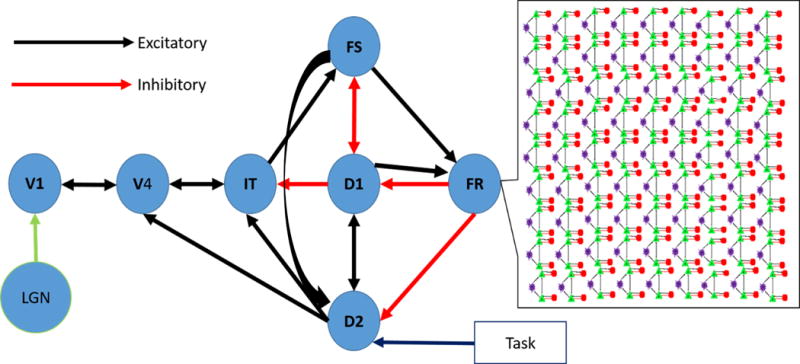
This figure shows the inter-nodal connections for the LSNM. The call out box shows the nine-by-nine array of Wang-Knosche microcircuits used to represent each module. Inhibitory connections are excitatory connections onto inhibitory interneurons. Connection details are reported in Table 4.
Figure 4.
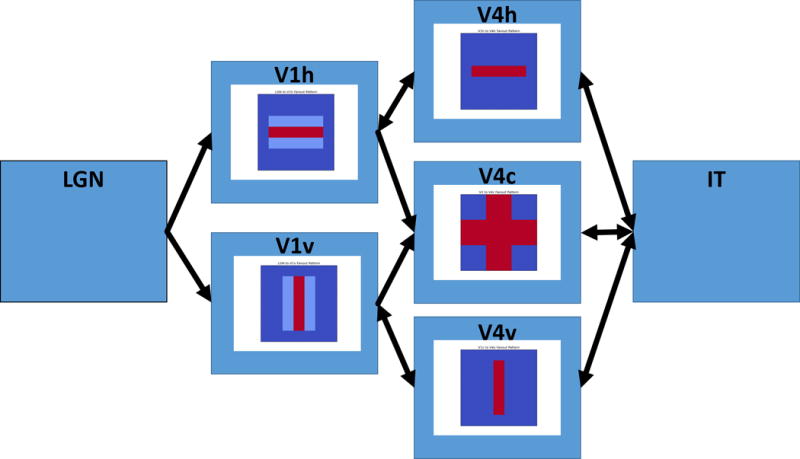
This figure displays a more detailed view of the early visual areas. Inside each box is the receptive field forward connection, e.g. LGN to V1, V1 to V4. Feedforward connections from V1 to V4 have the receptive fields shown in the V4h,v boxes. Weaker off-center bands in V1h,v allow a combination of features in V4c to detect corner elements.
4. Visual DMS task
This visual LSNM was designed to perform a recognition memory visual DMS task. During each trial of the task a stimulus, S1, is presented, followed by a delay period in which a representation of S1 is kept in short-term memory. When S1 appears, the memory circuits are modulated by applying an external top-down signal (ATTS). This top-down signal, called attention (or task signal), ensures that stimulus S1 is retained in the memory circuit during the delay interval. After the delay period, a second stimulus (S2) is presented, and the model responds as to whether the S1 and S2 representations match. High levels of neural activity in the PFC response module, FR, indicate S2 is a match. The model also performs a control task: passive perception of the stimuli. Passive perception is the viewing of stimuli, but the top-down attention signal has a low value. Multiple trials of the active and passive tasks constitute a simulated functional neuroimaging study. The modulation of the task parameters is discussed in detail below.
5. The Virtual Brain
Ulloa and Horwitz (Ulloa and Horwitz, 2016) embedded the visual LSNM into a whole brain framework using The Virtual Brain (TVB) software package (Sanz Leon et al., 2013). The TVB simulator combines: (i) white matter structural connections among brain regions to simulate long-range connections, and (ii) a neuronal population model to simulate local brain activity at each network node. The TVB simulation environment provides non-specific input to the task regions (i.e., neural noise) in the embedded LSNM, which, in turn, provides feedback back to the non-specific neurons. The TVB structural connectome that we employ is based on the work of Hagmann et al. (2008). The simulated neuronal microcircuits at each TVB node are W-C units.
Overall, the LSNM embedded in TVB is able to perform the DMS task, generates simulated neural activities in the various brain regions that match empirical data from nonhuman preparations, and produces simulated functional neuroimaging data that generally agree with human experimental findings (see (Ulloa and Horwitz, 2016) for details). Model output signals come in the form of neural and integrated synaptic activity. These outputs can be analyzed alone or can be transformed into simulated fMRI data. The focus of this paper is on upgrading the network model by replacing the W-C microcircuit with a laminar microcircuit (i.e., the Wang-Knosche (W-K) NMM).
6. Details of the visual LSNM structural model
As mentioned above, the visual DMS model is composed of a detailed ventral visual stream model connected to four prefrontal processing nodes. The ventral visual stream is composed of modules representing the following neural populations: lateral geniculate nucleus (LGN), V1, V4, and IT. The prefrontal regions: FS, D1, D2, and FR have response properties based on monkey electrophysiology data collected by Funahashi et al. (1990). V1 has two modules that simulate neurons with vertical and horizontal receptive fields, respectively (see Fig. 3). V4 has three modules that receive input from V1. The V4 modules have neural elements with larger receptive fields that are sensitive to horizontal lines, vertical lines, and corners (i.e., combinations of the two basic features). From the V4 modules the entire visual field is projected to the IT node as well as feedback to V1. The IT node combines the three V4 representations into the representation used by the prefrontal nodes. IT has forward projections to prefrontal module FS and sends feedback to V4 modules (see Figure 3). The prefrontal module FS is the ‘cue’ node that responds when a visual stimulus is present. FS has forward projections to both D2 and FR and inhibits module D1. D1 is a frontal module that forms part of the memory circuit. This node becomes active after the initial stimulus is no longer present and remains active during the delay portion of a DMS trial. D1 has forward connections to D2 and FR, lateral inhibitory connections to FS, and feedback to inhibitory units in IT. D2, the other half of the prefrontal memory circuit, is modulated by the external task/attention signal that controls whether a stimulus is held in memory, and provides feedback to D1 as well as IT and V4 in the ventral visual system. The final prefrontal node is FR, which responds when the first and second stimuli match; this occurs when the activity patterns in FS and D1 match during the presentation of the second stimulus (S2) of a DMS trial. FR provides inhibitory feedback to modules D1 and D2.
7. Incorporating a laminar-based microcircuit as the fundamental neural unit
We replaced the extended Wilson-Cowan (W-C) microcircuit, the top microcircuit in Figure 1, in the LSNM with a three-layer Wang-Knosche (W-K) microcircuit (Wang and Knosche, 2013); the three layers represent the supragranular layers of cortex, the granular (layer 4) layer, and the infragranular layers. Here, we present the details of this substitution.
a. Voltage versus activity based models and local W-K connections
The W-K NMM is illustrated at the bottom of Figure 1. Originally, the W-K model was written as a voltage-based model (Wang and Knosche, 2013); we converted it into an activity-based model (see the Appendix for details). Activity represents the average firing rate. Neural mass models (NMM i.e., microcircuits) can have various mathematical representations. One version uses differential equations that approximate the average membrane voltage for a population of neurons. Population voltage based equations are a popular method for modeling empirical techniques that employ high temporal resolution such as EEG (Da Silva et al., 2012; Jansen and Rit, 1995) and MEG (David and Friston, 2003; Kiebel et al., 2009). The original W-K microcircuit used a differential equation that describes a driven critically damped oscillator model of average membrane voltage, V(t), of five neural masses. The general form of the voltage equation for a neural mass is:
| (1) |
In this equation τ, a time constant, reflects the speed at which the membrane potential changes. F is function, often a sigmoid, that drives the oscillator. This function can include terms representing connections of the microcircuit with other microcircuits in the network. Voltage models are useful when modeling oscillating signals with high temporal resolution.
An alternative to the voltage based model is a model that represents the average firing rate during a particular time interval; we call this an activity based model. Activity based models, such as the modified W-C model used in our previous model of the DMS task (Tagamets and Horwitz, 1998), represent the average firing rate of a neural population that is active with a driven exponential decay. The prototypical equation for the activity model is:
| (2) |
Here, A(t) is the activity while τ and F have similar interpretations as in the voltage model.
b. Modified W-K connections
The connections within the W-K microcircuit are supported by experimental findings and other neocortical models (see their paper for details). Forward connections project to layer 4 according to Felleman and Van Essen (1991). Evidence for local interlaminar connections are discussed in Thomson and Bannister (2003). Experimental findings note the paucity of connections between supragranular and layer 4 neurons (Shipp, 2007). Accumulated experimental evidence has been synthesized to develop a canonical microcircuit of cortex (Douglas and Martin, 2007; Douglas et al., 1989; Binzegger et al., 2004; Douglas and Martin, 2010), a simplification for modeling. A number of other theoretical microcircuits, similar to the Wang-Knosche one, simulate the spiking activity of the neurons in a small region of neocortex (George and Hawkins, 2009; Haeusler and Maass, 2007; Izhikevich and Edelman, 2008; Potjans and Diesmann, 2014). These models have similar types of connections and location of cells compared to the W-K microcircuit. We chose the W-K microcircuit because it is the simplest laminar model.
In the current paper, the structure of the W-K model is retained, i.e. the connections shown in the bottom model in Figure 1, but the connection weights were changed to fit the activity based representation. We used the W-C weights, reported in Table 2a, to guide the model development. The connection weights within the W-K unit are specified in Table 2b. In the W-C model the strength of the excitatory to excitatory connections is 0.6. In the modified W-K model the sum of excitatory to excitatory connections is 1.8, which is spread over the three excitatory neural masses. Averaging these connections when lumping over the three neural masses (1.8 divided by 3) yields the original value of 0.6. Similar calculations retain the same connection weights for the pyramidal (excitatory) to inhibitory elements of 0.15 in the modified W-K model (equal to the 0.15 connection weight from excitatory to inhibitory units in the W-C model). The same applies for the inhibitory to excitatory connection.
Table 2.
A. Wilson-Cowan microcircuit connection weights. B. Wang-Knosche microcircuit connection weights. EE, EI, IE are excitatory to excitatory, excitatory to inhibitory, and inhibitory to excitatory connections, respectively. DP-deep pyramidal; E – excitatory stellate; SP – superficial pyramidal; D(S)I – deep (superficial) inhibitory.
| A. | ||
|---|---|---|
| From | To | Strength |
| Excitatory | Excitatory | 0.6 |
| Excitatory | Inhibitory | 0.15 |
| Inhibitory | Excitatory | − 0.15 |
| B. | |||
|---|---|---|---|
| From | To | Strength | Type |
| DP | E | 0.5 | EE |
| DP | SP | 0.1 | EE |
| E | DP | 0.1 | EE |
| E | SP | 0.6 | EE |
| SP | DP | 0.5 | EE |
| DP | DI | 0.15 | EI |
| SP | SI | 0.15 | EI |
| DI | DP | − 0.15 | IE |
| SI | SP | − 0.15 | IE |
The final piece of the connectivity scheme is The Virtual Brain, which provides a whole brain simulation of non-specific neural activity. Our task-based LSNM is embedded within this larger model and interacts with The Virtual Brain nodes. Details of this implementation can be found in Ulloa and Horwitz (2016). For simplicity, we chose to have the Virtual Brain nodes provide non-specific input to all neural masses in the W-K model. The microcircuit used in The Virtual Brain is the W-C unit; a laminar unit is not used because at present a laminar connectome does not exist.
c. W-K equations
Each neural mass is governed by an activity based neural equation. The neural activity is driven by a sigmoidal activation function (the form of the function F in equation 2):
| (3) |
The variable θ represents the inputs to the neural mass and ϕ is the activation threshold and inflection point of the sigmoid function. The parameter K defines the steepness of the sigmoid. Large changes occur near the inflection point, ϕ; i.e., small changes near threshold can move a neural mass from a low activity state to a high activity state. The sigmoidal function is commonly used in neural mass models (Marreiros et al., 2008). The generic equation for an activity based NMM is given by:
| (4) |
Equation 4 is a driven exponential decay equation. The parameters of equation 4 include Δ, which represents refractory period, and δ, which represents decay rate. The parameters for neural masses of the W-C and W-K models are listed in Table 3. The argument of the sigmoidal function, θX, contains inputs from local connections in the microcircuit, long range connections from other nodes in the model, input from TVB non-task nodes, and noise. The activity of the W-K model is described by a set of five differential equations, each governing the activity of a neural mass that are detailed in the supplemental materials. The five neural masses in the W-K model simulate layer 4 excitatory stellate (E), supragranular (layer 2/3) pyramidal (SP) and inhibitory (SI), and infragranular (deep, layer 5/6) pyramidal (DP) and inhibitory (DI) neural masses. Long range connections are characterized by the modified Felleman and Van Essen scheme in Figure 2. Specific connection weights of the long-range connections are detailed in Table 4. Note that The Virtual Brain W-C units connect to all layers of the W-K units.
Table 3.
Parameters that characterize the dynamics of a neural mass as described in the text. Q is the length of the interval over which the uniform random noise is added at each time step, drawn from the interval [−.05,.05].
| Δ | δ | τ | K | Q | |
|---|---|---|---|---|---|
| W-C Excitatory | 0.5 | 0.5 | 0.3 | 9 | 0.1 |
| W-C Inhibitory | 0.5 | 0.5 | 0.1 | 20 | 0.1 |
| W-K Excitatory Stellate | 0.5 | 0.5 | 0.3 | 9 | 0.1 |
| W-K Excitatory Pyramidal | 0.5 | 0.5 | 0.32 | 9 | 0.1 |
| W-K Inhibitory | 0.5 | 0.5 | 0.1 | 20 | 0.1 |
Table 4.
Inter-module connection weights that are directed from a particular set of neural connections. The variance parameter is centered on the specified weight of a uniformly distributed random variable; this introduces variability between connections in the early visual areas.
| From | To | Origin | Destination | Weight | Variance | Type | Note |
|---|---|---|---|---|---|---|---|
| D1 | FS | DP | DI | 0.03 | 0 | Lateral | |
| D1 | IT | DP | DI | 0.09 | 0.001 | Feedback | |
| D1 | D2 | DP | E | 0.105 | 0 | Forward | |
| D1 | IT | SP | SI | 0.03 | 0.001 | Feedback | |
| D1 | IT | DP | SI | 0.015 | 0.001 | Feedback | |
| D1 | D2 | SP | E | 0.105 | 0 | Forward | |
| D1 | FR | SP | E | 0.15 | 0 | Forward | |
| D1 | FS | SP | SI | 0.03 | 0 | Lateral | |
| D2 | D1 | DP | DP | 0.014 | 0 | Feedback | |
| D2 | IT | DP | DP | 0.004 | 0.002 | Feedback | |
| D2 | V4c | DP | DP | 0.0021 | 0.0007 | Feedback | |
| D2 | V4h | DP | DP | 0.0021 | 0.0007 | Feedback | |
| D2 | V4v | DP | DP | 0.0021 | 0.0007 | Feedback | |
| D2 | IT | DP | SP | 0.014 | 0.002 | Feedback | |
| D2 | IT | SP | SP | 0.01 | 0.002 | Feedback | |
| D2 | V4c | DP | SP | 0.0021 | 0.0007 | Feedback | |
| D2 | V4h | DP | SP | 0.0021 | 0.0007 | Feedback | |
| D2 | V4v | DP | SP | 0.0021 | 0.0007 | Feedback | |
| D2 | D1 | SP | SP | 0.014 | 0 | Feedback | |
| FR | D2 | DP | DI | 0.26 | 0 | Feedback | |
| FR | D1 | DP | SI | 0.075 | 0 | Feedback | |
| FR | D2 | DP | SI | 0.325 | 0 | Feedback | |
| FR | D1 | DP | DI | 0.06 | 0 | Feedback | |
| FS | D1 | DP | D I | 0.0875 | 0 | Lateral | |
| FS | D2 | DP | E | 0.28 | 0 | Forward | |
| FS | D2 | SP | E | 0.28 | 0 | Forward | |
| FS | FR | SP | E | 0.1375 | 0 | Forward | |
| FS | D1 | SP | SI | 0.0875 | 0 | Lateral | |
| IT | V4c | DP | DP | 0.0015625 | 0.0006 | Feedback | |
| IT | V4h | DP | DP | 0.0015625 | 0.0006 | Feedback | |
| IT | V4v | DP | DP | 0.0015625 | 0.0006 | Feedback | |
| IT | V4c | DP | SP | 0.0015625 | 0.0006 | Feedback | |
| IT | V4h | DP | SP | 0.0015625 | 0.0006 | Feedback | |
| IT | V4v | DP | SP | 0.0015625 | 0.0006 | Feedback | |
| IT | FS | SP | E | 0.6 | 0.02 | Forward | |
| V1h | V4c | SP | E | 0.14 | 0.01 | Forward | * |
| V1h | V4h | SP | E | 0.14 | 0.01 | Forward | * |
| V1v | V4c | SP | E | 0.14 | 0.01 | Forward | * |
| V1v | V4v | SP | E | 0.14 | 0.01 | Forward | * |
| V4c | IT | SP | E | Learned | 0 | Forward | ** |
| V4h | V1h | DP | DP | 0.0025 | 0.001 | Feedback | *** |
| V4h | V1h | DP | SP | 0.0015 | 0.001 | Feedback | *** |
| V4h | IT | SP | E | Learned | 0 | Forward | ** |
| V4v | V1v | DP | DP | 0.0025 | 0.001 | Feedback | *** |
| V4v | V1v | DP | SP | 0.0015 | 0.001 | Feedback | *** |
| V4v | IT | SP | E | Learned | 0 | Forward | ** |
| LGN | V1h | Binary | E | .04,.012,.006 | .002,.003,.003 | Forward | *,**** |
| LGN | V1v | Binary | E | .04,.012,.006 | .002,.003,.003 | Forward | *,**** |
| ATTS | D2 | Binary | SP | 0.05 | 0 | Feedback | **** |
| ATTS | D2 | Binary | DP | 0.05 | 0 | Feedback | **** |
indicates that the various connection weights are based on the receptive fields shown in Figure 4.
indicates that these weight values were learned when the Wilson-Cowan model was developed (see Tagamets and Horwitz 1998 for details of the learning algorithm).
indicates these areas have receptive field properties that are shown in the V4v and V4h boxes from Figure 4.
indicates that these connections come from units in LGN or ATTS which assume either high or low value depending on simulation instructions.
8. Details of the simulated tasks
Simulations are controlled by external inputs to the LSNM neural network. We use two tasks: i) delayed match to sample (DMS), and ii) passive viewing (PV). A single DMS or PV trial can be divided up into four epochs: intertrial interval, S1, delay, S2 and response. These epochs are illustrated in Figure 5 and described below. Concatenated trials simulate an experimental run. The first epoch, intertrial interval, is a period when no stimulus or task parameter are applied to the model. In a series of trials this is the time between the trials. The second epoch is when the initial stimulus, S1, is present. The third epoch is the delay period between the stimulus presentations. The fourth epoch, S2 plus response, is when the second stimulus is presented and the model makes a decision if S2 is the same as S1 (for the DMS task; for PV, no decision is required or made). The response period is defined as the time between the end of S2 and when the D1 and D2 units are reset and the next intertrial interval begins. Note that S1 and S2 are the temporal epochs during which a stimulus is present in the LGN; there will be a latency between the stimulus being presented in the LGN and the beginning onset of neural activity in other nodes.
Figure 5.
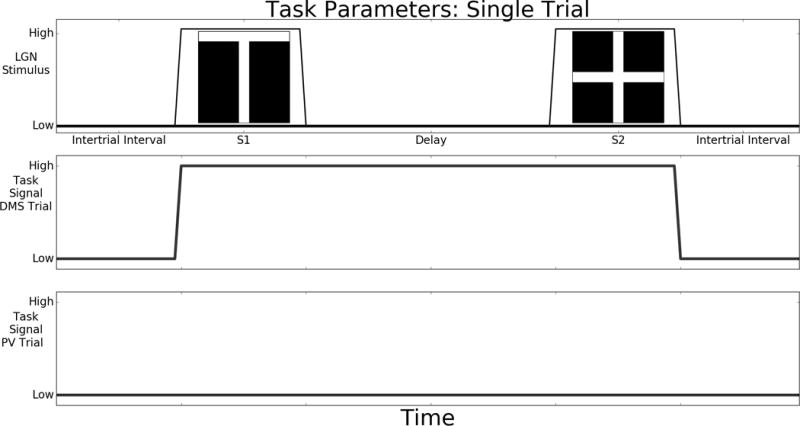
This shows the timeline during a single trial. During both Delayed Match to Sample (DMS) and Passive Viewing (PV) trials, some units in the LGN module are raised to a high value during S1 and S2. The time between the end of S2 and before the reset of the working memory circuit is when the model responds as to whether a match has occurred. The middle and bottom traces show the time course of the ATTS module that is activated during Delayed Match to Sample (DMS) trials but is kept at a low value during Passive Viewing (PV) trials. Multiple trials are concatenated to form an experiment run. The stimuli used in our simulations are shown in the top panel (a “T” and a “+”).
The stimulation of the early visual regions is the same in both the DMS and PV tasks. In our model, the lateral geniculate nucleus module (LGN) projects visual stimuli to the V1 modules. The visual stimuli used in this paper are the “T” and “+” shapes shown in Figure 5. A simulated run consists of 4 trials: match, non-match, match, and non-match (i.e., TT, T+, ++, and +T). This includes all possible stimulus pairings. Stimuli are present in the LGN during the S1 and S2 epochs when elements related to the stimuli are set to a high value. The time course of LGN element activity are represented in the top panel of Figure 5. Within the simulation each time step represents 5 milliseconds and we record the value for neural activity and synaptic activity every 50 milliseconds. The timing of the trials determines how the data can be analyzed. When investigating neural activity, we used shorter delays and intertrial intervals compared to simulations focused on BOLD fMRI measures. These simulated data showcase the finer details of the neural activity that are not accessible to fMRI. For trials in which we were looking at neural activity, stimuli were displayed for one second (200 timesteps) with a two second delay between stimuli and two second intertrial interval. The fMRI trials had longer delays and intertrial intervals so the hemodynamic responses to events in the model can be resolved. When simulated fMRI was the primary interest, we adjusted the parameters such that the simulation corresponded to an event-related experimental design in which the stimuli were displayed for two seconds, a 15 second delay occurred between stimuli, and a 25 second intertrial interval was employed.
The top-down task parameter that influences node D2 determines which task is simulated: DMS or PV. The DMS task occurs when the task signal is set to a high value (0.7), as shown in the middle panel of Figure 5. The task parameter assumes a high value during the S1, delay, and S2 epochs. The task parameter permits a representation of the first stimulus to be held in the memory circuit. The PV task parameter time course is shown in the bottom panel of Figure 5; the task parameter value always has a low value (0.05). In PV, the stimuli are processed by the ventral visual stream but are not retained in the prefrontal memory circuit. After the S2 plus response epoch in DMS trials, the excitatory (stellate and pyramidal) neural masses in D1 and D2 are reset, clearing the memory for the next trial.
9. Output of simulations
The output and input to each neural mass is recorded. The output is the firing rate of model units in the specified population that are firing (above threshold); we refer to this as the neural activity. The neural activity is computed by the differential equations, e.g. X(t) from equation 4. The input to a neural population is called the integrated synaptic activity (ISA). For simulating fMRI BOLD data, the magnitude of the ISA is the sum of the absolute value of each term in the θ expressions from equations 3 and 4. The ISA is simulated for neural masses and is summed up for a node or layer. The ISA approximates local field potentials (LFP), which has been experimentally related to the BOLD signal (Goense and Logothetis, 2008). Node or layer integrated synaptic activity is then convolved with a modified version of the hemodynamic model of Heinzle et al. (2016) to generate a simulated fMRI BOLD time series.
10. Computing simulated BOLD fMRI
The fMRI BOLD signal is simulated from the integrated synaptic activity (ISA) using a modification of the hemodynamic model described in Heinzle et al. (2016) that explicitly incorporates the effects of draining veins. The BOLD signal is reported as the fractional signal change for a regional time series compared to its baseline.
Simulating the fMRI BOLD signal requires two forwards models. The first uses the neural activity to compute three hemodynamic time series: blood flow, blood volume, and deoxyhemoglobin concentration. The second model transforms the hemodynamic time series into an fMRI BOLD time series. We refer to these as the hemodynamic and BOLD models, respectively. For the hemodynamic model, we modified the model proposed by Heinzle et al. that also incorporates the effects of draining deoxygenated blood between cortical layers (Heinzle et al., 2016). Our modification divides cortex into three layers, rather than the two layers used by Heinzle et al. The BOLD model parameters specify the scanner and sequence characteristics. Our BOLD model uses parameters for a 7T scanner using a gradient echo EPI sequence. The physiological and scanner parameter values are listed in Table 5 and the equations used are detailed in the Appendix. For laminar results, we report the activity in each layer. The layer 4 excitatory neurons are the only contribution in the model for layer 4, while supragranular and infragranular layers combine the activities of pyramidal and inhibitory neural masses.
Table 5.
Hemodynamic and BOLD model parameters used to compute fMRI signal. Equations and definitions are detailed in the Appendix.
| Hemodynamic Model Parameters | ||
|---|---|---|
| τs | 1.54 (seconds) | Vasodilatory signal decay constant |
| τf | 2.44 (seconds) | Flow-dependent feedback regulation constant |
| α | 0.32 | Grubb’s vessel stiffness exponent |
| E0 | 0.34 | Resting blood volume fraction |
| ε | 0.1 | Efficacy of synaptic activity to induce the signal |
| λd | 0.5 | Laminar coupling constant |
| τd | 0.5 (seconds) | Interlayer transit delay constant |
| BOLD Model Parameters | ||
|---|---|---|
| V0 | 0.02 | Resting blood volume fraction |
| ϑ0 | 188.1 (Hz) | Frequency offset at outer surface of magnetized vessels |
| TE | 0.025 (seconds) | Echo time |
| ε | 0.026 | Ratio of intra - to extravascular BOLD signal |
| r0 | 340.0 (s−1) | Slope of the intravascular relaxation rate |
| TR | 2 (seconds) | Repetition time |
There are reports of differences in the neurovascular coupling for different cortical lamina in humans (e.g., (Huber et al., 2014)), but for simplicity, in this paper we apply the same hemodynamic model in all nodes and layers of the W-K model.
11. Interpretation of results
We address two issues in this paper: i) comparison of the W-C and W-K models and ii) the advantage of using the lamina W-K microcircuit-based model. Because the W-C version of our LSNM agreed with empirical findings (Tagamets and Horwitz, 1998; Ulloa and Horwitz, 2016), we want to demonstrate that the W-K version of the model generates essentially the same simulated results as the W-C version. Thus, we qualitatively compare the W-C and W-K LSNM simulated neural activity, fMRI BOLD activity, and fMRI functional connectivity. These comparisons are accomplished by reducing the laminar data of the W-K microcircuits into an effective W-C microcircuit by collapsing the excitatory (stellate and pyramidal) and inhibitory neural masses in the W-K microcircuit. The calculation of the lumped excitatory and inhibitory neural activity is in the Appendix. The lumped neural activity can be used to compute average neural activity within a given module; this is detailed in the Appendix. We hypothesize that the visual regions of the W-C and W-K models will have similar neural activity when shown the same stimuli. In prefrontal regions, we expect there may be differences related to the richer connectivity patterns of the W-K model. We quantitatively compare modules of the W-C and W-K models by computing the Pearson correlation of time series (average neural activity and BOLD activity). Showing that the two LSNM models employing different microcircuits match means that the W-K LSNM will yield the previously obtained relationships between experimental data and the W-C LSNM, as detailed in the original papers of Horwitz and colleagues (Horwitz, 2004; Horwitz and Tagamets, 1999; Tagamets and Horwitz, 1998; Ulloa and Horwitz, 2016).
Our second goal is to demonstrate that the W-K model provides information not included in the W-C model, particularly insight into possible mechanisms of laminar activity and interactions between regions. For treatment of the laminar data, the layers are kept separate; each lamina is treated as its own voxel/node. We show selected laminar results, namely those that show differences in activity and/or functional connectivity that are obscured or lost in the lumped data; results for areas that do not appear in the text are provided in the Supplementary Figures. We compare the W-K model for the DMS and PV tasks looking for differences in laminar processing and laminar functional connectivity. We hypothesize two rules based on Felleman-Van Essen connectivity:
For two regions A and B, if layer 4 of B shows greater functional connectivity to A than the supragranular and infragranular layers to A, this suggests a feedforward connection from A to B.
For two regions A and B, if the supragranular and/or infragranular layers of B show greater connectivity than layer 4 of B, this suggests a feedback or lateral connection from A to B.
We will see if our simulations provide confirming evidence for these rules.
All the computer code for the laminar-based LSNM can be found at https://github.com/NIDCD/lsnm-laminar. Note that the Wilson-Cowan version of the model presented in Ulloa and Horwitz (2016) can be found at https://github.com/NIDCD.
Results
Comparing W-C and lumped W-K neural activity measures for the DMS and PV Tasks
As explained in the methods, the individual elements of a W-K unit can be combined (i.e. “lumped” together) to approximate a W-C unit, thus allowing direct comparisons of neural activity, BOLD fMRI, and functional connectivity between the original and current (laminar-based) models. In this section, we show similarity between the models on the DMS and PV tasks. We provide qualitative explanations detailing the correspondence between the models, supported with quantitative measures of the correlation between the time series for the two models. In these time series, we refer to baseline as the intertrial interval after nodes D1 and D2 have been reset.
Comparing Neural Activity for DMS and PV Tasks
In Figure 6A we display the simulated DMS task neural activity for the visual areas V1 and V4 for the W-C and lumped W-K models. When the stimuli, during S1 and S2, are present, there are similar excitatory and inhibitory responses in both models; this is the expected behavior for V1 and V4. When no stimulus is present, the neural activity returns to near baseline. Figure 6A also show that both models have similar neural activity patterns in the PFC, though fewer neural units respond than in V1 and V4. The IT neural activity for both models resembles the activity patterns seen in the visual modules but shows a latency. The cue node, FS, excitatory neurons exhibit neural activity that is similar to the IT neurons as expected. During the delay period in FS there is inhibitory neural activity arising from the connection from D1 to the FS inhibitory neurons. The D1 node shows the expected neural activity during the delay, and S2 periods. During S1 there is inhibitory activity in the D1 module as predicted from the FS to D1 inhibitory connections in the network model (Figure 3). The D2 nodes in both models have the expected behavior with increased excitatory neural activity during S1, the delay, and the S2-response periods. One difference with respect to the D2 nodes is that in the lumped W-K model some excitatory units return to baseline after the first stimulus. In the FR response units both the W-C and lumped W-K models have elevated neural activity on match trials. These findings qualitatively demonstrate for the DMS task that the W-C and the lumped W-K models are similar.
Figure 6.
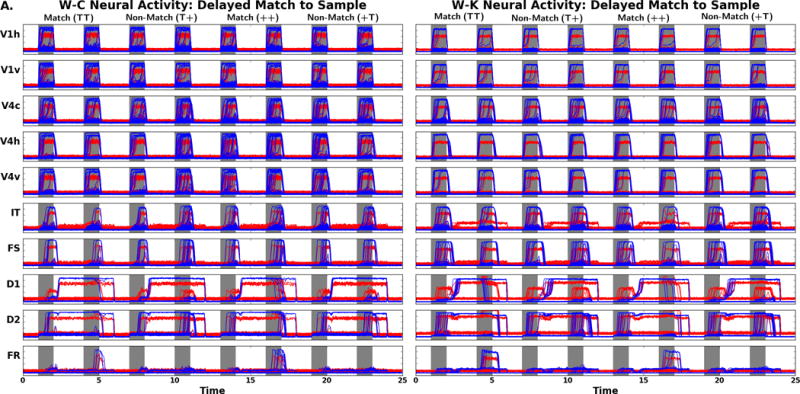
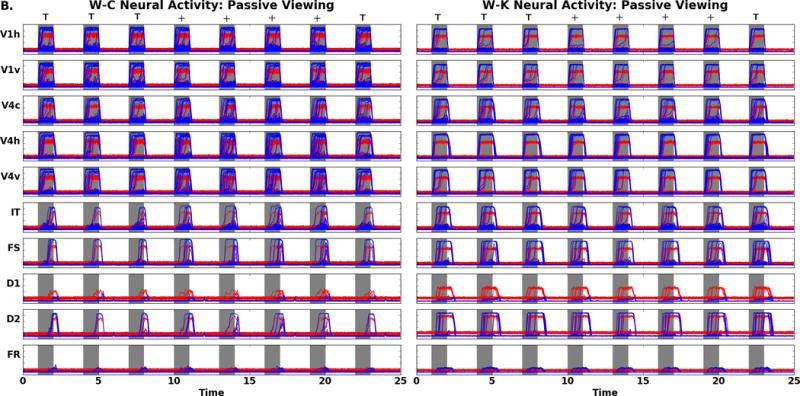
A. Comparison of DMS neural activity of the W-C (left) to W-K (right) models. Note the neural activity is appropriate for the regions FS, D1, D2, and FR as related to the Funahashi et al. (1989) findings. B. Comparison of PV neural activity (task parameter set to a low value) of the W-C (left) to W-K (right) models. Gray areas represent when the stimulus is present (the specific stimulus presented is indicated above the panels). There are four trials: match (TT), non-match (T+), match (++), and non-match (+T). Note the difference in activity of D1, D2, and FR relative to the neural activity seen in these regions in A. Red denotes the activity of the excitatory neurons, blue corresponds to the inhibitory neurons. The x-axis is time in seconds, the y-axis is activity level (arbitrary units).
Table 6 details the correlation between the average neural activity in the different populations in the W-C and lumped W-K models for the DMS and PV tasks. For the DMS condition, the correlations are highest in the areas that directly receive visual inputs. Correlations between W-C and W-K in D1 and D2 are lower, perhaps reflecting differences in the memory circuit connections. An alternative explanation is that resetting the D1 and D2 nodes, clearing the memory circuit after each trial, alters the time series thus lowering the correlation. The response node, FR, excitatory neurons have lower correlations because it has few inputs making it more susceptible to noise. Average inhibitory neural activity has lower correlations between the model neural populations; the inhibitory units primarily receive local excitation and do not directly receive feedforward signals. The FR inhibitory neuronal masses are extreme cases, they only receive input from FR excitatory neurons, meaning they are largely noise driven. Inhibitory neural masses receive weak inputs that are lost in noisy time series of neural activity explaining the low correlation.
Table 6.
Correlation between average neural activities in Wilson-Cowan and Wang-Knosche Models. A large correlation indicates that the two models assume close values when the W-K model is reduced to an equivalent W-C model.
| Task | Passive Viewing | |||
|---|---|---|---|---|
| Module | Excitatory | Inhibitory | Excitatory | Inhibitory |
| V1h | 0.997 | 0.982 | 0.997 | 0.982 |
| V1v | 0.997 | 0.980 | 0.997 | 0.980 |
| V4c | 0.975 | 0.947 | 0.958 | 0.913 |
| V4h | 0.978 | 0.960 | 0.979 | 0.961 |
| V4v | 0.976 | 0.959 | 0.976 | 0.959 |
| IT | 0.922 | 0.843 | 0.922 | 0.832 |
| FS | 0.852 | 0.811 | 0.816 | 0.741 |
| D1 | 0.849 | 0.859 | 0.671 | 0.520 |
| D2 | 0.896 | 0.897 | 0.453 | 0.598 |
| FR | 0.654 | 0.457 | 0.398 | −0.326 |
During the passive viewing condition, stimuli are presented but the top-down task signal is set to a low value, and thus stimuli are not retained in memory and there should be no increase in FR neural activity. Figure 6B, for the W-C and W-K models, illustrates the PV neural activity for the visual modules. The neural activity for the modules in V1 and V4 are similar in form to those from the DMS task, as expected. The IT and prefrontal neural activity are also shown in Figure 6B. In the W-C and W-K IT and PFC nodes there are only transient signals in these neural masses. The W-C and W-K models have similar prefrontal neural activity and produce the expected behavioral response: the working memory circuit did not engage and there were no high levels of neural activity in FR, unlike during the DMS task. For the PV task, we do not have electrophysiological data that inform us as to what the PFC neurons would do during a comparable task. Table 6 reports that average excitatory neural activity between the two models for V1, V4, IT, and FS have correlations above 0.8 while the inhibitory average neural activity correlations are decreased. This is especially true in IT and FS because the inhibitory populations of these nodes receive connections from D1. D1, D2, and FR average excitatory and inhibitory average neural activity have lower correlations between the W-C and W-K models. These three units are influenced by the top down task parameter, and as well, should be noise dominated and thus have small correlations.
Next, we compare the simulated fMRI BOLD time series which is reported as fractional signal change as defined in equation 35 of the Appendix for the DMS task. (Note that because the W-C units have no cortical layers, the hemodynamic model used for both the W-C and W-K models is the Heinzle et al. model (Heinzle et al., 2016) for a single layer). Visual inspection of Figure 7A shows similar time series for the two models as expected based on the neural activity. The correlations between homologous W-C and W-K DMS BOLD time series are listed in Table 7. The lowest correlation is 0.79, suggesting agreement between models. The highest correlation, in V1, is rounded up to 1.0; this is unsurprising as input to V1 in both models feature the same stimuli. Likewise, the passive viewing fMRI time series are similar as shown in Figure 7B. The correlations between the W-C and W-K units have a lowest correlation of 0.905, suggesting good agreement. The correlations reflect the fact that the hemodynamics smooths out fluctuations which produces the high correlations. The fMRI has the same general pattern as the neural activity correlations, although we can see that the effects of the hemodynamic model remove the small differences, particularly those in D1, D2, and FR.
Figure 7.
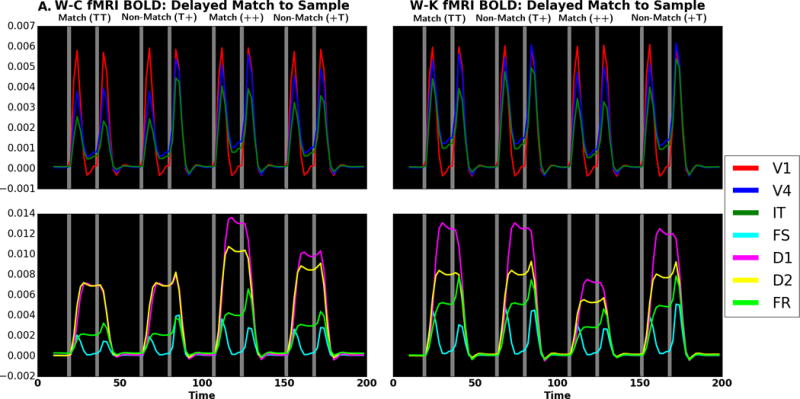
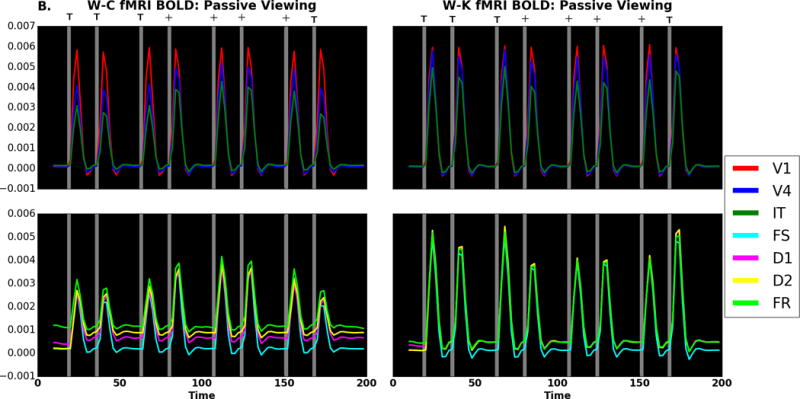
fMRI fractional signal change comparing W-C (left) to W-K (right) for (A) DMS task and (B) passive viewing. Gray areas represent when a stimulus is present. There are four trials: match (TT), non-match (T+), match (++), and non-match (+T). Red corresponds to V1, blue to V4 and green to IT in the top and third rows; in the second and fourth rows, violet corresponds to D1, yellow to D2, cyan to FS and lime to FR. Note that if a color does not appear, it is because it has been overwritten by one of the others. The x-axis is time (in seconds), and the y-axis is activity level (fractional signal change relative to baseline).
Table 7.
Correlations between fMRI BOLD activities in Wilson-Cowan and Wang-Knosche Models.
| Node | DMS Task | Passive Viewing |
|---|---|---|
| V1 | 1.000* | 1.000* |
| V4 | 0.968 | 0.988 |
| IT | 0.929 | 0.962 |
| FS | 0.908 | 0.934 |
| D1 | 0.831 | 0.915 |
| D2 | 0.912 | 0.905 |
| FR | 0.792 | 0.920 |
indicates rounded up from 0.999x where x greater than or equal to 5. Like Table 6, this shows the agreement between models.
Next consider the W-C and W-K models’ DMS task functional connectivity matrices. The measure of functional connectivity is the Pearson correlation between the BOLD time series for a pair of nodes, a common connectivity measure (Bokde et al., 2001; Chang and Glover, 2010; Honey et al., 2009). The correlation matrices displayed in Figure 8 show the W-C and W-K models’ connectivity matrices for the delayed match to sample task and passive viewing. For the DMS task the nodes in the correlation matrices divide into two groups. The first group of nodes is composed of V1, V4, IT, and FS. This group responds to stimulus driven feedforward signals and have lower activity in the absence of feedforward activity. There is a gradient of decreasing connectivity from V1 to V4, V4 to IT, and IT to FS. We designate this group as the stimulus response group. The second group, all of which are in the PFC, is composed of D1, D2 and FR, form a memory group. For the PV task, essentially all nodes are highly correlated with one another. This is due to the fact that in basically all the nodes during PV, the activity level is high when a stimulus is present and low when it is not, which leads to a large correlation coefficient between each pair of time series. Figure 8 thus demonstrates that the patterns of functional connectivity between the different nodes are similar for the W-C and W-K models. Note that real fMRI experiments include contributions to the BOLD signal from nonspecific neurons, whereas we only considered the nodes in our model. If we expand the region of interest to include some non-specific nodes from TVB, then the magnitude of the correlations decreases, although the pattern of connectivity remains the same. We include an example of this in the DMS W-C and W-K correlation matrices in the Supplementary Figures (Fig. S1).
Figure 8.
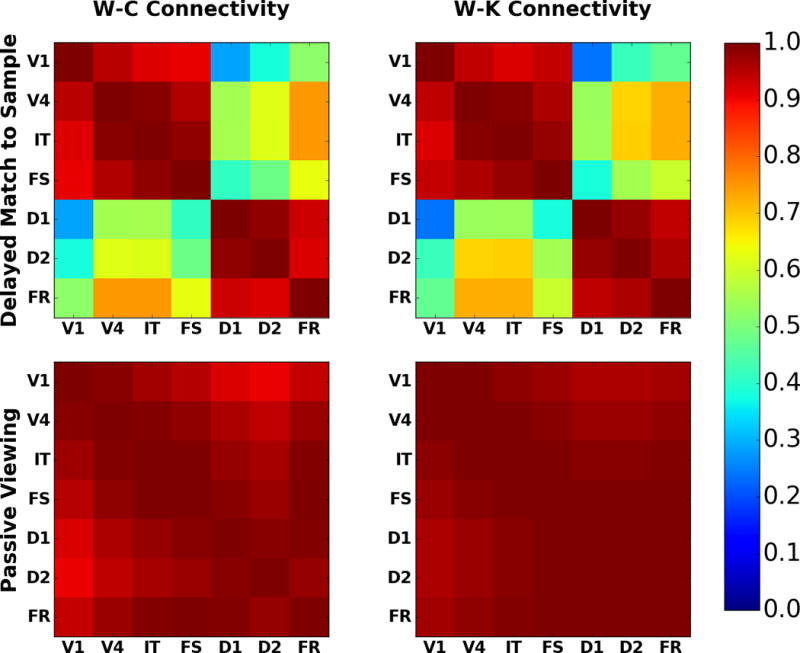
Comparison of fMRI BOLD functional connectivity for W-C (left) and W-K (right) models; DMS task (top) and PV (bottom). These are the correlation matrices for each regional time series with the other regional time series. Note how the DMS connectivity matrices can be split into two blocks: a stimulus response block (upper left) and a working memory block (lower right). The PV matrices show that all regions are responding to the presence or absence of a stimulus. The color bar indicates the value of the correlation coefficient.
In summary, we showed that the W-C and the lumped W-K models exhibit the expected behavior, have comparable activity patterns, and similar functional connectivity measures. We quantified the similarity using correlation between homologous time series for both average neural activity and fMRI BOLD signal. These results provide partial validation for the way we have incorporated the W-K microcircuit into our LSNM. The original W-C model was consistent with a number of empirical findings (see Discussion); thus, the W-K model, inheriting many of the features of the W-C model, is supported by the same empirical findings. Next, we show the advantages of using a laminar model.
Laminar-Based LSNM
We study laminar activity in the W-K model by examining the differences between the DMS and PV conditions. We focus on laminar neural activity and laminar fMRI. Laminar neural activity indicates which neural masses are active and can be linked to the fMRI signal. Laminar fMRI could noninvasively probe the nature of interregional function connectivity. We present examples of a laminar connectivity analysis.
We begin by showing the laminar neural activity for the DMS task in Figure 9. We display the activity in 6 of the 10 modules (the other 4 modules are illustrated in the Supplementary Figures). To start with, the V1h and V4c modules show relatively similar patterns of neural activities with respect to timing following stimulus presentation. The simulated neural activity in IT is interesting because we observe increased inhibitory neural activity in the infragranular layers relative to the supragranular layers. From the timing and knowledge of the model we know that this should be related to activity in D1 which inhibits IT. During the S1 temporal epoch there is high inhibitory activity in D1 due to lateral connections from FS. The D1 excitatory neural activity shows increases during the delay period that mirrors the inhibitory activity observed in IT. During non-match trials, we observe an increase in newly activated inhibitory units, however these units do not cause sustained neural activity in D1 and D2. During S2 on match trials there are activity increases in the inhibitory units that are active during the delay. The excitatory activity in D1 follows the expected behavior for D1 units: activity during the delay, S2, and the response epochs. The neural activity in D2 is quite simple with an increase during S1 and continuous activity until the units are reset at the end of the response epoch. The FR neural masses have the behavior of giving the correct responses with a number of units showing enhanced levels of activity. One interesting aspect of the FR pattern is that there is sustained low level neural activity that begins during S1, then dips before being sustained over the delay until the reset at the end of the response epoch. Based on the knowledge of model we would predict that the early low-level activity is related to feedforward inputs from FS which explains the dip between the time when FS excitatory activity returns to baseline and then D1 begins to show sustained excitatory activity which is fed to FR. On matching trials, the neural activity is raised above the delay period activity.
Figure 9.
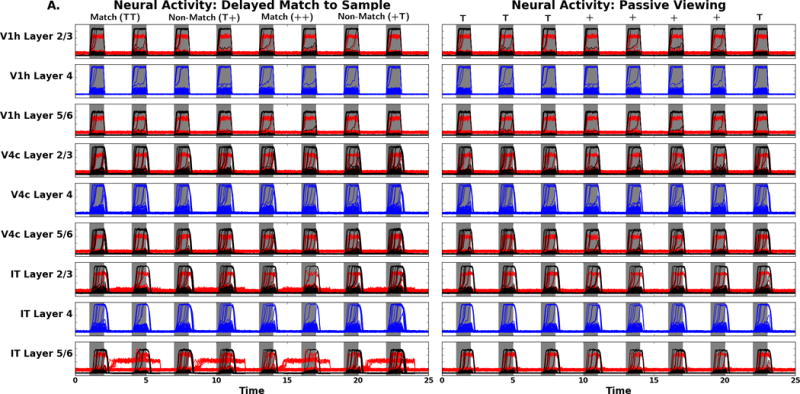
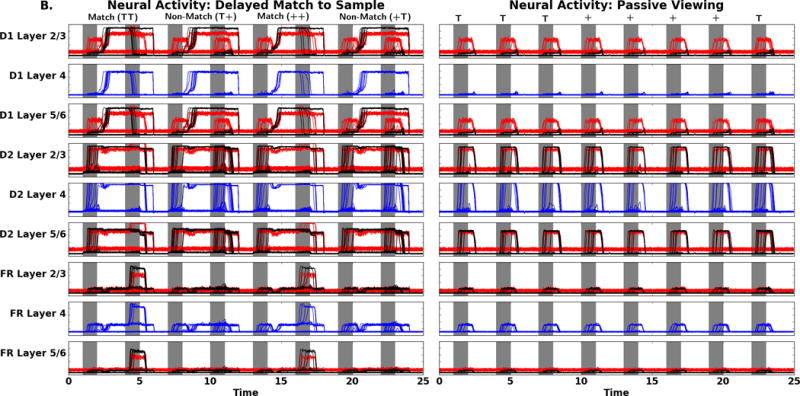
Simulated laminar neural activity for the V1h, V4c, and IT modules (top), and the D1, D2, and FR modules (bottom): DMS task (left) and PV (right). The x-axis is time in seconds, the y-axis is activity level (arbitrary units). Red corresponds to inhibitory neurons, blue to excitatory stellate neurons, and black to pyramidal neurons. The four trials are the same as in Figure 6.
Now we consider the neural activity during the passive viewing condition which also is illustrated in Figure 9. The V1 and V4 prototypical regions look largely the same as in the DMS task. For PV, the IT neural activity does not show the delay period activity. This is bolstered by the observation that there is only transient neural activity in all layers of D1. Furthermore, both D2 and FR show the same type of transient neural activity. Seeing that all these areas have very similar patterns of neural activity indicates that we have a transient propagation of the visual inputs without sustained activity.
We next examine the laminar fMRI results in each region. Simulated data comparing the delayed match to sample and passive viewing tasks are shown in Figure 10A. The first thing we notice is that in every module, and for both conditions, the order of the simulated BOLD effect in the lamina is the same: largest for the supragranular layer, followed by layer 4 and smallest for the infragranular layer. This is consistent with the presence of a draining vein component in the Heinzle et al. (2016) hemodynamic model we are using, and is supported by the empirical data of Siero et al. (2011). However, we can eliminate the draining vein component from the hemodynamic model and see the uncontaminated neural effects on the laminar BOLD. This is displayed in Figure 10B. The second thing that can easily be seen is that the overall pattern of activity in each region is the same for the models with and without the presence of draining veins. However, it is also seen that in some regions there are differences in the relative strength of the neural laminar activities that cannot be observed due to the contamination generated by the draining veins. For example, the IT module shows a greater amount of activity during the delay period of the DMS task in the infragranular layer than in the other two laminae (Fig. 10B, left), but this increase is not observed when draining veins are present (Fig. 10A, left). As a result, we propose that the way to use our modeling framework is to compare the simulated BOLD activity obtained from the draining-vein model with empirical data but interpret the neural basis of the neuroimaging data using the non-draining-vein model. In this way, the artifacts produced by the contaminating effects of the draining veins are eliminated, which means that the interpretation of the results is more reflective of the activity of the underlying neural substrate.
Figure 10.
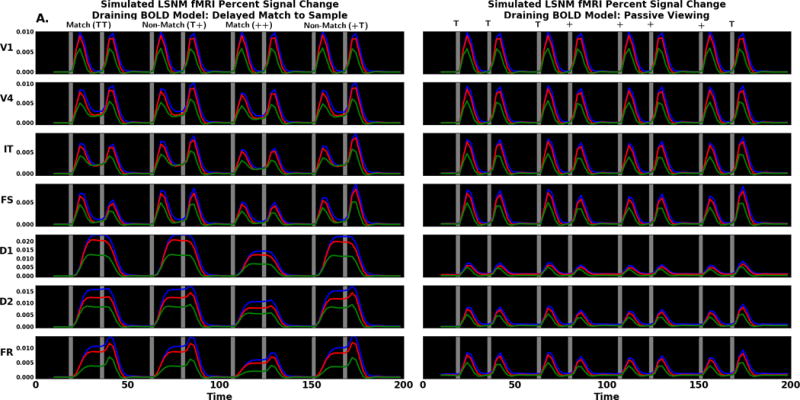
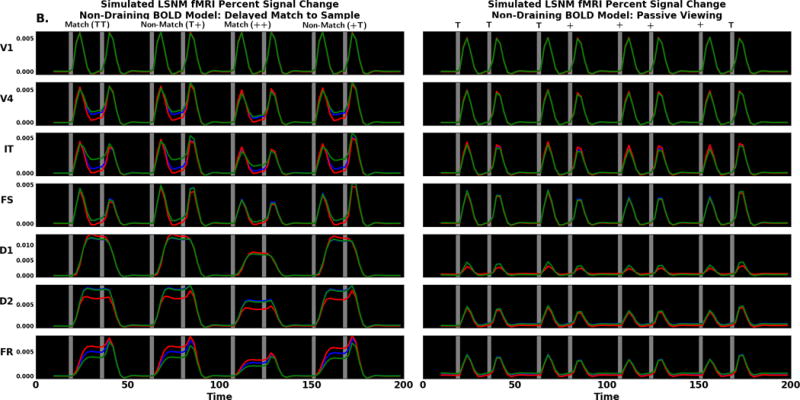
(A) Comparison of laminar fMRI signals for DMS (left) and PV (right) using the Heinzle et al. model with draining veins. (B) Comparison of laminar fMRI signals for DMS and PV using the Heinzle et al. model with no draining veins (i.e. interlaminar coupling constants are set to zero in the hemodynamic model). Blue corresponds to supragranular, red to layer 4 and green to infragranular layers. Y-axis is activity level (fractional signal change relative to baseline). See Figure 7 for other details
Thus, we turn to Fig. 10B to compare the simulated laminar fMRI data for the DMS task to the PV condition. The V1 laminar BOLD signal is quite similar for both DMS and PV. There is a minuscule change in supragranular and infragranular layers between tasks during the delay period. This difference reflects the feedback from higher areas that are engaged in the DMS task. In the V4 delay period the task differences are easier to see; in the DMS task there is increased delay period activity. Note that the changes in neural activity between the DMS and PV tasks are small for any given module; however, because the BOLD signal is a proxy for input into a region, input differences may not be reflected in the output neural activity. The IT node shows a difference similar to what is observed in V4; during the DMS task delay period, there is increased activity relative to passive viewing. The changes in the BOLD signal differ most notably for the supragranular and infragranular layers.
The analysis for the prefrontal FS population is similar to IT. During the DMS task delay period, the supragranular and infragranular BOLD signal is increased relative to the PV task. We can attribute the FS delay period increases to elevated inhibitory neural activity in those layers. In region D1, the DMS and PV assume quite different shapes, though the order of signal change, supragranular, layer 4, and infragranular, are the same for both DMS and PV tasks. The DMS task BOLD signal is increased across the delay period while the PV task BOLD signal is stimulus driven. The DMS neural activity shows a very brief fall in inhibitory neural activity during and after the first stimulus, but we do not see this feature in the BOLD signal. The BOLD signal in D2 look similar to D1 though with some important differences. First, in D1 and D2 there is delay period activity. Second, in D2 during the PV task we note an alteration in laminae order of signal change; in D1 the supragranular and infragranular layers show the greatest signal change when stimuli are present whereas the layer 4 signal is larger during the delay and intertrial intervals suggesting this is feedback driven activity. During PV in region D2, the signal change is similar for most layers when stimuli are present. When stimuli are absent, the layer 4 signal is slightly lower suggesting the absence of feedforward input (note: these changes are quite subtle; see Fig. S3 in the Supplementary Figures). D1 shows the opposite pattern - layer 4 is lower than supragranular and infragranular when stimuli are present and higher otherwise - because region D1 receives only feedback and lateral connections. During the DMS task, activity in the response region, FR, is similar to D1 and D2; however, when a second stimulus arrives there is an increase in the signal change. In the DMS task the signal change increases in layer 4, supragranular, and infragranular layers, but the increases seem to reflect the temporal order of processing in the microcircuit (layer 4 changes first, followed by the supragranular layer, then the infragranular layer).
Laminar connectivity may be one of the great promises of laminar high-resolution fMRI. Here we present the connectivity results when we have simulated all regions at laminar resolution. The connectivity matrices for the DMS and PV task are shown in Figure 11. As with the signal change graphs displayed in Figure 10, Figure 11A shows the case in which the hemodynamic model includes a draining vein component; Figure 11B corresponds to the case where the draining veins are not included; the difference between the two is shown in Fig. 11C. Unlike the situation for the amplitude of signal changes, the functional connectivity matrices are not very different. The largest difference is between IT, layer 4, and layers in D1 and D2 where the draining vein model does lead to slightly higher functional connectivity between all regions than does the non-draining vein model. This is because IT is the node which has both strong feedforward and feedback connections with other nodes, and the draining-vein component of the hemodynamic model acts to smear out the BOLD signal across the layers. This makes the layers in IT less distinct.
Figure 11.
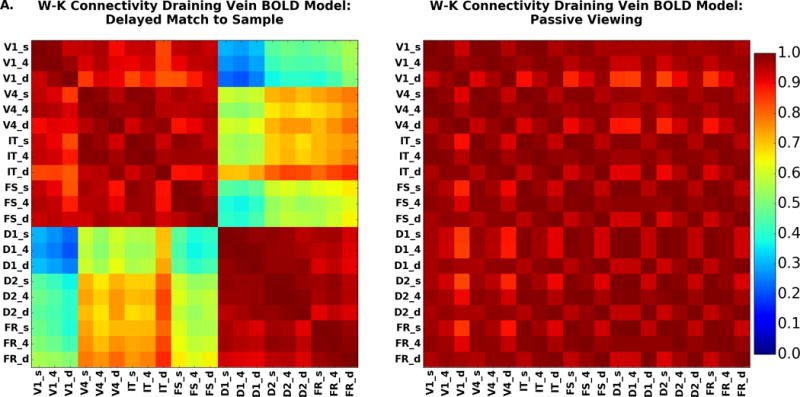
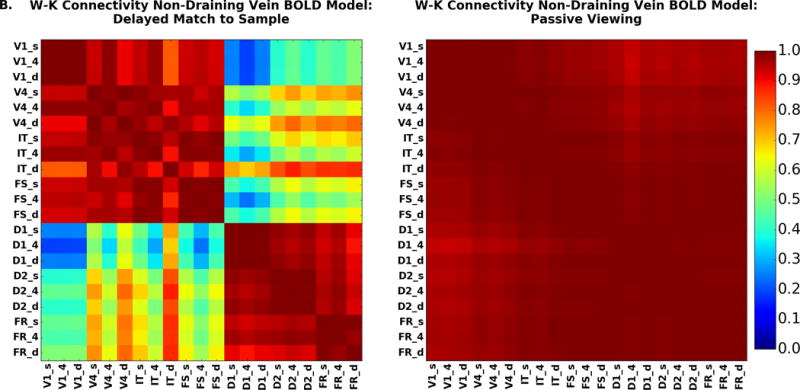
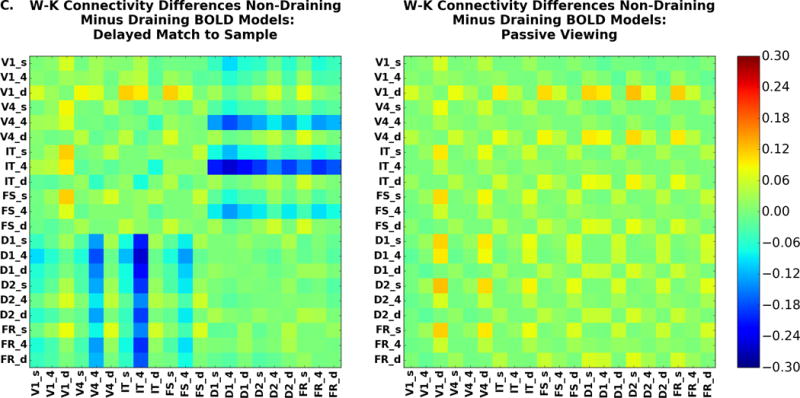
Laminar functional connectivity (fMRI timeseries correlations) for the DMS task (left) and PV (right). These show similar patterns to the reduced WK connectivity matrices on the right-hand side of Figure 8. Here we see the same divisions in the DMS task matrix. (A) Hemodynamic model included draining vein component; (B) hemodynamic model excluded draining vein component; (C) Non-draining vein minus draining vein models. The color bar indicates the value of the correlation coefficient.
The PV functional connectivity matrix (Figure 11B, right) which shows, like the low-resolution version in Figure 8D, that all regional pairs have a high correlation, although there are small gradients of decreasing correlation between regions as they become farther apart in the model. From the neural activity and fMRI signal change, the presence of large interregional correlations is not surprising, representing as it does the relative high level of activity when a stimulus is present and the low level of activity when it is not present.
The DMS task functional connectivity matrix (Figure 11B, left) splits into a stimulus driven block and a memory block. The stimulus driven block, composed of regions V1, V4, IT and FS, shows large increases when stimuli are present and lower levels of activity during the delay periods. These interregional connections are primarily feedforward, though there is feedback as also seen in the analysis of the BOLD time series. The memory driven block comprising D1, D2, and FR is characterized by time series having increased delay period activity. In Figure 12A we examine the connectivity for the laminae of V4, IT and D2 with the layers in all other nodes for the DMS task for both the draining (top panels) and non-draining vein BOLD models (bottom panels). Detailed results for the other nodes for the non-draining vein model are in the Supplementary Figures. Figure 12B presents the same thing for the PV condition.
Figure 12.
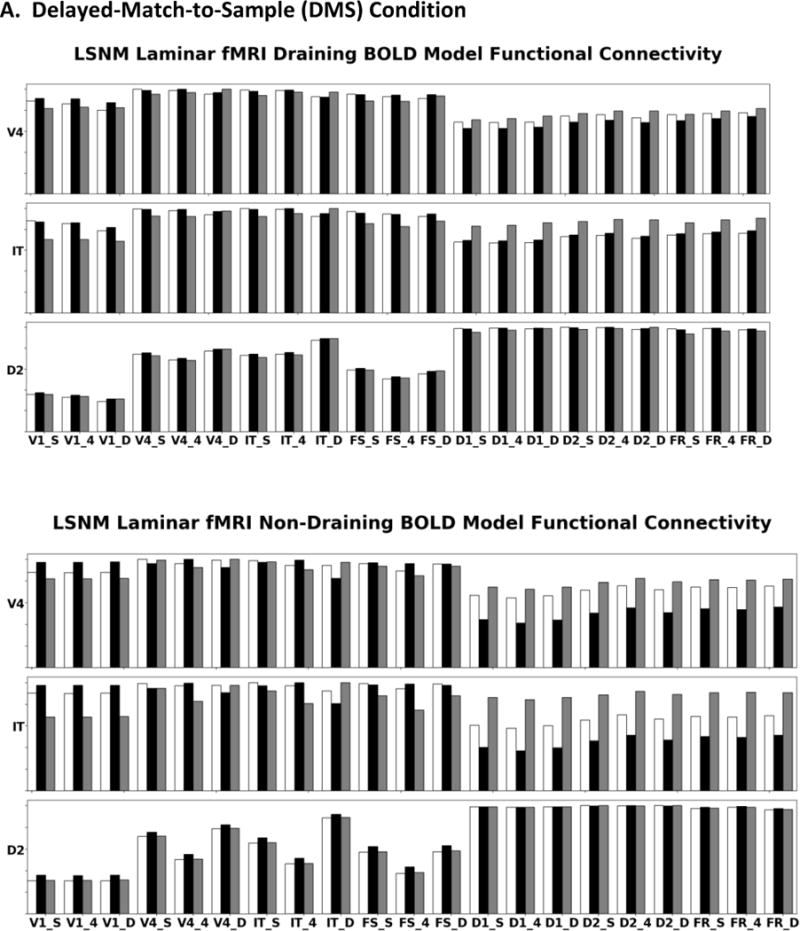
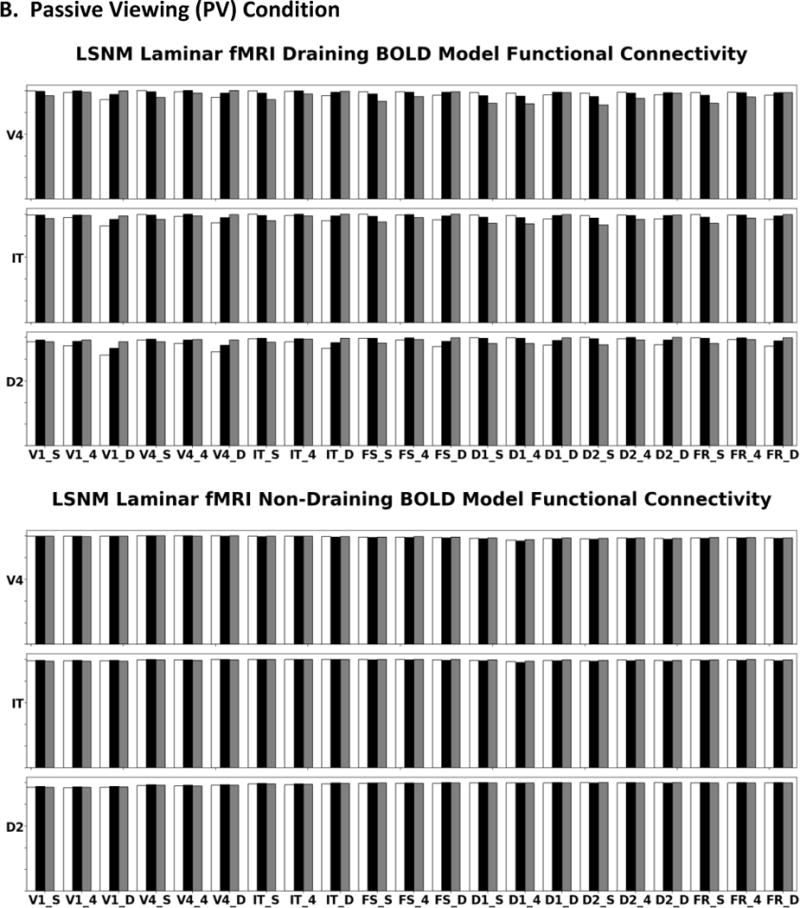
(A) These bar graphs display simulated fMRI functional connectivity (i.e., correlation value) in specific regions during the DMS task for the draining (top panels) and non-draining vein hemodynamic model (bottom panels); this is the full laminar analysis of the connectivity for target regions V4, IT, and D2. As seen, the presence of draining veins attenuates the strengths of the neural functional connectivities. Feedforward connections from a particular region are inferred as showing the largest connectivity with the target region’s layer 4. Feedback and lateral connections are inferred when the region shows its greatest connectivity with the target region’s supragranular and infragranular layers. (B) Laminar functional connectivity for the PV condition for the draining (top panels) and non-draining vein hemodynamic model (bottom panels). White bars correspond to the region’s (denoted on the y-axis) supragranular layer, black bars to layer 4, and gray bars to infragranular layer. The y-axis goes from 0 to 1.
In the bottom panels of Figure 12A (non-draining vein model), we see that V4 has a feedforward connectivity pattern with from V1: V4 layer 4 has the highest correlation with V1 laminae. The correlations between V4 and IT and FS do not show a clear pattern, most likely reflecting the presence of strong feedforward and feedback connections. The memory block nodes display feedback relations with V4, i.e., greater correlation with V4’s supragranular and infragranular layers. Figure 12A shows that IT connectivity is similar to V4; feedforward functional connections from V1 and V4, the connection with FS is ambiguous, and feedback connections from the memory block. D2 shows feedforward connectivity patterns with V1, V4, IT and FS, and feedback or lateral connections with D1 (bottom panel). However, D2 has feedforward connectivity relation with FR; this is because both D2 and FR receive feedforward input from FS and D1 (see Figure 3 and Table 4). The top panels of Figure 12A (draining vein model) show similar results, but the differences between lamina are attenuated compared to the non-draining vein model. Figure 12B displays the corresponding results for the passive viewing (PV) condition. The small differences between lamina seen for the draining vein model reflect the contaminating effect of the draining veins. On the basis of these simulated results, we suggest two heuristic rules that may be useful for interpreting experimental laminar fMRI connectivity data. First, if layer 4 in region B has its greatest correlation with region A, that is evidence of a feedforward functional connection from region A to region B. Second, if the supragranular and infragranular layers of region B show the highest correlations with region A, this suggests that the functional connections from region A to region B are either feedback or lateral connections.
Discussion
In the last few years increasing attention has been paid to examining the functional activity of neurons in the different neocortical lamina. Importantly, recent human fMRI studies have begun to provide layer-specific signals, thus generating the type of neuroimaging data that will permit one to investigate human interlaminar functional connectivity between different cortical brain regions. In this paper, we upgraded a large-scale multiregion neural model of the ventral visual pathway that now allows us to simulate layer-specific neural and fMRI data during the performance of visual object processing tasks (a delayed match-to-sample task and passive viewing). The original model (Horwitz and Tagamets, 1999; Tagamets and Horwitz, 1998; Ulloa and Horwitz, 2016) employed Wilson-Cowan units (Wilson and Cowan, 1972) as the microcircuit representing a cortical column. Here, the replaced the W-C units with a microcircuit developed by Wang and Knosche (2013) that enables us to simulate infragranular, layer 4 and supragranular neural activity. To simulate laminar fMRI, we replaced the hemodynamic response function in our LSNM (Stephan et al., 2007) with a modified version of a hemodynamic model by Heinzle et al. (2016) that incorporates the laminar effects of venous blood draining back to the cortical surface perpendicular to the laminar cortical structure.
We partially validated the upgraded LSNM by showing that the more complex model can be reduced to the simpler model. The importance of this is that findings related to the previous version of the model, specifically its agreement with empirical data (e.g., monkey electrophysiological data (Funahashi et al., 1990); human PET cerebral blood flow data (Haxby et al., 1995), are inherited by the upgraded model. The simulated data generated by the “lumped” W-K LSNM model by-and-large were comparable to simulated data generated by the original W-C LSNM model. Note that the W-C version of our LSNM has itself been updated to enable it to perform multiple short-term memory tasks (Liu et al., 2017), including DMS with distractor stimuli, and a task where multiple items are retained in short-term memory during a delay period [Sternberg task (Sternberg, 1966)]. Simulated neural activities in IT and PFC matched experimental findings from primate electrophysiological data (e.g., Miller et al., 1996) and simulated BOLD activity in modules representing medial temporal cortex and PFC was consistent with empirical findings in humans (e.g., Schon et al., 2009; Druzgal and D’Esposito, 2003).
We also demonstrated that laminar fMRI has advantages over traditional fMRI in terms of analysis of activity and functional connectivity. The laminar model provides a means of exploring functional and effective connectivity in terms of cortical layers of origin and destination, providing face validity for determining how well the interpretation of fMRI data reflects the underlying neural substrate. That is, in the model we know every structural connection and we know what each neural element is doing at each time point in a task. Thus, we can determine if a conclusion based on an fMRI evaluation of connectivity is supported by the underlying neural connectivity (e.g., see Kim and Horwitz (2009)). We used a variant of the Felleman and Van Essen laminar connectivity scheme (Felleman and Van Essen, 1991) as a first approximation. This approach is fine for the sensory pathways, but the prefrontal areas are less clear as to what human interregional connectivity should look like. Knowing this laminar structure can provide insight into the nature (feedforward, feedback, lateral, etc.) of these connections, but simulated data need to be cautiously interpreted until there is experimental validation. In essence, such simulated data can be thought of as predictions that test the hypotheses used to construct the LSNM.
Extensive research, both experimental (Binzegger et al., 2004; Douglas and Martin, 2010) and computational (Heinzle et al., 2007, 2010; Bastos et al., 2012, 2015), has resulted in the formulation of several microcircuits that can summarize the complex neural interactions taking place in a cortical column. Anatomically, Binzegger et al. (2004) produced a quantitative microcircuit corresponding to cat primary visual cortex. Computationally, several microcircuit models have been generated, including one by Heinzle and colleagues (2007, 2010) that represents the frontal eye fields. Haeusler and Maass (2007) constructed a laminar microcircuit consisting of spiking neurons that they used to investigate how well the accumulation and fusion of information contained in generic spike inputs into layer 4 and layers 2/3 is accomplished and how well this information can be accessed by projection neurons in layers 2/3 and layer 5. In terms of interregional connectivity, Bastos et al. (2012) employed a multilayer microcircuit that could be related to the connectivity implied by the notion of predictive coding (i.e., the hypothesis that the brain uses generative models to make inferences about its sensory inputs). This microcircuit was then used as a neural mass model for a dynamic causal modeling (Friston et al., 2012) analysis of electrocorticographic data that examines functional spectral asymmetries between forward and backward connections between V1 and V4 in monkey visual cortex.
The Wang-Knosche (2013) computational microcircuit that we utilized was designed to permit activity dependent plasticity of the excitatory synaptic couplings, and to generate realistic interlaminar dynamics. They demonstrated its effectiveness by simulating EEG/MEG data (i.e., the N100m auditory evoked response) corresponding to auditory habituation.
Others have used the Jansen-Rit model (Jansen and Rit, 1995) as a laminar microcircuit (David et al., 2006), employing the connectivity patterns of Felleman and Van Essen (1991). However, the Jansen-Rit model is not equivalent to the W-K model, and those researchers using the former generally do not evaluate laminar-based activities (e.g., (David et al., 2006)). Moreover, due to model differences, inferences made about feedforward and feedback connectivity may not be the same for the two models.
The W-K microcircuit uses the location of the neural masses to make specific connections explicit. Assigning synaptic activities to particular layers provides the ability to simulate laminar fMRI. For example, our simulation of an event-related fMRI DMS task enabled us to predict that in a laminar analysis of the inferior temporal lobe during the task, a larger BOLD signal would originate from the supragranular and infragranular layers, relative to layer 4, during the delay period, but IT layer 4 will show a larger fractional signal change relative to other two layers during the presentation of stimuli.
At present, experimental acquisition of laminar fMRI activity can be performed over a limited region of interest, although full brain coverage may become available in the future (Ugurbil, 2012) as the ability to acquire multi-slice fMRI data quickly improves (Huber et al., in press). Moreover, it has been demonstrated that it is also possible to improve specificity of signal to gray matter without contamination from large draining veins (Huber et al., 2016). Thus, it is likely that high resolution fMRI will soon allow for laminar-based functional connectivity analyses of the type we have simulated.
Likewise, recording laminar electrophysiological data from multiple regions has rarely been performed, and certainly, as far as we know, none has been reported using the specific DMS paradigm we employed. There is one study by Opris et al. (2015) that did utilize a complex DMS task and recorded laminar data with biomorphic multielectrode arrays from prefrontal cortex of nonhuman primates. Although primarily a methodological study, these authors did find evidence for interactions between simultaneously recorded lamina and between simultaneously recorded columns.
Although laminar-based fMRI has primarily been applied to sensory and motor tasks, it has the potential for better understanding the neural basis of high-level cognitive functions. A recent article by Lawrence and colleagues (2017) reviews a number of important cognitive questions that are addressed by employing laminar fMRI. Many of these studies will depend on using signals in different lamina to differentiate bottom-up from top-down processing. For example, the role of attention in sensory processing was investigated by De Martino et al. (2015) who showed that the effect of attention resulted in sharpened tuning curves in superficial layers of primary auditory cortex; for the visual system, see Muckli et al. (2015) and Kok et al. (2016). Also discussed were future studies that could examine multisensory processing and even the neural basis of consciousness. Versions of our LSNM could be used to generate simulated data that could address some of these topics (except for consciousness). Indeed, we currently have a W-C model of the auditory object processing pathway (Husain et al., 2004), and work in our laboratory is underway to combine the visual and auditory models into TVB framework so that multisensory processing can be investigated. Replacing the W-C microcircuits with W-K laminar microcircuits in these models is also underway.
Even though they attempt to incorporate laminar interactions, both the W-K neural model and the Heinzle et a. hemodynamic model obviously are quite simplified models that exclude many aspects of both the neural and vascular architectures. One important use for our LSNM framework will be to test other neural microcircuits and hemodynamic models, since we have shown in this paper how to incorporate an alternative neural microcircuit and an alternative hemodynamic model and generate simulated data that can be compared to empirical data. Indeed, our framework can be utilized to systematically compare several neural and hemodynamic models against one another and determine which ones best correspond to experimental data.
There are several caveats that should be noted. First, as with any modeling effort, a number of simplifications were made for computational reasons. One important simplification was that we assumed the hemodynamic model was the same for all layers and all brain regions. However, by using a modification of the Heinzle et al. (2016) hemodynamic model that incorporates a draining vein component, we were able to deal with the fact that venous blood draining back to the cortical surface could lead to modifications of the observed fMRI responses from the different layers. Nonetheless, the complex vascular network in the human brain adds a set of difficulties that future research will need to address, and this is particularly true for both experimental and computational modeling efforts related to ultra-high field fMRI (Gagnon et al., 2015; Goense et al., 2016; Markuerkiaga et al., 2016; see Uludag and Blinder (in press) for a recent review). One key area under current investigation focuses on how well models of BOLD activity can represent the effects of response transients. Havlicek and colleagues (2015, 2017) showed that neuronal activity (via cerebral blood flow) and dynamic uncoupling between cerebral blood flow and cerebral blood volume are the sources of BOLD response transients such as initial overshoot and post-stimulus undershoot. Another target of current research examines the role that arterioles may play in the hemodynamic model that converts neural ativity into an fMRI signal (e.g., Tian et al., 2010; Gao et al., 2015). This effort has led to the development of hemodyanmic models that can account for the spatial spread of the hemodynamic response to neural activity (Puckett et al., 2016) and to arterial impulse models of the BOLD response (Aquino et al., 2014; Kim et al., 2016). It also is the case that techniques for laminar fMRI that employ non-BOLD contrast are under development [for a review, see Huber et al. (in press)]. Although some of these vascular complexities are likely to become important for future modeling efforts, entertaining them now is beyond the scope of the current effort.
Note that one advantage of our modeling framework is that our model consists of three submodels: a structural model specifying the links between network nodes; a neural model for each node; and a forward model specifying how the neural activity is converted into a neuroimaging signal. Each of these submodels can be upgraded when new experimental data become available, and/or can be replaced if a more inclusive submodel is wanted. In the present paper, we upgraded both the neural model and the forward model from that employed by Ulloa and Horwitz (2016).
A second caveat concerns how neural noise was treated in the LSNM. Noise from The Virtual Brain (TVB) was injected equally into all embedded LSNM neural masses, which was a simplification due to the fact that TVB nodes are modeled as Wilson-Cowan units, which lack laminar structure. Other simplifying assumptions are possible, such as assuming TVB elements connect with only excitatory neural masses of the W-K units (with randomly vary strengths). We note that there are three sources of noise that will affect the final fMRI signal in an individual subject: (1) neural noise (which is included in our model); non-neural biologic noise (e.g., artifacts arising from breathing); machine noise due to the scanner. The last of these depends on the sequence used and the specific scanner. Since we are not comparing our data to experimental data in this paper (no one has performed laminar fMRI for a DMS task), adding these latter two noise sources is beyond the scope of the current paper.
Our treatment of the PFC also requires a comment. There are four submodules that comprise this region (FS, D1, D2, FR), and for computational convenience we assumed they were in separate anatomical areas of PFC. This is unlikely to be the case. However, future experiments are needed to clarify the locations of distinct PFC neural populations. One thing we did try was to see if we could place some of the four PFC units in different lamina, but we were unable with the W-K model to reproduce the appropriate activity patterns.
In summary, we have produced a more elaborate large-scale neural model of the ventral visual processing pathway that generates neural data that represents supragranular, layer 4 and infragranular activity during a delayed match-to-sample task and during passive viewing. The model shows the expected performance on the DMS task. The model also enables one to simulate multi-layer fMRI data. We used the model to determine laminar-based fMRI patterns of functional connectivity that can be compared to experimental data once increased brain coverage of laminar data is available.
Supplementary Material
Acknowledgments
We wish to thank Dr. Laurentius Huber for a number of useful discussions about laminar neuroimaging. We are grateful to Drs. Huber and Catie Chang for reading and commenting on the manuscript. This research was supported by the Intramural Research Program of NIDCD-NIH.
Appendix
Equations of Wang-Knosche Neural Masses
Here we provide the explicit realization of equation 2 in the main body of the text for the Wang-Knosche model (Wang and Knosche, 2013). The activity of the Wang-Knosche model is described by the following set of five differential equations, each governing the activity of a neural mass. The five neural masses in the WK model simulate layer 4 excitatory stellate, supragranular (layer 2/3) pyramidal and inhibitory, and infragranular (deep, layer 5/6) pyramidal and inhibitory neural populations. We denote these as Ey,i, SPy,i, SIy,i, DPy,i, and DIy,i. The subscripts specify the indices of the unit within a given functional population and the y defines the specific module: V1h, V1v, V4c, V4h, V4v, IT, FS, D1, D2, and FR. The subscript i denotes the specific unit within the functional population, ranging from 1 to 81. E is excitatory, I is for inhibitory, and P is for pyramidal activity. Finally, let M and N represent the specific neural mass within the population: E, DI, DP, SI, and SP. The S and D prefixes before the P and I stand for superficial (supragranular) and deep (infragranular) respectively. We use wMN to denote the local connection weights within a W-K microcircuit. Long range inter-node connections are included in the term in Ny,i(t). Intrinsic noise and inputs from The Virtual Brain are included in the noise term QN(t). The Virtual Brain (TVB) Wilson-Cowan units connect to all neural masses. The LSNM model nodes are embedded within The Virtual Brain and receive inputs based on the Hagmann et al. (2008) connectome. The equation corresponding to the activity of the layer 4 excitatory stellate unit is:
| (1) |
The corresponding input is:
| (2) |
The three components of equation 2 are the local inputs, inter-node connections, and combined noise and inputs from TVB. The equation corresponding to the activity of the supragranular pyramidal cell is:
| (3) |
with
| (4) |
The first three components of equation 4 are local connections, followed by internodal connections, and noise and inputs from TVB. The equation for the supragranular inhibitory cell’s activity is:
| (5) |
with
| (6) |
This input is similar to equation 2. Likewise, the deep (infragranular) pyramidal cell’s activity equation is:
| (7) |
with
| (8) |
This term is like equation 4. Finally, the deep (infragranular) inhibitory cell’s activity is specified by the following equation:
| (9) |
with
| (10) |
The terms in equation 10 are isomorphic to those in equation 6. The solution to the homogeneous differential equation is a simple exponential decay; however, the decay is driven via the sigmoidal function on the right-hand side of the differential equations.
Lumping Wang-Knosche Neural Masses
Formulae for Computing Neural Activity:
To compute the lumped excitatory activity for the W-K model for the ith unit, i ranges from 1 to 81, in module y:
| (11) |
Formula for computing lumped inhibitory neural activity for the W-K model for the ith unit in module y:
| (12) |
These were used to generate the lumped neural activity shown in Figure 6.
Formula for computing average excitatory neural activity for W-C module y:
| (13) |
Formula for computing average inhibitory neural activity for W-C module y:
| (14) |
Formula for computing average excitatory neural activity for W-K module y:
| (15) |
Formula for computing average inhibitory neural activity for W-K module y:
| (16) |
These average neural activities were used to compute the correlations in Table 6.
Let Y be the set of modules within node Y; V1 = {V1h, V1v} and V4 = {V4c, V4h, V4v}. We denote values that represent the integrated synaptic activity (ISA) of a neural mass with a bold font to distinguish it from neural activity. Formula for ISA of WC model in node y:
| (17) |
Formula for lumped ISA of WK model:
| (18) |
The integrated synaptic activity is used to simulate the BOLD fMRI signal. Similar calculations are used to find the laminar integrated synaptic activity.
Hemodynamic Model Equations
Here, we write out the equations for the hemodynamic model. The hemodynamic model we use follows closely the model of Heinzle et al. (2016), except we assume three layers of cortex instead of the two layers that they used. Importantly, this model takes into account the effect of draining veins on the hemodynamic response in each layer.
In the cerebrovascular system arteries enter the cortical surface and descend through the cortical layers. Blood moves out of the arteries into the capillaries supplying neurons with oxygen. The deoxygenated blood returns to the surface via ascending venules that feed into larger draining veins. Neural activity decreases deoxyhemoglobin concentration due to increased blood flow and blood volume. Deoxygenated blood from deeper layers influence more superficial layers’ blood volume and deoxyhemoglobin concentration. The draining vein model introduces auxiliary terms for delayed blood volume and delayed deoxyhemoglobin concentration for both infragranular and layer 4; these couple the lower layer to the layer above it.
The subscripts D (deep/infragranular/layer 5/6), 4 (layer 4), and S (supragranular/layer 2/3) denote the three layers. The equations for all layers are listed in the form used to numerically integrate them. The neural activity for a layer is denoted by y(t). Each layer has a set of four equations for variables denoted s, f, v, and q: the vasodilatory signal, blood flow, blood volume, and deoxyhemoglobin concentration, respectively. Infragranular and layer 4 both have two additional equations that couple the layers: the delayed blood volume and delayed deoxyhemoglobin concentration (v* and q*). We begin with the infragranular layer (5/6). The second order equation for blood flow can be written as a system of first order equations:
| (19) |
| (20) |
The blood volume equation is:
| (21) |
The deoxyhemoglobin concentration equation is:
| (22) |
The infragranular layer’s hemodynamics are unaffected by draining veins, but changes in blood volume and deoxyhemoglobin concentration alter the corresponding values in more superficial layers requiring two auxiliary equations. First is the delayed blood volume component, . This represents the blood volume effects of the infragranular layer on layer 4:
| (23) |
The second equation, with a similar interpretation to the delayed blood volume, is the delayed deoxyhemoglobin concentration, :
| (24) |
The layer 4 flow equations have the same form as the infragranular flow equations shown above:
| (25) |
| (26) |
However, the volume equation is modified by adding the delayed blood volume from the infragranular layer:
| (27) |
Likewise, the deoxyhemoglobin concentration is modified with the delayed deoxyhemoglobin concentration from the infragranular layer:
| (28) |
Delayed volume and delayed deoxyhemoglobin concentration for layer 4 are:
| (29) |
| (30) |
Supragranular blood flow equations are:
| (31) |
| (32) |
The blood volume equation for the supragranular layer is:
| (33) |
The supragranular deoxyhemoglobin concentration is given by:
| (34) |
Based on the empirical findings of the Heinzle et al. (2016) model a uniform set of hemodynamic parameters are employed, i.e. hemodynamic parameters are the same for all layers. We specify the vasodilatory signal decay, τs, is 1.54 seconds (Heinzle et al., 2016). The time flow-dependent feedback regulation, τf, is 2.44 seconds (Buxton et al. 1998). Grubb’s vessel stiffness exponent, α, is 0.32 (Heinzle et al., 2016). The hemodynamic transit time, τ0, is 2.0 seconds; reported as a range of values from 1 to 5 seconds (Havlicek et al., 2015). The resting blood volume fraction, E0, is 0.34 (Heinzle et al., 2016). The term ε is the ability of the integrated synaptic activity to induce a change in blood flow (Friston et al., 2000). The coupling strength between layers, λd, is 0.5. We reduced the coupling strength by a half so that net coupling between layers added up to unity as in Heinzle et al. (2016). We set τd, the interlayer transit delay, to 0.5. Since the value used by Heinzle et al. was 1, we divided this by half since we have an intermediate layer. Further experimental evidence may provide improved estimates for λd and τd. The draining veins can be removed from the model by setting λd equal to zero. This allows us to calculate the fMRI signal without contamination from draining veins, and thus closer to reflecting the neural activity. The lumped BOLD signal uses the Heinzle et al. model reduced to a single layer; this would be computed using equation 19 to 22 using the appropriate y(t) values calculated using equation 18.
The BOLD forward model takes the blood volume and deoxyhemoglobin concentration and converts it into the BOLD time series. The fractional change in the BOLD signal for each layer was computed with the following equation:
| (35) |
This equation was originally introduced by Buxton et al. (1998); for a more detailed discussion, see Stephan et al. (2007). Here the q’s and v’s are replaced by the appropriate layer values to produce the layer specific BOLD signal. We take V0, the resting blood volume fraction, to be 0.02 (Obata et al., 2004). The values of k1, k2, and k3, are given by the following equations:
| (36) |
| (37) |
and
| (38) |
We used the following values to compute k1: ϑ0 was set to 188.1 (Havlicek et al., 2015), E0 was as above 0.34, and we assumed a TE of 25 ms (Heinzle et al., 2016) and a TR of 2 seconds. To compute k2 we took ε, the ratio of intra- to extravascular BOLD signal, to be 0.026 and an r0, the slope the intravascular relaxation rate, of 340 as suggested by Heinzle et al. (2016). Computation of k3 is straightforward. We computed the fractional change in the BOLD signal; no additional transformations were applied.
Footnotes
Publisher's Disclaimer: This is a PDF file of an unedited manuscript that has been accepted for publication. As a service to our customers we are providing this early version of the manuscript. The manuscript will undergo copyediting, typesetting, and review of the resulting proof before it is published in its final citable form. Please note that during the production process errors may be discovered which could affect the content, and all legal disclaimers that apply to the journal pertain.
References
- Aquino KM, Robinson PA, Drysdale PM. Spatiotemporal hemodynamic response functions derived from physiology. J Theor Biol. 2014;347:118–136. doi: 10.1016/j.jtbi.2013.12.027. [DOI] [PubMed] [Google Scholar]
- Banerjee A, Pillai AS, Horwitz B. Using large-scale neural models to interpret connectivity measures of cortico-cortical dynamics at millisecond temporal resolution. Front Syst Neurosci. 2012;5:102. doi: 10.3389/fnsys.2011.00102. [DOI] [PMC free article] [PubMed] [Google Scholar]
- Bastos AM, Usrey WM, Adams RA, Mangun GR, Fries P, Friston KJ. Canonical microcircuits for predictive coding. Neuron. 2012;76:695–711. doi: 10.1016/j.neuron.2012.10.038. [DOI] [PMC free article] [PubMed] [Google Scholar]
- Bastos AM, Litvak V, Moran R, Bosman CA, Fries P, Friston KJ. A DCM study of spectral asymmetries in feedforward and feedback connections between visual areas V1 and V4 in the monkey. Neuroimage. 2015;108:460–475. doi: 10.1016/j.neuroimage.2014.12.081. [DOI] [PMC free article] [PubMed] [Google Scholar]
- Binzegger T, Douglas RJ, Martin KA. A quantitative map of the circuit of cat primary visual cortex. J Neurosci. 2004;24:8441–8453. doi: 10.1523/JNEUROSCI.1400-04.2004. [DOI] [PMC free article] [PubMed] [Google Scholar]
- Bokde AL, Tagamets MA, Friedman RB, Horwitz B. Functional interactions of the inferior frontal cortex during the processing of words and word-like stimuli. Neuron. 2001;30:609–617. doi: 10.1016/s0896-6273(01)00288-4. doi: http://dx.doi.org/10.1016/S0896-6273(01)00288-4. [DOI] [PubMed] [Google Scholar]
- Buxton RB, Wong EC, Frank LR. Dynamics of blood flow and oxygenation changes during brain activation: the balloon model. Magnetic Resonance in Medicine. 1998;39:855–864. doi: 10.1002/mrm.1910390602. [DOI] [PubMed] [Google Scholar]
- Chang C, Glover GH. Time-frequency dynamics of resting-state brain connectivity measured with fMRI. Neuroimage. 2010;50:81–98. doi: 10.1016/j.neuroimage.2009.12.011. [DOI] [PMC free article] [PubMed] [Google Scholar]
- Da Silva FHL, Gorter J, Wadman WJ. Epilepsy as a dynamic disease of neuronal networks. Handb Clin Neurol. 2012;107:35–62. doi: 10.1016/B978-0-444-52898-8.00003-3. [DOI] [PubMed] [Google Scholar]
- Dale AM, Buckner RL. Selective averaging of rapidly presented individual trials using fMRI. Hum Brain Mapp. 1997;5:329–340. doi: 10.1002/(SICI)1097-0193(1997)5:5<329::AID-HBM1>3.0.CO;2-5. [DOI] [PubMed] [Google Scholar]
- David O, Cosmelli D, Friston KJ. Evaluation of different measures of functional connectivity using a neural mass model. Neuroimage. 2004;21:659–673. doi: 10.1016/j.neuroimage.2003.10.006. [DOI] [PubMed] [Google Scholar]
- David O, Friston KJ. A neural mass model for MEG/EEG: coupling and neuronal dynamics. Neuroimage. 2003;20:1743–1755. doi: 10.1016/j.neuroimage.2003.07.015. doi: http://dx.doi.org/10.1016/j.neuroimage.2003.07.015. [DOI] [PubMed] [Google Scholar]
- David O, Kiebel SJ, Harrison LM, Mattout J, Kilner JM, Friston KJ. Dynamic causal modeling of evoked responses in EEG and MEG. Neuroimage. 2006;30:1255–1272. doi: 10.1016/j.neuroimage.2005.10.045. [DOI] [PubMed] [Google Scholar]
- De Martino F, Moerel M, Ugurbil K, Goebel R, Yacoub E, Formisano E. Frequency preference and attention effects across cortical depths in the human primary auditory cortex. Proc Natl Acad Sci U S A. 2015;112:16036–16041. doi: 10.1073/pnas.1507552112. [DOI] [PMC free article] [PubMed] [Google Scholar]
- Desimone R, Ungerleider LG. Neural mechanisms of visual processing in monkeys. In: Goodglass H, Damasio AR, editors. Handbook of Neuropsychology. Elsevier; Amsterdam: 1989. pp. 267–300. [Google Scholar]
- Douglas RJ, Martin KA. Recurrent neuronal circuits in the neocortex. Curr Biol. 2007;17:R496–R500. doi: 10.1016/j.cub.2007.04.024. [DOI] [PubMed] [Google Scholar]
- Douglas RJ, Martin KA, Whitteridge D. A canonical microcircuit for neocortex. Neural Comput. 1989;1:480–488. doi: 10.1162/neco.1989.1.4.480. [DOI] [Google Scholar]
- Douglas RJ, Martin KAC. Canonical cortical circuits. In: Shepherd GM, Grillner S, editors. Handbook of Brain Microcircuits. Oxford University Press; New York: 2010. pp. 15–21. [Google Scholar]
- Druzgal TJ, D’Esposito M. Dissecting contributions of prefrontal cortex and fusiform face area to face working memory. J Cogn Neurosci. 2003;15:771–784. doi: 10.1162/089892903322370708. [DOI] [PubMed] [Google Scholar]
- Felleman DJ, Van Essen DC. Distributed hierarchical processing in primate cerebral cortex. Cereb Cortex. 1991;1:1–47. doi: 10.1093/cercor/1.1.1-a. doi: https://doi.org/10.1093/cercor/1.1.1-a. [DOI] [PubMed] [Google Scholar]
- Friston KJ, Mechelli A, Turner R, Price CJ. Nonlinear responses in fMRI: The Balloon model, Volterra kernels, and other hemodynamics. NeuroImage. 2000;12:466–477. doi: 10.1006/nimg.2000.0630. [DOI] [PubMed] [Google Scholar]
- Friston KJ, Bastos AM, Litvak V, Stephan KE, Fries P, Moran RJ. DCM for complex-valued data: cross-spectra, coherence and phase-delays. Neuroimage. 2012;59:439–455. doi: 10.1016/j.neuroimage.2011.07.048. [DOI] [PMC free article] [PubMed] [Google Scholar]
- Funahashi S, Bruce C, Goldman-Rakic PS. Visuospatial coding in primate prefrontal neurons revealed by oculomotor paradigms. J Neurophysiol. 1990;63:814–831. doi: 10.1152/jn.1990.63.4.814. [DOI] [PubMed] [Google Scholar]
- Funahashi S, Bruce CJ, Goldman-Rakic PS. Mnemonic coding of visual space in the monkey’s dorsolateral prefrontal cortex. J Neurophysiol. 1989;61:331–349. doi: 10.1152/jn.1989.61.2.331. [DOI] [PubMed] [Google Scholar]
- Gagnon L, Sakadzic S, Lesage F, Musacchia JJ, Lefebvre J, Fang Q, Yucel MA, Evans KC, Mandeville ET, Cohen-Adad J, Polimeni JR, Yaseen MA, Lo EH, Greve DN, Buxton RB, Dale AM, Devor A, Boas DA. Quantifying the microvascular origin of BOLD-fMRI from first principles with two-photon microscopy and an oxygen-sensitive nanoprobe. J Neurosci. 2015;35:3663–3675. doi: 10.1523/JNEUROSCI.3555-14.2015. [DOI] [PMC free article] [PubMed] [Google Scholar]
- George D, Hawkins J. Towards a mathematical theory of cortical micro-circuits. PLoS Comput Biol. 2009;5:e1000532. doi: 10.1371/journal.pcbi.1000532. [DOI] [PMC free article] [PubMed] [Google Scholar]
- Gao YR, Greene SE, Drew PJ. Mechanical restriction of intracortical vessel dilation by brain tissue sculpts the hemodynamic response. Neuroimage. 2015;115:162–176. doi: 10.1016/j.neuroimage.2015.04.054. [DOI] [PMC free article] [PubMed] [Google Scholar]
- Goense JB, Logothetis NK. Neurophysiology of the BOLD fMRI signal in awake monkeys. Curr Biol. 2008;18:631–640. doi: 10.1016/j.cub.2008.03.054. [DOI] [PubMed] [Google Scholar]
- Goense J, Bohraus Y, Logothetis NK. fMRI at high spatial resolution: Implications for BOLD-models. Front Comput Neurosci. 2016;10:66. doi: 10.3389/fncom.2016.00066. [DOI] [PMC free article] [PubMed] [Google Scholar]
- Guidi M, Huber L, Lampe L, Gauthier CJ, Moller HE. Lamina-dependent calibrated BOLD response in human primary motor cortex. Neuroimage. 2016;141:250–261. doi: 10.1016/j.neuroimage.2016.06.030. [DOI] [PubMed] [Google Scholar]
- Haeusler S, Maass W. A statistical analysis of information-processing properties of lamina-specific cortical microcircuit models. Cereb Cortex. 2007;17:149–162. doi: 10.1093/cercor/bhj132. [DOI] [PubMed] [Google Scholar]
- Hagmann P, Cammoun L, Gigandet X, Meuli R, Honey CJ, Wedeen VJ, Sporns O. Mapping the structural core of human cerebral cortex. PLoS Biol. 2008;6:e159. doi: 10.1371/journal.pbio.0060159. [DOI] [PMC free article] [PubMed] [Google Scholar]
- Haxby JV, Grady CL, Horwitz B, Ungerleider LG, Mishkin M, Carson RE, Herscovitch P, Schapiro MB, Rapoport SI. Dissociation of object and spatial visual processing pathways in human extrastriate cortex. Proc Natl Acad Sci USA. 1991;88:1621–1625. doi: 10.1073/pnas.88.5.1621. [DOI] [PMC free article] [PubMed] [Google Scholar]
- Haxby JV, Ungerleider LG, Horwitz B, Rapoport SI, Grady CL. Hemispheric differences in neural systems for face working memory: A PET-rCBF Study. Human Brain Mapp. 1995;3:68–82. doi: 10.1002/hbm.460030204. [DOI] [Google Scholar]
- Havlicek M, Roebroeck A, Friston K, Gardumi A, Invanov D, Uludag K. Physiologically informed dynamic causal modeling of fMRI data. NeuroImage. 2015;122:355–372. doi: 10.1016/j.neuroimage.2015.07.078. [DOI] [PubMed] [Google Scholar]
- Havlicek M, Ivanov D, Poser BA, Uludag K. Echo-time dependence of the BOLD response transients - A window into brain functional physiology. Neuroimage. 2017;159:355–370. doi: 10.1016/j.neuroimage.2017.07.034. [DOI] [PubMed] [Google Scholar]
- Heinzle J, Hepp K, Martin KA. A microcircuit model of the frontal eye fields. J Neurosci. 2007;27:9341–9353. doi: 10.1523/JNEUROSCI.0974-07.2007. [DOI] [PMC free article] [PubMed] [Google Scholar]
- Heinzle J, Hepp K, Martin KAC. A biologically realistic cortical model for eye movement contol in reading. Psych Rev. 2010;117:808–830. doi: 10.1037/a0019575. [DOI] [PubMed] [Google Scholar]
- Heinzle J, Koopmans PJ, den Ouden HE, Raman S, Stephan KE. A hemodynamic model for layered BOLD signals. Neuroimage. 2016;125:556–570. doi: 10.1016/j.neuroimage.2015.10.025. [DOI] [PubMed] [Google Scholar]
- Honey CJ, Sporns O, Cammoun L, Gigandet X, Thiran JP, Meuli R, Hagmann P. Predicting human resting-state functional connectivity from structural connectivity. Proc Natl Acad Sci U S A. 2009;106:2035–2040. doi: 10.1073/pnas.0811168106. [DOI] [PMC free article] [PubMed] [Google Scholar]
- Horwitz B. Relating fMRI and PET signals to neural activity by means of large-scale neural models. Neuroinformatics. 2004;2:251–266. doi: 10.1385/NI:2:2:251. [DOI] [PubMed] [Google Scholar]
- Horwitz B, Husain FT. Simulation frameworks for large-scale brain systems. In: Jirsa VK, McIntosh AR, editors. Handbook of Brain Connectivity. Springer-Verlag; New York: 2007. pp. 275–302. [Google Scholar]
- Horwitz B, Tagamets MA. Predicting human functional maps with neural net modeling. Human Brain Mapp. 1999;8:137–142. doi: 10.1002/(SICI)1097-0193(1999)8:2/3<137∷AID-HBM11>3.0.CO;2-B. [DOI] [PMC free article] [PubMed] [Google Scholar]
- Horwitz B, Warner B, Fitzer J, Tagamets MA, Husain FT, Long TW. Investigating the neural basis for functional and effective connectivity: Application to fMRI. Phil Trans Roy Soc B. 2005;360:1093–1108. doi: 10.1098/rstb.2005.1647. [DOI] [PMC free article] [PubMed] [Google Scholar]
- Huber L, Goense J, Kennerley AJ, Ivanov D, Krieger SN, Lepsien J, Trampel R, Turner R, Moller HE. Investigation of the neurovascular coupling in positive and negative BOLD responses in human brain at 7 T. Neuroimage. 2014;97:349–362. doi: 10.1016/j.neuroimage.2014.04.022. [DOI] [PubMed] [Google Scholar]
- Huber L, Ivanov D, Guidi M, Turner R, Uludag K, Moller HE, Poser BA. Functional cerebral blood volume mapping with simultaneous multi-slice acquisition. Neuroimage. 2016;125:1159–1168. doi: 10.1016/j.neuroimage.2015.10.082. [DOI] [PubMed] [Google Scholar]
- Huber L, Ivanov D, Handwerker DA, Marrett S, Guidi M, Uludag K, Bandettini PA, Poser BA. Techniques for blood volume fMRI with VASO: From low-resolution mapping towards sub-millimeter layer-dependent applications. Neuroimage. doi: 10.1016/j.neuroimage.2016.11.039. (in press) [DOI] [PMC free article] [PubMed] [Google Scholar]
- Huber L, Uludag K, Moller HE. Non-BOLD contrast for laminar fMRI in humans: CBF, CBV, and CMRO2. Neuroimage. doi: 10.1016/j.neuroimage.2017.07.041. (in press) [DOI] [PubMed] [Google Scholar]
- Husain FT, Tagamets MA, Fromm SJ, Braun AR, Horwitz B. Relating neuronal dynamics for auditory object processing to neuroimaging activity. Neuroimage. 2004;21:1701–1720. doi: 10.1016/j.neuroimage.2003.11.012. [DOI] [PubMed] [Google Scholar]
- Izhikevich EM, Edelman GM. Large-scale model of mammalian thalamocortical systems. Proc Natl Acad Sci U S A. 2008;105:3593–3598. doi: 10.1073/pnas.0712231105. [DOI] [PMC free article] [PubMed] [Google Scholar]
- Jansen BH, Rit VG. Electroencephalogram and visual evoked potential generation in a mathematical model of coupled cortical columns. Biol Cybern. 1995;73:357–366. doi: 10.1007/BF00199471. [DOI] [PubMed] [Google Scholar]
- Kiebel SJ, Garrido MI, Moran R, Chen CC, Friston KJ. Dynamic causal modeling for EEG and MEG. Hum Brain Mapp. 2009;30:1866–1876. doi: 10.1002/hbm.20775. [DOI] [PMC free article] [PubMed] [Google Scholar]
- Kim J, Horwitz B. How well does Structural Equation Modeling reveal abnormal brain anatomical connections? An fMRI simulation study. Neuroimage. 2009;43:1190–1198. doi: 10.1016/j.neuroimage.2009.01.006. [DOI] [PMC free article] [PubMed] [Google Scholar]
- Kim JH, Ress D. Arterial impulse model for the BOLD response to brief neural activation. Neuroimage. 2016;124:394–408. doi: 10.1016/j.neuroimage.2015.08.068. [DOI] [PMC free article] [PubMed] [Google Scholar]
- Kok P, Bains LJ, van Mourik T, Norris DG, de Lange FP. Selective Activation of the Deep Layers of the Human Primary Visual Cortex by Top-Down Feedback. Curr Biol. 2016;26:371–376. doi: 10.1016/j.cub.2015.12.038. [DOI] [PubMed] [Google Scholar]
- Koopmans PJ, Barth M, Norris DG. Layer-specific BOLD activation in human V1. Hum Brain Mapp. 2010;31:1297–1304. doi: 10.1002/hbm.20936. [DOI] [PMC free article] [PubMed] [Google Scholar]
- Lawrence AJD, Formisano E, Muckli L, de Lange FP. Laminar fMRI: Applications for cognitive neuroscience. Neuroimage. doi: 10.1016/j.neuroimage.2017.07.004. (in press) [DOI] [PubMed] [Google Scholar]
- Lee L, Friston KJ, Horwitz B. Large-scale neural models and dynamic causal modelling. Neuroimage. 2006;30:1243–1254. doi: 10.1016/j.neuroimage.2005.11.007. [DOI] [PubMed] [Google Scholar]
- Liu Q, Ulloa A, Horwitz B. Using a large-scale neural model of cortical object processing to investigate the neural substrate for managing multiple items in short-term memory. J Cogn Neurosci. 2017;29:1860–1876. doi: 10.1162/jocn_a_01163. [DOI] [PMC free article] [PubMed] [Google Scholar]
- Markuerkiaga I, Barth M, Norris DG. A cortical vascular model for examining the specificity of the laminar BOLD signal. Neuroimage. 2016;132:491–498. doi: 10.1016/j.neuroimage.2016.02.073. http://dx.doi.org/10.1016/j.neuroimage.2016.02.073. [DOI] [PubMed] [Google Scholar]
- Marreiros AC, Daunizeau J, Kiebel SJ, Friston KJ. Population dynamics: variance and the sigmoid activation function. Neuroimage. 2008;42:147–157. doi: 10.1016/j.neuroimage.2008.04.239. [DOI] [PubMed] [Google Scholar]
- Miller EK, Erickson CA, Desimone R. Neural mechanisms of visual working memory in prefrontal cortex of the macaque. J Neurosci. 1996;15:5154–5167. doi: 10.1523/JNEUROSCI.16-16-05154.1996. [DOI] [PMC free article] [PubMed] [Google Scholar]
- Moran RJ, Campo P, Symmonds M, Stephan KE, Dolan RJ, Friston KJ. Free energy, precision and learning: the role of cholinergic neuromodulation. J Neurosci. 2013;33:8227–8236. doi: 10.1523/JNEUROSCI.4255-12.2013. [DOI] [PMC free article] [PubMed] [Google Scholar]
- Muckli L, De Martino F, Vizioli L, Petro LS, Smith FW, Ugurbil K, Goebel R, Yacoub E. Contextual feedback to superficial layers of V1. Curr Biol. 2015;25:2690–2695. doi: 10.1016/j.cub.2015.08.057. [DOI] [PMC free article] [PubMed] [Google Scholar]
- Obata T, Liu TT, Miller KL, Luh WM, Wong EC, Frank LR, Buxton RB. Discrepancies between BOLD and flow dynamics in primary and supplementary motor areas: application of the balloon model to the interpretation of BOLD transients. NeuroImage. 2004;21:144–153. doi: 10.1016/j.neuroimage.2003.08.040. [DOI] [PubMed] [Google Scholar]
- Olman CA, Harel N, Feinberg DA, He S, Zhang P, Ugurbil K, Yacoub E. Layer-specific fMRI reflects different neuronal computations at different depths in human V1. PLoS One. 2012;7:e32536. doi: 10.1371/journal.pone.0032536. [DOI] [PMC free article] [PubMed] [Google Scholar]
- Opris I, Fuqua JL, Gerhardt GA, Hampson RE, Deadwyler SA. Prefrontal cortical recordings with biomorphic MEAs reveal complex columnar-laminar microcircuits for BCI/BMI implementation. J Neurosci Meth. 2015;244:104–113. doi: 10.1016/j.jneumeth.2014.05.029. [DOI] [PMC free article] [PubMed] [Google Scholar]
- Polimeni JR, Witzel T, Fischl B, Greve DN, Wald LL. Identifying common-source driven correlations in resting-state fMRI via laminar-specific analysis in the human visual cortex. Proc Intl Soc Mag Reson Med. 2010;18:353. [Google Scholar]
- Potjans TC, Diesmann M. The cell-type specific cortical microcircuit: relating structure and activity in a full-scale spiking network model. Cereb Cortex. 2014;24:785–806. doi: 10.1093/cercor/bhs358. [DOI] [PMC free article] [PubMed] [Google Scholar]
- Puckett AM, Aquino KM, Robinson PA, Breakspear M, Schira MM. The spatiotemporal hemodynamic response function for depth-dependent functional imaging of human cortex. Neuroimage. 2016;139:240–48. doi: 10.1016/j.neuroimage.2016.06.019. [DOI] [PubMed] [Google Scholar]
- Ress D, Glover GH, Liu J, Wandell B. Laminar profiles of functional activity in the human brain. Neuroimage. 2007;34:74–84. doi: 10.1016/j.neuroimage.2006.08.020. [DOI] [PubMed] [Google Scholar]
- Sanz Leon P, Knock SA, Woodman MM, Domide L, Mersmann J, McIntosh AR, Jirsa V. The Virtual Brain: a simulator of primate brain network dynamics. Front Neuroinform. 2013;7:10. doi: 10.3389/fninf.2013.00010. [DOI] [PMC free article] [PubMed] [Google Scholar]
- Schon K, Quiroz YT, Hasselmo ME, Stern CE. Greater working memory load results in greater medial temporal activity at retrieval. Cereb Cortex. 2009;19:2561–2571. doi: 10.1093/cercor/bhp006. [DOI] [PMC free article] [PubMed] [Google Scholar]
- Shipp S. Structure and function of the cerebral cortex. Curr Biol. 2007;17:R443–R449. doi: 10.1016/j.cub.2007.03.044. [DOI] [PubMed] [Google Scholar]
- Siero JC, Petridou N, Hoogduin H, Kuijten PR, Ramsey NF. J Cereb Blood Flow Metab. 31:1999–2008. doi: 10.1038/jcbfm.2011.57. [DOI] [PMC free article] [PubMed] [Google Scholar]
- Stephan KE, Weiskopf N, Drysdale PM, Robinson PA, Friston KJ. Comparing hemodynamic models with DCM. Neuroimage. 2007;38:387–401. doi: 10.1016/j.neuroimage.2007.07.040. [DOI] [PMC free article] [PubMed] [Google Scholar]
- Sternberg S. High-speed scanning in human memory. Science. 1966;153:652–654. doi: 10.1126/science.153.3736.652. [DOI] [PubMed] [Google Scholar]
- Tagamets MA, Horwitz B. Integrating electrophysiological and anatomical experimental data to create a large-scale model that simulates a delayed match-to-sample human brain imaging study. Cereb Cortex. 1998;8:310–320. doi: 10.1093/cercor/8.4.310. doi: https://doi.org/10.1093/cercor/8.4.310. [DOI] [PubMed] [Google Scholar]
- Thomson AM, Bannister AP. Interlaminar connections in the neocortex. Cereb Cortex. 2003;13:5–14. doi: 10.1093/cercor/13.1.5. doi: https://doi.org/10.1093/cercor/13.1.5. [DOI] [PubMed] [Google Scholar]
- Tian P, Teng IC, May LD, Kurz R, Lu K, Scadeng M, Hillman EM, De Crespigny AJ, D’Arceuil HE, Mandeville JB, Marota JJ, Rosen BR, Liu TT, Boas DA, Buxton RB, Dale AM, Devor A. Cortical depth-specific microvascular dilation underlies laminar differences in blood oxygenation level-dependent functional MRI signal. Proc Natl Acad Sci U S A. 2010;107:15246–15251. doi: 10.1073/pnas.1006735107. [DOI] [PMC free article] [PubMed] [Google Scholar]
- Ugurbil K. The road to functional imaging and ultrahigh fields. Neuroimage. 2012;62:726–735. doi: 10.1016/j.neuroimage.2012.01.134. [DOI] [PMC free article] [PubMed] [Google Scholar]
- Uludag K, Blinder P. Linking brain vascular physiology to hemodynamic response in ultra-high field MRI. Neuroimage. doi: 10.1016/j.neuroimage.2017.02.063. (in press) http://dx.doi.org/10.1016/j.neuroimage.2017.02.063. [DOI] [PubMed]
- Ulloa A, Horwitz B. Embedding task-based neural models into a connectome-based model of the cerebral cortex. Front Neuroinform. 2016;10:32. doi: 10.3389/fninf.2016.00032. [DOI] [PMC free article] [PubMed] [Google Scholar]
- Ungerleider LG, Mishkin M. Two cortical visual systems. In: Ingle DJ, Goodale MA, Mansfield RJW, editors. Analysis of Visual Behavior. MIT Press; Cambridge: 1982. pp. 549–586. [Google Scholar]
- Wang P, Knosche TR. A realistic neural mass model of the cortex with laminar-specific connections and synaptic plasticity - evaluation with auditory habituation. PLoS One. 2013;8:e77876. doi: 10.1371/journal.pone.0077876. [DOI] [PMC free article] [PubMed] [Google Scholar]
- Wilson HR, Cowan JD. Excitatory and inhibitory interactions in localized populations of model neurons. Biophys J. 1972;12:1–24. doi: 10.1016/S0006-3495(72)86068-5. [DOI] [PMC free article] [PubMed] [Google Scholar]
Associated Data
This section collects any data citations, data availability statements, or supplementary materials included in this article.


