

Abstract
Cutaneous melanoma (CM) is the most malignant tumor of skin cancers because of its rapid development and high mortality rate. Long noncoding RNAs (lncRNAs), which play essential roles in the tumorigenesis and metastasis of CM and interplay with microRNAs (miRNAs) and mRNAs, are hopefully considered to be efficient biomarkers to detect deterioration during the progression of CM to improve the prognosis. Bioinformatics analysis was fully applied to predict the vital lncRNAs and the associated miRNAs and mRNAs, which eventually constructed the competing endogenous RNA (ceRNA) network to explain the RNA expression patterns in the progression of CM. Further statistical analysis emphasized the importance of these key genes, which were statistically significantly related to one or few clinical features from the ceRNA network. The results showed the lncRNAs MGC12926 and LINC00937 were verified to be strongly connected with the prognosis of CM patients.
Keywords: ceRNA network, cutaneous melanoma, lncRNA, progression
Introduction
Cutaneous melanoma (CM), a malignant tumor developing from melanocytes, is considered to be the most aggressive of skin cancers. Although the number of CM cases only accounts for less than 3% of skin cancer cases, its incidence has been on the rise for the past 30 years, with a faster rate than any other type of skin cancer worldwide 1, 2. In addition, it results in more than 70% of patient deaths, most of which were patients in stages III and IV of the disease. It is concluded that patients with early‐stage melanoma are considerably cured, while in the later stages (stages III and IV), the thickness of the tumor (more than 2 mm) and distant metastasis are regarded as the greatest risk factors 3, 4, 5, 6.
Despite the early diagnosis of CM to efficiently improve the prognosis of patients, to date, there is no undisputable detection of this cancer. The morphological diagnosis of CM is based on imaging techniques, such as MRI and CT, which lack sensitivity to distinguish early lesions. In addition, histopathological interpretation cannot completely diagnose CM 7, 8. As a result, the 5‐year survival rate is poor, at less than 16% 9. Obviously, a sensitive and specific biomarker that can distinguish early lesions of CM will make a tremendous contribution to diagnosis and prognosis as well as mitigate the social burden of this disease.
Long noncoding RNAs (lncRNAs) are one of the transcripts without a coding protein having 200–10 000 bp in length. They interact in a regulatory manner before, during, and after transcription. The multiple levels of regulation in lncRNA exhibit huge potential in diverse biological processes, of which cell proliferation, differentiation, and migration are closely associated with metastasis and the deterioration of tumors 10, 11. In addition, lncRNAs display a tissue‐specific expression pattern 12. Many studies have confirmed the participation of various lncRNAs in the etiology and carcinomatosis of CM 13, 14, 15, 16. Therefore, we examined the expression of different lncRNAs between the stages of CM to detect whether one or more lncRNAs could serve as biomarkers.
Materials and Methods
TCGA database and bioinformatics analysis
The RNA expression data (level 3: which were processed and standardized based on the miRNA expression data of TCGA.) and clinical information of CM patients were downloaded from The Cancer Genome Atlas Data Portal as of December 2016. All the original RNA sequencing raw reads were processed and normalized by the TCGA RNASeqV2 system afterward to fit the analysis. To seek the relationship between the RNA expression and the metastasis of melanoma, all the patients in TCGA were divided into three groups (stage 0, stages I & II, and stages III & IV) according to their diagnosed stages based on AJCC (the American Joint Committee on Cancer). Because of the lack of data, the numbers of groups varied between microRNAs and others. There were 6207 and 179 patients in three microRNA (miRNA) groups, respectively, while there were 6220 and 182 patients who composed another three groups of mRNA/lncRNAs samples. For the purpose of pointing out a cluster of lncRNA, mRNA, and miRNA, the bioinformatics analysis was conducted following the procedures in the flowchart of Figure 1.
Figure 1.
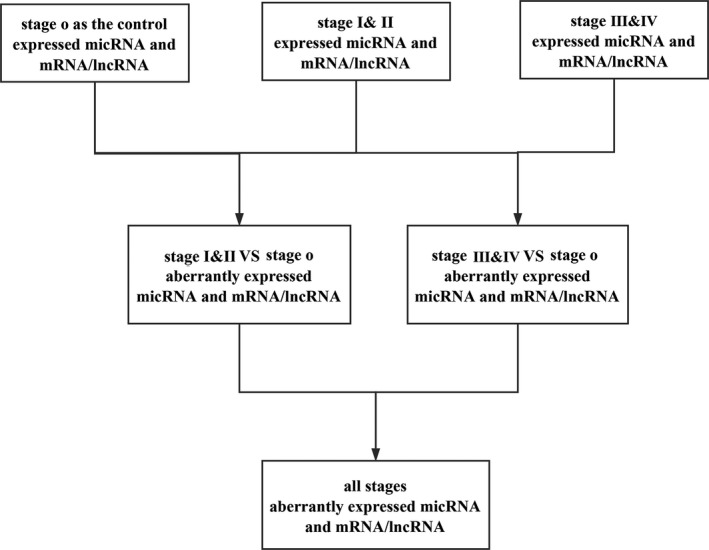
The flowchart of the bioinformatics analysis.
Functional enrichment analysis
To understand the biological functions and processes these genes were involved in, Gene Ontology database (GO, http://www.geneontology.org) and Kyoto Encyclopedia of Genes and Genomes (KEGG, http://www.kegg.jp/) were utilized to conduct functional enrichment analysis. The enrichment score was regarded above 1.5 or below 0.67 with P < 0.05.
Construction of the competing endogenous RNA (ceRNA) and protein–protein interaction (PPI) networks
With the relationship among lncRNAs, miRNAs, and mRNAs, we can predict related sponge lncRNAs through miRNAs based on the MREs (miRNA Response Elements) and predict mRNAs through the miRNAs that invoke their expression by binding them 17. The miRanda tool (http://www.microrna.org/microrna/home.do) was performed to provide the lncRNA–miRNA and miRNA–mRNA interactions, and all the results can be verified through starBase V2.0 database (http://starbase.sysu.edu.cn). These predicted results were cross‐matched with the results of the bioinformatics analysis. Finally, the mRNAs with no negatively regulated lncRNAs and miRNAs were discarded. Hence, a map of the interplay among lncRNAs, miRNAs, and mRNAs based on the previous bioinformatics analysis was completed. Only the lncRNAs, miRNAs, and mRNAs with fold changes >1.5/<0.67 and P < 0.05 were retained. The designs and details are presented in the flowchart of Figure 2. The visualization of the ceRNA network was accomplished by Cytoscape v3.0. Afterward, in context with the co‐expressed genes, the PPI network was conducted via STRING (Version 10.5) (https://string-db.org/).
Figure 2.
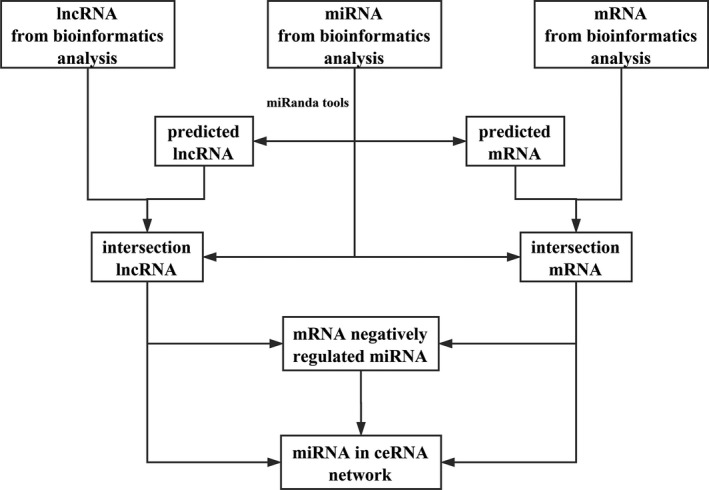
The flowchart of the ceRNA network construction.
Statistical analysis of key genes and clinical features
Key genes closely associated with the metastasis of CM were filtrated by the bioinformatics analysis and the ceRNA network, successively. To master more information about how these key genes affect CM, they were deeply analyzed according to clinical features, including gender, race, AJCC pathological stage, TNM stage, and outcome with Student's t‐test. In addition, Kaplan–Meier survival curves were set up to identify the specific lncRNAs associated with CM patients' survival time. All results with P < 0.05 were considered to be statistically significant. The statistical analyses were performed using SPSS 23.0.
Results
Specific lncRNAs in the progression of CM
Through bioinformatics analysis, specific expressed lncRNAs, mRNAs, and miRNAs at different stages were identified with the standard of absolute fold changes >1.5 or <0.67 and P < 0.05. Comparing the expression of lncRNAs in stages I & II of CM with those in stage 0, 38 aberrantly expressed lncRNAs were identified, and another 38 lncRNAs were screened out through the same comparison between stages III & IV and stage 0. After cross‐matching the results, 26 lncRNAs, which were aberrantly expressed throughout the development of CM, were identified (Fig. 3, Table 1). The comparison of the expression of mRNAs between other stages with stage 0 resulted in 456 mRNAs that were aberrantly expressed in the early stages and 502 mRNAs in the advanced stages, and there were 311 mRNAs included in both levels (Fig. 3). However, after the same process, only 13 miRNAs, which were aberrantly expressed between different stages with stage 0, were unearthed (Fig. 3).
Figure 3.

Venn diagram analysis of aberrantly expressed (A) lncRNA, (B) mRNA, (C) miRNA between CM patients of stages I & II and III & IV with stage 0.
Table 1.
Aberrantly expressed intersection of lncRNAs between stages I & II versus stage 0 and stages III & IV versus stage 0
| lncRNAs | Gene ID | Regulation | Fold change (stages I & II/0) | P‐valuea (stages I & II/0) | FDR (stages I & II/0) | Fold change (stages III & IV/0) | P‐valueb (stages III & IV/0) | FDR (stages III & IV/0) |
|---|---|---|---|---|---|---|---|---|
| LPAL2 | 80,350 | Down | 0.28 | <0.05 | 0.999 | 0.22 | <0.01 | 1 |
| MGC12916 | 84,815 | Down | 0.29 | <0.01 | 0.999 | 0.32 | <0.05 | 1 |
| ATP1A1‐AS1 | 84,852 | Down | 0.54 | <0.05 | 0.999 | 0.53 | <0.05 | 1 |
| LOC90768 | 90,768 | Down | 0.15 | <0.05 | 0.999 | 0.20 | <0.05 | 1 |
| LINC01341 | 149,134 | Down | 0.29 | <0.05 | 0.999 | 0.35 | <0.05 | 1 |
| LOC150776 | 150,776 | Down | 0.65 | <0.05 | 0.999 | 0.61 | <0.05 | 1 |
| DNM1P46 | 196,968 | Down | 0.33 | <0.05 | 0.999 | 0.29 | <0.01 | 1 |
| CYP4F35P | 284,233 | Down | 0.34 | <0.05 | 0.999 | 0.28 | <0.01 | 1 |
| LINC00965 | 340,196 | Down | 0.52 | <0.05 | 0.999 | 0.54 | <0.05 | 1 |
| MRPL42P5 | 359,821 | Down | 0.42 | <0.05 | 0.999 | 0.39 | <0.05 | 1 |
| RPL13AP20 | 387,841 | Down | 0.57 | <0.05 | 0.999 | 0.57 | <0.05 | 1 |
| LOC400794 | 400,794 | Down | 0.39 | <0.05 | 0.999 | 0.39 | <0.05 | 1 |
| LOC401127 | 401,127 | Down | 0.50 | <0.05 | 0.999 | 0.44 | <0.01 | 1 |
| TTLL13P | 440,307 | Down | 0.45 | <0.05 | 0.999 | 0.43 | <0.01 | 1 |
| LOC440461 | 440,461 | Down | 0.50 | <0.05 | 0.999 | 0.46 | <0.01 | 1 |
| SEC1P | 653,677 | Down | 0.49 | <0.05 | 0.999 | 0.42 | <0.01 | 1 |
| SRRM2‐AS1 | 100,128,788 | Down | 0.53 | <0.05 | 0.999 | 0.45 | <0.01 | 1 |
| TEKT4P2 | 100,132,288 | Down | 0.45 | <0.05 | 0.999 | 0.42 | <0.01 | 1 |
| TP73‐AS1 | 57,212 | Up | 3.06 | <0.01 | 0.999 | 2.67 | <0.05 | 1 |
| LINC01102 | 150,568 | Up | 5.65 | <0.05 | 0.999 | 4.60 | <0.05 | 1 |
| LINC00937 | 389,634 | Up | 2.22 | <0.05 | 0.999 | 2.37 | <0.05 | 1 |
| ZNF321P | 399,669 | Up | 2.39 | <0.05 | 0.999 | 2.48 | <0.05 | 1 |
| HCG11 | 493,812 | Up | 3.05 | <0.05 | 0.999 | 3.26 | <0.01 | 1 |
| RPL23AP53 | 644,128 | Up | 2.20 | <0.01 | 0.868 | 2.15 | <0.01 | 1 |
| LOC646762 | 646,762 | Up | 2.49 | <0.01 | 0.899 | 2.43 | <0.01 | 1 |
| CDKN2B‐AS1 | 100,048,912 | Up | 3.48 | <0.05 | 0.999 | 3.53 | <0.05 | 1 |
Derived from the comparison between patients of stages I & II and stage 0.
Derived from the comparison between patients of stages III & IV and stage 0.
GO enrichment and KEGG pathway analysis
To gather more information about the molecular functions and signal pathways of the genes that had been selected, GO and KEGG were utilized to analyze the upregulated and downregulated genes, separately. The record with P‐value <0.05 and enrichment >2.0 was preserved. It revealed 223 GO processes of upregulated genes and 147 downregulated genes. In addition, KEGG found 41 categories corresponded to upregulated genes and 14 categories corresponded to downregulated genes. The top 10 of both upregulated and downregulated pathway enrichments are described in Figure 4.
Figure 4.
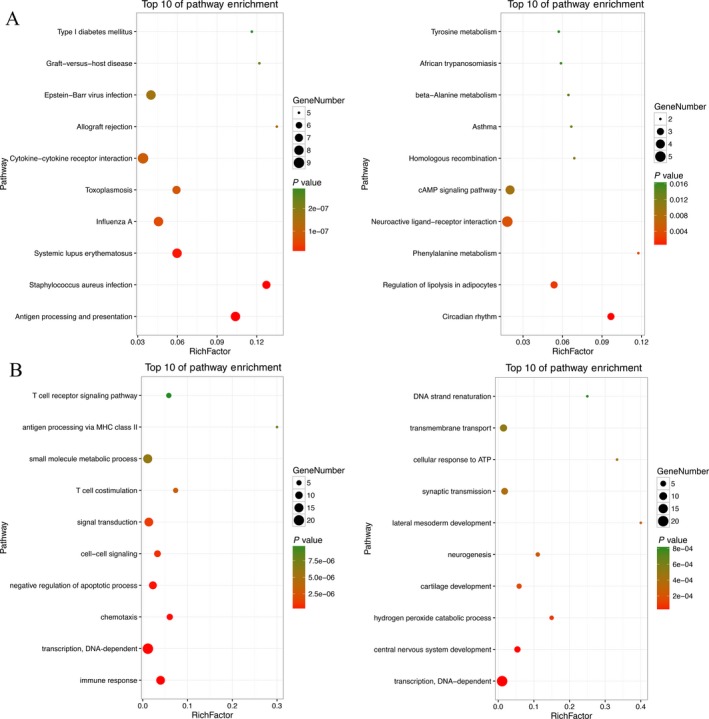
Top 10 enrichment of pathways (A) and GO (B) analysis for aberrantly expressed intersection of mRNAs.
Among the top 10 upregulated pathways, over half of them were related to immunization directly and indirectly, and the pathway of asthma had its presence among the top 10 downregulated pathways, where a vital pathway was identified—the cAMP signaling pathway. Extensively known, the cAMP signaling pathway is involved in many living activities and biological process, mainly through its deep effect on cell motility, proliferation, and apoptosis, which are remarkably associated with the genesis of carcinoma 18, 19, 20. In addition, three pathways concerning the metabolism of three amino acids, including phenylalanine, tyrosine, and beta‐alanine, were noted. Phenylalanine is one of the eight essential amino acids that cannot be synthesized de novo in the human body and other living beings but works after being transformed into tyrosine by phenylalanine hydroxylase. In succession, as a raw material, tyrosine can be converted to melanin in melanocytes.
The top 10 upregulated and downregulated GO terms are also identified in Figure 4. In detail, most upregulated genes took part in communication and signal transduction of cells, especially T cells, while downregulated genes participated in the development of multiple systems. Collectively, GO enrichment analysis indicated immunization in the metastasis of CM and that the top upregulated enriched GO term was the immune response.
ceRNA and PPI network
To set up the lncRNA–miRNA–mRNA ceRNA network, first the 13 aberrantly expressed miRNAs and 26 specific lncRNAs were utilized to explore the targeted relationship with the utilization of miRanda tools and starBase V2.0 database. With this, 23 lncRNAs, which have specific MREs, had a regulated relationship with 13 miRNAs (Table 2). Next, mRNAs targeted by miRNAs were uncovered based on these 13 miRNAs and the 311 mRNAs, which were preliminarily considered associated with the deterioration of CM. Afterward, 122 mRNAs were left in the list (Table 3). However, three (hsa‐miR‐192‐5p, hsa‐miR‐194‐5p, and hsa‐miR‐891a‐5p) of the thirteen miRNAs did not have related negatively regulated lncRNAs. Finally, the numbers of key lncRNAs, miRNAs, and mRNAs reduced to 20, 10, and 54, respectively, which constituted the ceRNA network (Fig. 5, and the alignments between genes are presented in Table S1 and S2). Moreover, the PPI network furnished 106 genes, which were regarded as central genes (Fig. 6).
Table 2.
miRNAs and specific targeted intersection of key lncRNAs associated with the development of CM
| Key lncRNAs | miRNAs |
|---|---|
| ATP1A1‐AS1 | hsa‐miR‐106b‐5p,hsa‐miR‐133a‐3p,hsa‐miR‐193b‐3p,hsa‐miR‐194‐3p |
| CDKN2B‐AS1 | hsa‐miR‐106b‐5p,hsa‐miR‐194‐3p,hsa‐miR‐33a‐3p,hsa‐miR‐3677‐3p,hsa‐miR‐658,hsa‐miR‐708‐5p |
| CYP4F35P | hsa‐miR‐33a‐3p, hsa‐miR‐708‐5p |
| DNM1P46 | hsa‐miR‐1‐3p, hsa‐miR‐106b‐5p, hsa‐miR‐133a‐3p, hsa‐miR‐193b‐3p, hsa‐miR‐658, hsa‐miR‐708‐5p |
| HCG11 | hsa‐miR‐106b‐5p, hsa‐miR‐194‐3p |
| LINC00937 | hsa‐miR‐3917 |
| LINC00965 | hsa‐miR‐193b‐3p, hsa‐miR‐194‐3p, hsa‐miR‐658 |
| LINC01102 | hsa‐miR‐133a‐3p, hsa‐miR‐3677‐3p |
| LINC01341 | hsa‐miR‐3677‐3p |
| LOC150776 | hsa‐miR‐193b‐3p, hsa‐miR‐194‐3p, hsa‐miR‐3677‐3p, hsa‐miR‐658, hsa‐miR‐708‐5p |
| LOC400794 | hsa‐miR‐133a‐3p, hsa‐miR‐658 |
| LOC401127 | hsa‐miR‐193b‐3p, hsa‐miR‐658 |
| LOC646762 | hsa‐miR‐106b‐5p, hsa‐miR‐194‐3p, hsa‐miR‐658, hsa‐miR‐708‐5p |
| LOC90768 | hsa‐miR‐1‐3p, hsa‐miR‐192‐5p, hsa‐miR‐133a‐3p, hsa‐miR‐194‐3p, hsa‐miR‐3677‐3p, hsa‐miR‐3917, hsa‐miR‐658, hsa‐miR‐708‐5p |
| LPAL2 | hsa‐miR‐193b‐3p, hsa‐miR‐194‐3p |
| MGC12916 | hsa‐miR‐193b‐3p, hsa‐miR‐194‐3p, hsa‐miR‐33a‐3p, hsa‐miR‐658, hsa‐miR‐708‐5p |
| MRPL42P5 | hsa‐miR‐1‐3p, hsa‐miR‐33a‐3p, hsa‐miR‐658 |
| RPL13AP20 | hsa‐miR‐3677‐3p, hsa‐miR‐658 |
| RPL23AP53 | hsa‐miR‐106b‐5p, hsa‐miR‐194‐5p,hsa‐miR‐708‐5p,hsa‐miR‐891a‐5p |
| SEC1P | hsa‐miR‐3917,hsa‐miR‐658 |
| SRRM2‐AS1 | hsa‐miR‐193b‐3p,hsa‐miR‐3677‐3p |
| TEKT4P2 | hsa‐miR‐193b‐3p,hsa‐miR‐194‐3p,hsa‐miR‐194‐5p,hsa‐miR‐3677‐3p,hsa‐miR‐658,hsa‐miR‐708‐5p |
| TP73‐AS1 | hsa‐miR‐106b‐5p,hsa‐miR‐193b‐3p,hsa‐miR‐194‐3p,hsa‐miR‐194‐5p,hsa‐miR‐3677‐3p, hsa‐miR‐3917, hsa‐miR‐658 |
| TTLL13P | hsa‐miR‐193b‐3p |
| ZNF321P | hsa‐miR‐106b‐5p,hsa‐miR‐133a‐3p,hsa‐miR‐708‐5p |
Table 3.
miRNAs and specific targeted mRNAs in the progression of CM
| miRNAs | mRNAs |
|---|---|
| hsa‐miR‐106b‐5p | AMIGO2, ARHGEF10, ATP2B2, BNIP3L, CC2D1A, CCDC25, CLN8, CNNM3, CTSB, DIS3L, EPX, FBXO39, FKRP, GNB4, HSD17B1, IL21R, IL27RA, KCNK10, MSR1, NME6, PAG1, PER2, PRKX, RAB11FIP1, RAB31, RPS6KA2, STK33, TBX3, TNFRSF21, VWA2, ZNF234, ZNF28, ZNF471, ZNF813 |
| hsa‐miR‐133a‐3p | CXCL11, DDIT4, DIEXF, DLGAP1, FAM57B, FCGR3A, PAG1, POU3F3, TTN |
| hsa‐miR‐1‐3p | ASH2L, BMPER, COL25A1, CYFIP2, DIP2C, EPHB1, HLA‐DQA1, INHBA, KCTD16, RGS5, SH3BP5, TNS3 |
| hsa‐miR‐192‐5p | ATP6V1C1, BMPER, C8orf46, CDS1, DDHD2, GOLGA6B, MKNK2, UMODL1, VWA2 |
| hsa‐miR‐193b‐3p | BMP8A, CEMIP, CTSC, EEF2, EOMES, KCNK10, PAG1, PPAN‐P2RY11ZNF385B |
| hsa‐miR‐194‐3p | ADM5, ATP2B2, ATXN7L2, BMP8A, CCR5, CNNM3, CNTN2, CRTC1, DIO3, DOK7, FKRP, GATAD2B, GPRC5B, KIAA0556, LEPROTL1, LYVE1, NHLH1, NME9, NOXA1, PAG1, PDK2, REEP1, RPL28, SIPA1L3, TBC1D7, TREML1, VGLL3, ZNF471 |
| hsa‐miR‐194‐5p | ARHGEF35, DDX11, DIP2C, DMRT2, EOMES, PEX2, SFMBT1, TENM3, TMEM65 |
| hsa‐miR‐33a‐3p | ADAMDEC1, CCR5, CEMIP, CHCHD7, CHRNA3, CXCL11, DIO3, DIP2C, DLGAP1, DMRTC1B, ZMYND11 |
| hsa‐miR‐3677‐3p | CNTN2, DOK7, SLC18A1, VIPR2, ZMIZ1, ZNF471 |
| hsa‐miR‐3917 | ATP6V1C1, CRTC1, IL27RA, SFMBT1, ZNF28, ZNF808 |
| hsa‐miR‐658 | APOE, CPNE9, DDX11, DIEXF, EBF2, ELMSAN1, GABRR1, HOXA7, MKNK2, OTP, PDK2, PLIN4, PNMA2, RAB31, SLC18A1, TUSC5, ZMIZ1, ZNF28, ZNF609 |
| hsa‐miR‐708‐5p | CCDC25, CEMIP, CMTM7, CTSC, CXCL9, DIEXF, ELMSAN1, GATAD2B, LGSN, REEP1, SMIM19, TNS3, TPMT, ZMYND11, ZNF234 |
| hsa‐miR‐891a‐5p | KIAA0556 |
Figure 5.
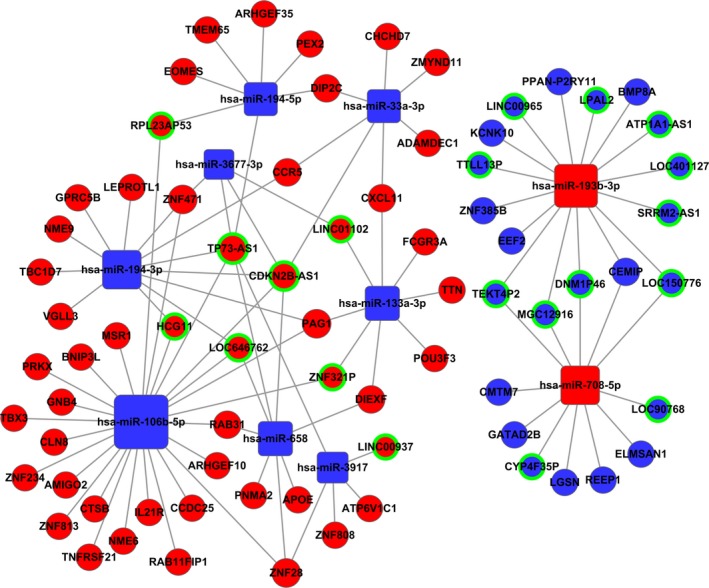
Competing endogenous network. Squares represent miRNAs, balls represent mRNAs, and balls with a green circle around represents lncRNAs. Red means upregulated genes, while blue means downregulated genes.
Figure 6.
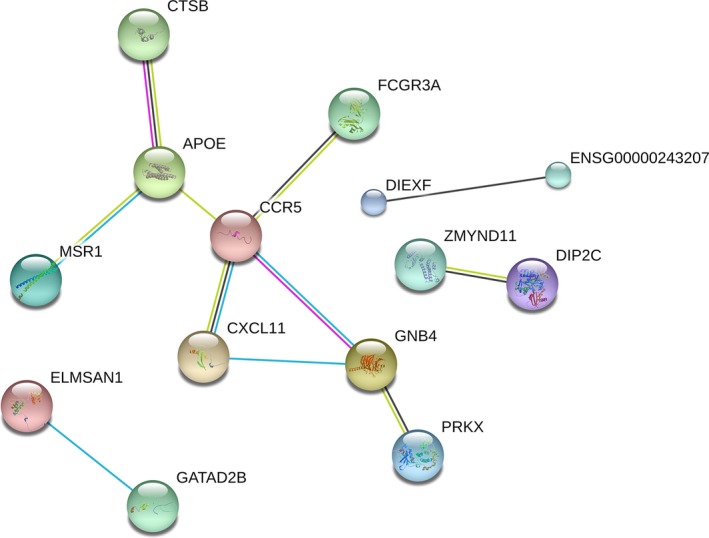
The protein–protein interaction network constructed for the aberrantly expressed genes.
Association between key genes and clinical features
Now that the ceRNA network provided vast potential genes that consisted of 20 lncRNAs, 10 miRNAs, and 54 mRNAs, the association between these genes and the clinical features can be assessed to preliminarily reveal to what degree and in which aspect these genes play a role in the progression of CM.
The results of lncRNAs are shown in Table 4, suggesting that 14 lncRNAs were markedly associated with the CM TNM stages, tumor metastasis, and the patients' outcome. Unfortunately, none of the lncRNAs in the ceRNA network were positive in the comparisons of other clinical features such as gender, race and pathological stage. Notably, SRRM2‐AS1, ATP1A1‐AS1 and RPL23AP53 were involved in TNM stages and tumor metastasis. In addition, LOC401127, which has a connection to tumor metastasis, was involved in the outcome of patients as well.
Table 4.
The correlation between specific lncRNAs from the ceRNA network and clinical features of CM patients
| Clinical features | Upregulated lncRNAs | Downregulated lncRNAs |
|---|---|---|
| Gender (Female vs. Male) | ||
| Race (White vs. Asian) | ||
| Tumor pathological stage (III & IV vs. I & II) | ||
| TNM staging system (T3 + T4 vs. T1 + T2) | ATP1A1‐AS1, RPL23AP53, SRRM2‐AS1, DNM1P46 | |
| Tumor metastasis (primary solid tumor vs. metastatic tumor) | LINC00965, LOC401127 | LOC150776, TP73‐AS1, LPAL2, SRRM2‐AS1, ATP1A1‐AS1, LOC646762, RPL23AP53, LINC01102, TEKT4P2 |
| Patient outcome (dead vs. alive) | LOC401127, LOC90768 | LINC00937 |
Next, there are eight miRNAs in Table 5 having their positions in the development of CM, but none of them were related to race. Similarly, as the lncRNAs mentioned above, some miRNAs (hsa‐miR‐194‐5p, hsa‐miR‐194‐3p, hsa‐miR‐193b‐3p, and hsa‐miR‐3677‐3p) were proved to have associations with more than one clinical feature.
Table 5.
The correlation between specific miRNAs from the ceRNA network and clinical features of CM patients
| Clinical features | Upregulated miRNAs | Downregulated miRNAs |
|---|---|---|
| Gender (Female vs. Male) | hsa‐miR‐194‐5p | |
| Race (White vs. Asian) | ||
| Tumor pathological stage (III & IV vs. I & II) | hsa‐miR‐133a‐3p | |
| TNM staging system (T3 + T4 vs. T1 + T2) | hsa‐miR‐194‐3p, hsa‐miR‐193b‐3p | hsa‐miR‐3677‐3p |
| Tumor metastasis (metastatic tumor vs. primary solid tumor) | hsa‐miR‐3917, hsa‐miR‐194‐5p | hsa‐miR‐194‐3p, hsa‐miR‐193b‐3p |
| Patient outcome (dead vs. alive) | hsa‐miR‐3677‐3p | hsa‐miR‐194‐3p, hsa‐miR‐708‐5p |
Last, each clinical feature with its related mRNAs and the relationships are shown in Table 6, including 37 mRNAs in total. Among them, 10 mRNAs (APOE, ZNF808, TMEM65, EEF2, ELMSAN1, CLN8, 8MP8A, DIP2C, MSR1, and GNB4) were associated with two clinical features, and four mRNAs (IL21R, FCGR3A, CXCL11, and CCR5) had connections with three clinical features, not to mention the star gene, ADAMDEC1, which had an association with the tumor pathological stage, TNM staging system, tumor metastasis, and patients' outcome.
Table 6.
The correlation between specific mRNAs from the ceRNA network and clinical features of CM patients
| Clinical features | Upregulated mRNAs | Downregulated mRNAs |
|---|---|---|
| Gender (Female vs. Male) | PRKX, APOE | ZNF808, TMEM65, ZMYND11 |
| Race (White vs. Asian) | CCDC25, LEPROTL1 | TMEM65 |
| Tumor pathological stage (III & IV vs. I & II) | ADAMDEC1, IL21R | EEF2, ELMSAN1 |
| TNM staging system (T3 + T4 vs. T1 + T2) | CLN8, BMP8A, DIP2C | FCGR3A, ADAMDEC1, MSR1, CXCL11, IL21R, EEF2, CCR5, GNB4, LGSN |
| Tumor metastasis (metastatic tumor vs. primary solid tumor) | FCGR3A, IL21R, ADAMDEC1, MSR1, CCR5, AMIGO2, GNB4, CXCL11, CEMIP, ZNF385B | KCNK10, NME6, CLN8, TBC1D7, DIP2C, CHCHD7, PAG1, ZNF808, ELMSAN1, BMP8A, POU3F3 |
| Patients' outcome (dead vs. alive) | VGLL3, DIEXF, ZNF471, REEP1, ZNF813, TBX3, ZNF234, ZNF28 | CXCL11, IL21R, CCR5, ADAMDEC1, APOE, FCGR3A |
To illustrate the unambiguous details about the relationship between these key genes in the ceRNA network and the outcome of CM patients, the univariate Cox proportional hazards regression model was performed, which elaborated the information of overall survival. The results implicated the expression of two lncRNAs, one miRNA and eight mRNAs, which were statistically different, as shown in Figure 7. Apparently, except for the only key miRNA, the more the other 10 genes were expressed, the longer the patients' survival.
Figure 7.
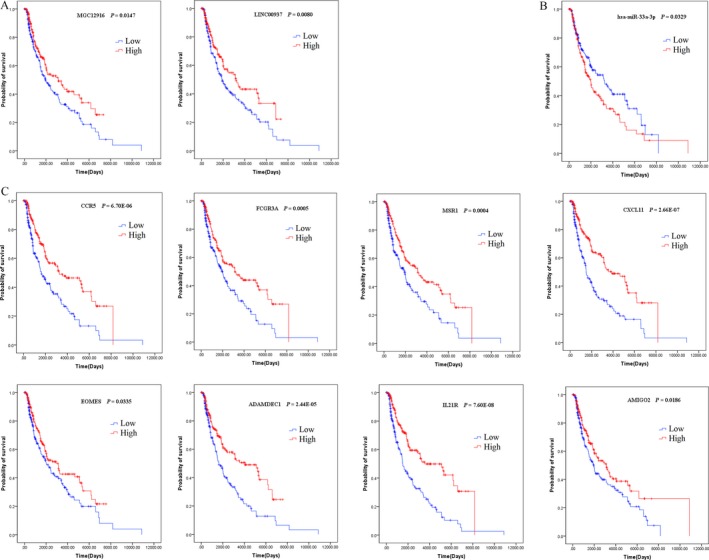
Kaplan–Meier survival curves for two lncRNAs (A), one miRNA (B), and six mRNAs (C) associated with overall survival.
Discussion
To uncover the expression patterns of lncRNAs in the carcinomatosis of CM and explore the possibility of lncRNAs as biomarkers that somewhat assist the clinical practice, the TCGA database was employed. The bioinformatics analysis of RNA sequencing data of CM from TCGA provided the ceRNA network with descriptions of the interplay between key lncRNAs and other genes. In addition, when these genes were put into enrichment analysis, the results implied that immunization was considered to play a crucial role in the development of CM, as plenty of pathways and functions were associated with immunity. To date, dozens of pathways, such as the integrin/FAK signaling pathway 21, the KMT2A/hTERT signaling pathway 22, the PI3K/AKT/mTOR autophagy signaling pathway 23, and the Wnt signaling pathway 24, have been determined to somewhat govern the development of CM by disrupting the biological functions of melanocytes. Further statistical analysis of the association between gene expression and the clinical information of CM highlighted several genes, including two lncRNAs, which may influence the outcome of CM patients.
To date, there are a number of studies about microRNAs and CM 25, 26, 27, 28 but fewer about lncRNAs and CM. LncRNAs ANRIL 29, BANCR 30, GAS5 31, 32, MALAT1 33, PVT1 34, 35, SAMMON 36, 37, SPRIGHTLY 38, 39, SPRY4‐1T1 40, 41, and other lncRNAs have been studied for the regulation of melanocyte proliferation, migration, invasion, and other cell biological functions associated with the development and metastasis of CM. However, there are few studies that have finally drawn an integrative and systematic interaction of genes. Zhang et al. 42 downloaded information about CM patients and RNA sequencing data from TCGA. Although the routines and methods of bioinformatics and survival analysis are similar with this study, the results of their study determined two regulatory networks of prognostic risk lncRNAs and microRNAs, their target genes, and a PPI network. Because of the addition of the E‐MTAB‐1862 dataset and the different division of groups, there seemed to be no resemblance between the results of their study and this one. Although they have conducted quantitative real‐time polymerase chain reaction to validate the results of their bioinformatics analysis, the results of the experiments should be more convincing with more samples, which will be the next step of this study.
The survival analysis spotted two lncRNAs: MGC12916 and LINC00397. Unfortunately, MGC12916 had nothing to do with other clinical information, and LINC00397 had an association with the outcome of CM patients, which is consistent with the survival analysis. In addition, these two lncRNAs are protective factors of metastasis in CM. No studies on these two lncRNAs have been published.
However, with the inclusion of lncRNAs in the ceRNA network, there were three mRNAs that were statistically significant in the survival analysis and directly linked with hsa‐miR‐33a‐3p (CCR5, CXCL11, and ADAMDEC1) and hsa‐miR‐106b‐5p (AMIGO2, IL21R, and MSR1), of which hsa‐miR‐33a‐3p was the risk factor from the survival analysis. This may hint that perhaps the dysregulation of mRNAs has more consequential effects on the development of CM. Still, the ceRNA network provided an outstanding map to explore key genes, which can serve as biomarkers for the prognosis and carcinomatosis of CM.
Supporting information
Table S1. Predictions of miRNA‐lncRNA base pairing in miRanda tools.
Table S2. Predictions of miRNA–mRNA base pairing in miRanda tools.
Cancer Medicine 2018; 7(4):1019–1029
Contributor Information
Yan Wang, Email: drwangyan@163.com.
Geyu Liang, Email: lianggeyu@163.com.
References
- 1. Aftab, M. N. , Dinger M. E., and Perera R. J.. 2014. The role of microRNAs and long non‐coding RNAs in the pathology, diagnosis, and management of melanoma. Arch. Biochem. Biophys. 563:60–70. [DOI] [PMC free article] [PubMed] [Google Scholar]
- 2. Akhbari, P. , Whitehouse A., and Boyne J. R.. 2014. Long non‐coding RNAs drive metastatic progression in melanoma (Review). Int. J. Oncol. 2014:2181–2186. [DOI] [PubMed] [Google Scholar]
- 3. Bayless, H. , and Schneider S.. 2015. Nivolumab: immunotherapy in malignant melanoma. Clin. J. Oncol. Nurs. 19:430–432. [DOI] [PubMed] [Google Scholar]
- 4. Cabili, M. N. , Trapnell C., Goff L., Koziol M., Tazon‐Vega B., Regev A., et al. 2011. Integrative annotation of human large intergenic noncoding RNAs reveals global properties and specific subclasses. Genes Dev. 25:1915–1927. [DOI] [PMC free article] [PubMed] [Google Scholar]
- 5. Chen, L. , Yang H., Xiao Y., Tang X., Li Y., Han Q., et al. 2016. LncRNA GAS5 is a critical regulator of metastasis phenotype of melanoma cells and inhibits tumor growth in vivo. Oncol. Targets Ther. 9:4075–4087. [DOI] [PMC free article] [PubMed] [Google Scholar]
- 6. Chen, L. , Yang H., Xiao Y., Tang X., Li Y., Han Q., et al. 2016. Lentiviral‐mediated overexpression of long non‐coding RNA GAS5 reduces invasion by mediating MMP2 expression and activity in human melanoma cells. Int. J. Oncol. 48:1509–1518. [DOI] [PubMed] [Google Scholar]
- 7. Chen, X. , Gao G., Liu S., Yu L., Yan D., Yao X., et al. 2017. Long noncoding RNA PVT1 as a novel diagnostic biomarker and therapeutic target for melanoma. Biomed. Res. Int. 2017:7038579. [DOI] [PMC free article] [PubMed] [Google Scholar]
- 8. Chen, X. , Guo W., Xu X. J., Su F., Wang Y., Zhang Y., et al. 2017. Melanoma long non‐coding RNA signature predicts prognostic survival and directs clinical risk‐specific treatments. J. Dermatol. Sci. 85:226–234. [DOI] [PubMed] [Google Scholar]
- 9. Derrien, T. , Johnson R., Bussotti G., Tanzer A., Djebali S., Tilgner H., et al. 2012. The GENCODE v7 catalog of human long noncoding RNAs: analysis of their gene structure, evolution, and expression. Genome Res. 22:1775–1789. [DOI] [PMC free article] [PubMed] [Google Scholar]
- 10. Fattore, L. , Costantini S., Malpicci D., Ruggiero C. F., Ascierto P. A., Croce C. M., et al. 2017. MicroRNAs in melanoma development and resistance to target therapy. Oncotarget 8:22262–22278. [DOI] [PMC free article] [PubMed] [Google Scholar]
- 11. Flockhart, R. J. , Webster D. E., Qu K., Mascarenhas N., Kovalski J., Kretz M., et al. 2012. BRAFV600E remodels the melanocyte transcriptome and induces BANCR to regulate melanoma cell migration. Genome Res. 22:1006–1014. [DOI] [PMC free article] [PubMed] [Google Scholar]
- 12. Goding, C. R. 2016. Targeting the lncRNA SAMMSON reveals metabolic vulnerability in melanoma. Cancer Cell 29:619–621. [DOI] [PubMed] [Google Scholar]
- 13. Guo, L. L. , Song C. H., Wang P., Dai L. P., Zhang J. Y., and Wang K. J.. 2015. Competing endogenous RNA networks and gastric cancer. World J. Gastroenterol. 21:11680–11687. [DOI] [PMC free article] [PubMed] [Google Scholar]
- 14. Huebner, R. H. , Park K. C., Shepherd J. E., Schwimmer J., Czernin J., Phelps M. E., et al. 2000. A meta‐analysis of the literature for whole‐body FDG PET detection of recurrent colorectal cancer. J. Nucl. Med. 41:1177–1189. [PubMed] [Google Scholar]
- 15. Hung, T. , Wang Y., Lin M. F., Koegel A. K., Kotake Y., Grant G. D., et al. 2011. Extensive and coordinated transcription of noncoding RNAs within cell‐cycle promoters. Nat. Genet. 43:621–629. [DOI] [PMC free article] [PubMed] [Google Scholar]
- 16. Jiang, W. , Jia P., Hutchinson K. E., Johnson D. B., Sosman J. A., and Zhao Z.. 2015. Clinically relevant genes and regulatory pathways associated with NRASQ61 mutations in melanoma through an integrative genomics approach. Oncotarget 6:2496–2508. [DOI] [PMC free article] [PubMed] [Google Scholar]
- 17. Lee, B. , Sahoo A., Marchica J., Holzhauser E., Chen X., Li J. L., et al. 2017. The long noncoding RNA SPRIGHTLY acts as an intranuclear organizing hub for pre‐mRNA molecules. Sci. Adv. 3:e1602505. [DOI] [PMC free article] [PubMed] [Google Scholar]
- 18. Lefkimmiatis, K. , and Zaccolo M.. 2014. cAMP signaling in subcellular compartments. Pharmacol. Ther. 143:295–304. [DOI] [PMC free article] [PubMed] [Google Scholar]
- 19. Lelli, D. , Pedone C., and Sahebkar A.. 2017. Curcumin and treatment of melanoma: the potential role of microRNAs. Biomed. Pharmacother. 88:832–834. [DOI] [PubMed] [Google Scholar]
- 20. Leucci, E. , Coe E. A., Marine J. C., and Vance K. W.. 2016. The emerging role of long non‐coding RNAs in cutaneous melanoma. Pigment Cell Melanoma Res. 29:619–626. [DOI] [PubMed] [Google Scholar]
- 21. Leucci, E. , Vendramin R., Spinazzi M., Laurette P., Fiers M., Wouters J., et al. 2016. Melanoma addiction to the long non‐coding RNA SAMMSON. Nature 531:518–522. [DOI] [PubMed] [Google Scholar]
- 22. Li, R. , Zhang L., Jia L., Duan Y., Li Y., Bao L., et al. 2014. Long non‐coding RNA BANCR promotes proliferation in malignant melanoma by regulating MAPK pathway activation. PLoS ONE 9:e100893. [DOI] [PMC free article] [PubMed] [Google Scholar]
- 23. Liu, T. , Shen S. K., Xiong J. G., Xu Y., Zhang H. Q., Liu H. J., et al. 2016. Clinical significance of long noncoding RNA SPRY4‐IT1 in melanoma patients. FEBS Open Bio. 6:147–154. [DOI] [PMC free article] [PubMed] [Google Scholar]
- 24. Mazar, J. , Zhao W., Khalil A. M., Lee B., Shelley J., Govindarajan S. S., et al. 2014. The functional characterization of long noncoding RNA SPRY4‐IT1 in human melanoma cells. Oncotarget 5:8959–8969. [DOI] [PMC free article] [PubMed] [Google Scholar]
- 25. Meng, F. , Zhang Y., Li X., Wang J., and Wang Z.. 2017. Clinical significance of miR‐138 in patients with malignant melanoma through targeting of PDK1 in the PI3K/AKT autophagy signaling pathway. Oncol. Rep. 38:1655–1662. [DOI] [PubMed] [Google Scholar]
- 26. Messeguer, F. , Agusti‐Mejias A., Traves V., Alegre V., Oliver V., and Nagore E.. 2013. Risk factors for the development of locoregional cutaneous metastases as the sole form of recurrence in patients with melanoma. Actas Dermosifiliogr 104:53–60. [DOI] [PubMed] [Google Scholar]
- 27. O'Hayre, M. , Vazquez‐Prado J., Kufareva I., Stawiski E. W., Handel T. M., Seshagiri S., et al. 2013. The emerging mutational landscape of G proteins and G‐protein‐coupled receptors in cancer. Nat. Rev. Cancer 13:412–424. [DOI] [PMC free article] [PubMed] [Google Scholar]
- 28. Robert, J. 2010. Cell signalling and cancer. Bull. Cancer 97:1215–1222. [DOI] [PubMed] [Google Scholar]
- 29. Rubin, K. M. , and Lawrence D. P.. 2009. Your patient with melanoma: staging, prognosis, and treatment. Oncology (Williston Park) 23(8 Suppl):13–21. [PubMed] [Google Scholar]
- 30. Sarkar, D. , Leung E. Y., Baguley B. C., Finlay G. J., and Askarian‐Amiri M. E.. 2015. Epigenetic regulation in human melanoma: past and future. Epigenetics 10:103–121. [DOI] [PMC free article] [PubMed] [Google Scholar]
- 31. Schmidt, K. , Joyce C. E., Buquicchio F., Brown A., Ritz J., Distel R. J., et al. 2016. The lncRNA SLNCR1 mediates melanoma invasion through a conserved SRA1‐like region. Cell Rep. 15:2025–2037. [DOI] [PMC free article] [PubMed] [Google Scholar]
- 32. Shain, A. H. , and Bastian B. C.. 2016. From melanocytes to melanomas. Nat. Rev. Cancer 16:345–358. [DOI] [PubMed] [Google Scholar]
- 33. Sun, Y. , Cheng H., Wang G., Yu G., Zhang D., Wang Y., et al. 2017. Deregulation of miR‐183 promotes melanoma development via lncRNA MALAT1 regulation and ITGB1 signal activation. Oncotarget 8:3509–3518. [DOI] [PMC free article] [PubMed] [Google Scholar]
- 34. Varamo, C. , Occelli M., Vivenza D., Merlano M., and Lo Nigro C.. 2017. MicroRNAs role as potential biomarkers and key regulators in melanoma. Genes Chromosom. Cancer 56:3–10. [DOI] [PubMed] [Google Scholar]
- 35. Wang, B. J. , Ding H. W., and Ma G. A.. 2017. Long noncoding RNA PVT1 promotes melanoma progression via endogenous sponging MiR‐26b. Oncol. Res. doi: 10.3727/096504017X14920318811730. [DOI] [PMC free article] [PubMed] [Google Scholar]
- 36. Wang, H. C. , Chu Y. L., Hsieh S. C., and Sheen L. Y.. 2017. Diallyl trisulfide inhibits cell migration and invasion of human melanoma a375 cells via inhibiting integrin/facal adhesion kinase pathway. Environ. Toxicol. 2017(11):2352–2359. [DOI] [PubMed] [Google Scholar]
- 37. Wang, J. J. , Li Z. F., Li X. J., Han Z., Zhang L., and Liu Z. J.. 2017. Effects of microRNA‐136 on melanoma cell proliferation, apoptosis and epithelial mesenchymal transition by targeting PMEL through the Wnt signaling pathway. Biosci. Rep. 37:BSR20170743. [DOI] [PMC free article] [PubMed] [Google Scholar] [Retracted]
- 38. Wozniak, M. , Mielczarek A., and Czyz M.. 2016. miRNAs in melanoma: tumor suppressors and oncogenes with prognostic potential. Curr. Med. Chem. 23:3136–3153. [DOI] [PubMed] [Google Scholar]
- 39. Xu, S. , Wang H., Pan H., Shi Y., Li T., Ge S., et al. 2016. ANRIL lncRNA triggers efficient therapeutic efficacy by reprogramming the aberrant INK4‐hub in melanoma. Cancer Lett. 381:41–48. [DOI] [PubMed] [Google Scholar]
- 40. Zhang, C. , Song C., Liu T., Tang R., Chen M., Gao F., et al. 2017. KMT2A promotes melanoma cell growth by targeting hTERT signaling pathway. Cell Death Dis. 8:e2940. [DOI] [PMC free article] [PubMed] [Google Scholar]
- 41. Zhao, W. , Mazar J., Lee B., Sawada J., Li J. L., Shelley J., et al. 2016. The long noncoding RNA SPRIGHTLY regulates cell proliferation in primary human melanocytes. J. Invest. Dermatol. 136:819–828. [DOI] [PMC free article] [PubMed] [Google Scholar]
- 42. Zhang, Q. , Wang Y., Liang J., Tian Y., Zhang Y., and Tao K.. 2017. Bioinformatics analysis to identify the critical genes, microRNAs and long noncoding RNAs in melanoma. Medicine (Baltimore) 96:e7497. [DOI] [PMC free article] [PubMed] [Google Scholar]
Associated Data
This section collects any data citations, data availability statements, or supplementary materials included in this article.
Supplementary Materials
Table S1. Predictions of miRNA‐lncRNA base pairing in miRanda tools.
Table S2. Predictions of miRNA–mRNA base pairing in miRanda tools.