

Summary
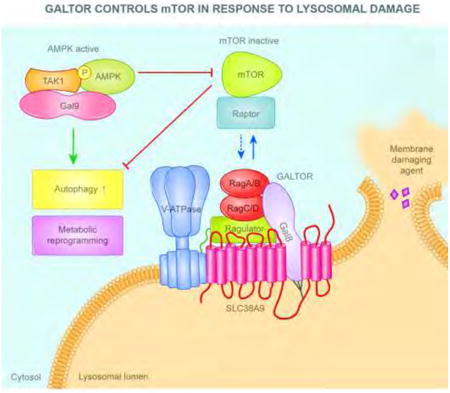
The Ser/Thr protein kinase mTOR controls metabolic pathways, including the catabolic process of autophagy. Autophagy plays additional, catabolism-independent roles in homeostasis of cytoplasmic endomembranes and whole organelles. How signals from endomembrane damage are transmitted to mTOR to orchestrate autophagic responses is not known. Here we show that mTOR is inhibited by lysosomal damage. Lysosomal damage, recognized by galectins, leads to association of galectin-8 (Gal8) with the mTOR apparatus on the lysosome. Gal8 inhibits mTOR activity through its Ragulator-Rag signaling machinery, whereas galectin-9 activates AMPK in response to lysosomal injury. Both systems converge upon downstream effectors including autophagy and defense against Mycobacterium tuberculosis. Thus, a novel galectin-based signal-transduction system, termed here GALTOR, intersects with the known regulators of mTOR on the lysosome and controls them in response to lysosomal damage.
Keywords: mTOR, AMPK, autophagy, galectins, lysosome, catabolism, TFEB, LC3, APEX2, TAK1
Graphical abstract
Jia et al., describe a galectin-based apparatus, termed GALTOR, which in response to lysosomal damage inhibits mTOR and activates AMPK. Galectin-8 suppresses mTOR activity through the Ragulator-Rag machinery, whereas Galectin-9 activates AMPK. This provides a paradigm shift regarding the function of galectins and quality control inputs to mTOR and AMPK.
Introduction
Cellular responses to changing metabolic and energy states are under the control by the Ser/Thr protein kinases mTOR (Saxton and Sabatini, 2017) and AMPK (Garcia and Shaw, 2017), which orchestrate anabolic and catabolic pathways including the autophagosomal-lysosomal system (Mizushima et al., 2011). AMPK and mTOR reciprocally control autophagy when cells starve. mTOR acts as a negative regulator by phosphorylating inhibitory sites on regulators of autophagy including ULK1 (Kim et al., 2011) as well as on MiT/TFE family factors including TFEB, a transcriptional regulator of the lysosomal system (Napolitano and Ballabio, 2016). In contrast, AMPK promotes autophagy by phosphorylation of activating sites on autophagy factors including ULK1 (Kim et al., 2011). AMPK and mTOR circuitry overlap, as AMPK inhibits mTOR (Gwinn et al., 2008; Shaw et al., 2004).
Active mTOR localizes to several intracellular compartments (Betz and Hall, 2013) including lysosomes where sensory systems control activity of mTOR-Raptor containing complexes termed mTORC1 (Saxton and Sabatini, 2017). Lysosomal location allows mTOR to integrate signals coming from nutrients (e.g. amino acids and cholesterol) via Rag GTPases and their guanine nucleotide exchange factor (GEF) Ragulator with signals from growth factors via Rheb GTPase (Castellano et al., 2017; Demetriades et al., 2014; Saxton and Sabatini, 2017). Rheb is inhibited by GTPase activating protein (GAP) tuberous sclerosis complex (TSC1/TSC2) in the absence of growth factors (Saxton and Sabatini, 2017), with noted overlaps between growth factors and amino acid sensing (Carroll et al., 2016). Rag heterodimer pairs, comprised of RagA/B/C/D, respond to availability of amino acids (Saxton and Sabatini, 2017), and cholesterol (Castellano et al., 2017). mTOR is recruited to lysosomes via Rags (Sancak et al., 2008), when RagA/B are loaded with GTP through the action of the cognate GEF, a pentameric complex of LAMTOR1-5 (e.g. LAMTOR1/p18, LAMTOR2/p14, etc.) collectively termed “Ragulator” (Bar-Peled et al., 2012). The Ragulator-Rag complex (Sancak et al., 2010) cooperates with vacuolar H+ ATPase (Zoncu et al., 2011) and this mega-complex interacts with the lysosomal amino acid transporter SLC38A9 (Jung et al., 2015; Rebsamen et al., 2015; Wang et al., 2015). SLC38A9 activates Ragulator in response to lysosomal arginine (Saxton and Sabatini, 2017) or lysosomal cholesterol (Castellano et al., 2017). Affinities between different components change in response to inputs, e.g. nutrients such as amino acids or cholesterol activate Ragulator and Rags, reflected in weakening of the interactions between components of the GEF Ragulator complex (e.g. p14) and RagA/B due to increased GTP loading of RagA/B, which, as expected, diminishes their affinity for the congnate GEF (Castellano et al., 2017). As a result, mTOR activity increases as evidenced by phosphorylation of targets such as S6K, 4EBP and ULK1 (Saxton and Sabatini, 2017).
The above processes are complemented by the action of AMPK (Garcia and Shaw, 2017). AMPK directs changes in metabolism under conditions of low energy charge (Garcia and Shaw, 2017). AMPK activates TSC2 (Shaw et al., 2004), a GAP for Rheb, and phosphorylates negative regulatory sites on Raptor (Gwinn et al., 2008), a key mTOR adaptor for upstream regulators and effectors, and thus acts as a negative regulator of mTOR. These antagonistic intersections between mTOR and AMPK in metabolic regulation are reflected in their effects on autophagy.
Autophagy differs from other nutritional responses in that it also plays a key role in cytoplasmic quality control (Mizushima et al., 2011). Autophagy removes protein aggregates (Johansen and Lamark, 2011) and dysfunctional or disused organelles, e.g. lysosomes (Chauhan et al., 2016; Fujita et al., 2013), mitochondria (Lazarou et al., 2015), peroxisomes (Deosaran et al., 2013; Zhang et al., 2015), ER (Khaminets et al., 2015), etc. How mTOR and AMPK are integrated with the quality control functions of autophagy is not well understood. Lysosomal and phagosomal damage are used as a model to study quality control functions of autophagy in cytoplasmic endomembrane maintenance. It has been shown that cytosolic lectins, galectins, can recognize membrane damage by binding to β-galactosides on exofacial (lumenal) membrane leaflets following damage. Galectins form intracellular puncta in response to lysosomal damaging agents such as polymers of Leu-Leu-OMe (LLOMe) (Aits et al., 2015; Thiele and Lipsky, 1990) or glycyl-L-phenylalanine 2-naphththylamide (GPN) (Berg et al., 1994), poking membrane holes, action of bacterial secretory systems permeabilizing vacuoles (Thurston et al., 2012), or effects of inanimate objects (Fujita et al., 2013). In all studies carried out to date the paradigm has been that galectins, e.g. galectin-3 (Gal3) and galectin-8 (Gal8), recognize membrane damage by binding to lumenal β-galactosides once glycoconjugates on exofacial leaflet are exposed to the cytosol, and bind to and recruit autophagic receptors, e.g. NDP52 in the case of Gal8 (Thurston et al., 2012) or TRIM16 in the case of Gal3 (Chauhan et al., 2016). The receptors in turn bind to mammalian Atg8 paralogs to deliver cargo to autophagosomes (Chauhan et al., 2016; Fujita et al., 2013; Thurston et al., 2012). Very little is known whether these membrane damage recognition systems cooperate with mTOR and other signaling to activate autophagy. There are indications that lysosomal damage by GPN (Manifava et al., 2016) or LLOMe (Chauhan et al., 2016) may decrease mTOR activity. However, the mechanism for how membrane damage is recognized and transduced to mTOR has not been defined. Since it is surprisingly insensitive to proton gradient dissipation (Zoncu et al., 2011) it is not trivial to predict consequences of physical damage to lysosomal membranes on mTOR activity.
In this study we report a direct role of Gal8 in control of mTOR, and show evidence for control of AMPK by galectin-9 (Gal9), beyond the concept of passive contributions of galectins as simple tags marking the damaged lysosomes and phagosomes for selective autophagy (Fujita et al., 2013; Thurston et al., 2012). Our work uncovers surprising physical and regulatory relationships between Gal8 and mTOR in the context of endomembrane damage. This represents a paradigm shift in terms of how we presently think galectins work in autophagy, provides a quality control physiological input for mTOR, i.e. lysosomal damage, and delineates how this signal is transduced to mTOR and to its downstream effector targets and processes.
Results
Lysosomal damage inhibits mTOR signaling
The mTORC1 complex localizes to lysosomes (Kim et al., 2008; Sancak et al., 2008) where it responds to nutrient inputs (Castellano et al., 2017; Saxton and Sabatini, 2017). We wondered, whether mTORC1 was also affected by the lysosomal membrane integrity. Herein, we refer to mTORC1 primarily as mTOR as we have not monitored all components of mTORC1 in all experiments. Using GPN to induce lysosomal damage (Berg et al., 1994), we observed diminished mTOR activity as detected by phosphorylation of its substrates S6K1 and ULK1, in a dose response manner (Figure 1A). This effect was reversed upon GPN washout (Figure 1B). GPN inhibited mTOR activity in different cell lines tested and was comparable to the effects of starvation (Figure S1A. Similarly, another lysosomal damaging agent LLOMe (Aits et al., 2015; Thiele and Lipsky, 1990), caused inhibition of mTOR activity (Figure S1B). A non-enzymatic, physical membrane/lysosomal damaging agent, silica (Hornung et al., 2008), also reduced mTOR activity (Figure 1C). The above agents caused lysosomal damage as reflected in diminished LysoTracker Red DND-99 staining (Figure S1C). The effects of GPN on mTOR were confirmed in primary cells, using human peripheral blood monocyte derived macrophages (Figure 1D). mTOR, translocated from lysosomes to the cytosol upon treatment with GPN (Figures 1E, F and S1E), LLOMe, or silica (Figures 1E and S1D, E). LLOMe washout allowed relocalization of mTOR to lysosomes (Figure S1F). Lysosomal damage resulted in functional responses downstream of mTOR. TFEB, a transcriptional regulator controlling expression of the lysosomal/autophagosomal systems (Napolitano and Ballabio, 2016), translocated to the nucleus from the cytoplasm in cells treated with GPN, LLOMe, or silica, comparably to the effects of starvation (Figures 1G and S1G). Autophagy, normally repressed by mTOR (Kim et al., 2011), was activated as well, as indicated by increase in LC3 puncta (Figure 1H) and LC3 lipidation (Figure S1H) and by an increase in ATG13 puncta, a marker specific for autophagy initiation independent of the flux (Karanasios et al., 2016) (Figures 1I and S1I). Thus, lysosomal damage inactivates mTOR (Figure S1J).
Figure 1. Lysosomal damage inhibits mTOR signaling.
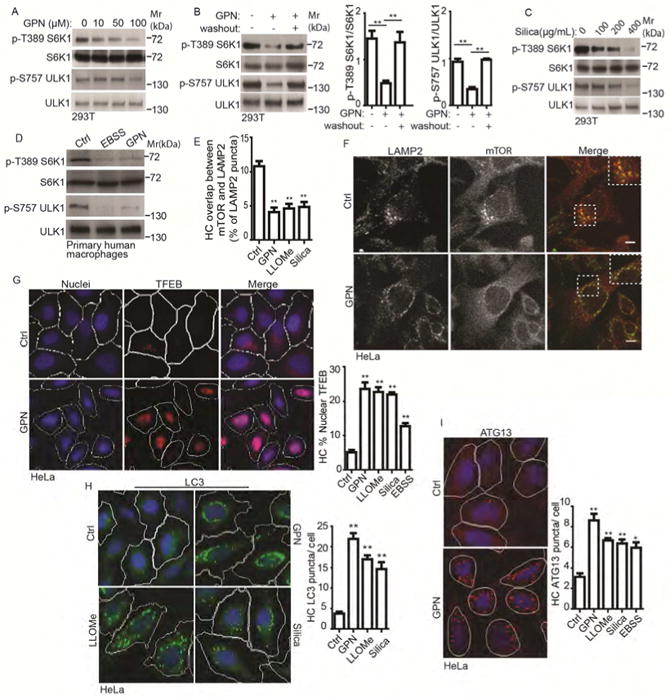
(A) Dose-response mTOR activity (pS6K1 (T389) and pULK1 (S757)), to lysosomal damage by GPN (full medium, 1 h). (B) As in A after 1h washout in full medium. (C) As in A, dose-response to silica in full medium, 1 h. (D) mTOR activity in primary human macrophages treated with 100 μM GPN in full medium or starved in EBSS for 1 h (Ctrl, full medium only). (E) Quantification by automated high-content imaging and analysis (HC) of overlaps between mTOR and LAMP2 (images, Figure S1D); cells treated with 100 μM GPN, 2mM LLOMe, or 400 μg/mL Silica for 1 h in full medium. (F) Immunofluorescence confocal microscopy of mTOR localization relative to LAMP2-positive lysosomes. 100 μM GPN in full medium, 1 h; endogenous LAMP2 (green florescence, Alexa-488) and mTOR (red florescence, Alexa-568). Scale bar, 5 μm. (G) TFEB nuclear translocation; (treatments: 100 μM GPN, 2mM LLOMe, or 400 μg/mL Silica in full medium 1 h. HC (blue: nuclei, Hoechst 33342; red: anti-TFEB antibody, Alexa-568). White masks, computer algorithm-defined cell boundaries (primary objects); pink masks, computer-identified nuclear TFEB based on the average intensity of Alexa-568 fluorescence. (H) Endogenous LC3 puncta quantified by HC. Tretments as in G. Green masks, computer-identified LC3 puncta (target objects). (I) Endogenous ATG13 puncta quantification by HC; treatments as in G. Red masks, computer-identified ATG13 puncta (target objects). Data, means □ SEM; immunoblots: n ≥ 3; HC: n ≥ 3 (each experiment: 500 valid primary objects/cells per well, ≥ 5 wells/sample). *p < 0.05, **p < 0.01, ANOVA. See also Figure S1.
Ragulator-Rag complex responds to lysosomal damage in control of mTOR
We investigated systems (Saxton and Sabatini, 2017) responsible for transducing lysosomal damage signals to mTOR. The tuberous sclerosis complex (TSC) includes TSC2, a GAP inactivating the GTPase Rheb (Inoki et al., 2003; Tee et al., 2003), which in turn activates mTOR (Long et al., 2005; Sancak et al., 2007). We tested TSC-Rheb pathway, and found that GPN inhibited mTOR even in cells null for TSC2 (Castellano et al., 2017) (Figure 2A), indicating that lysosomal damage inactivates mTOR independently of TSC2. Another system, the Ragulator-Rag complex on lysosomes, transduces amino acid abundance (Sancak et al., 2010) and cholesterol (Castellano et al., 2017) signals to mTOR. This system consists of the pentameric Ragulator complex (including LAMTOR1/p18 and LAMTOR2/p14) functioning as a GEF acting upon a quartet of small GTPases, RagA, B, C and D. The Ragulator-Rag interaction increases during amino acid starvation (Bar-Peled et al., 2012) or cholesterol depletion (Castellano et al., 2017), believed to reflect increased affinity of GEFs (in this case Ragulator) for inactive (GDP-bound) cognate GTPases such as Rags (Bar-Peled et al., 2012; Castellano et al., 2017; Zoncu et al., 2011). Thus, we tested whether this system is responsive to lysosomal damage signals. First, as a control, lysosomal damage did not cause disturbance in lysosomal localization of Ragulator (p18) or RagC (Figure S2A). Second, when we quantified in co-IPs the interactions between Ragulator and Rags, as an established readout for the activation state of Rags (Bar-Peled et al., 2012; Castellano et al., 2017; Zoncu et al., 2011), treatment with GPN enhanced interactions between Ragulator (p14 and p18) and RagA/RagC (Figure 2B and S2B).
Figure 2. Ragulator-Rag complex responds to lysosomal damage in control of mTOR.
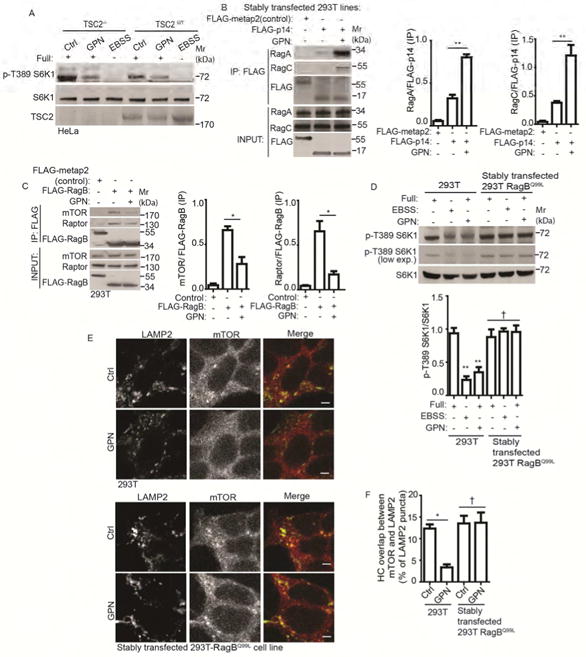
(A) mTOR activity (immunoblot analysis of S6K1 (T389) phosphorylation) in TSC2-deleted (TSC2-/-) and wild type (TSC2WT) cells treated with 100 μM GPN in full medium (Full) or starved in EBSS for 1 h. Ctrl (control): untreated cells. (B) Co-immunoprecipitation analysis of changes in interactions between Ragulator and Rag GTPases following treatment with GPN. HEK293T cells stably expressing FLAG-metap2 (control) or FLAG-p14 were treated with 100 μM GPN in full medium for 1 h. Cell lysates were immunoprecipitated (IP) with anti-FLAG antibody and immunoblotted for endogenous RagA or RagC. (C) Immunoprecipitation (IP) analysis of interactions between RagB and mTOR/Raptor in cells treated with GPN. HEK293T cells overexpressing FLAG-metap2 (control) or FLAG-RagB were treated with 100 μM GPN in full medium for 1 h. Cell lysates were IP-ed with anti-FLAG antibody and immunoblotted for endogenous mTOR or Raptor. (D) mTOR activity in HEK293T cells or HEK293T cells stably expressing constitutively active RagB GTPase (RagBQ99L) treated and analyzed as in A. (E) Immunofluorescence confocal microscopy visualization of mTOR localization relative to LAMP2-positive lysosomes. Cells as in D were treated as in A, and immunostained for endogenous LAMP2 (green florescence, Alexa-488) and mTOR (red florescence, Alexa-568). Scale bar, 1 μm. (F) Quantification by HC of overlaps between mTOR and LAMP2 (images, Figure S2C) in cells as in D, treated as in A. Data, means □ SEM; immunoblots: n ≥ 3; HC: n ≥ 3 (each experiment: 500 valid primary objects/cells per well, ≥ 5 wells/sample). † p ≥ 0.05 (not significant), *p < 0.05, **p < 0.01, ANOVA. See also Figure S2.
Activated Rags bind Raptor and recruit mTOR to the lysosomes (Saxton and Sabatini, 2017). GPN treatment diminished mTOR and Raptor levels in complexes with RagB (Figure 2C) or RagA (Figure S2C) indicative of RagA/B being in an inactive state upon lysosomal damage. Whereas GPN treatment diminished mTOR activity monitored by phosphorylation levels of S6K1, this was not the case in cells stably expressing constitutively active form of RagB (RagBQ99L) (Figure 2D). Moreover, mTOR remained on lysosomes in cells expressing RagBQ99L treated with GPN (Figures 2E, F and S2D). These relationships are summarized in Figure S2E.
Galectin 8 is in dynamic complexes with mTOR and its regulators
How might lysosomal damage be transduced to the Ragulator-Rag system to control mTOR? Galectins, a family of cytosolic lectins (Arthur et al., 2015), can detect endomembrane injury such as the damage artificially caused by LLOMe (Aits et al., 2015) or physiologically during sterile or infection-associated damage of endosomal, phagosomal, and lysosomal membranes (Aits et al., 2015; Chauhan et al., 2016; Fujita et al., 2013; Thurston et al., 2012). Since the Ragulator-Rag system and mTOR are localized on lysosomes, we wondered whether there is a connection between galectins and mTOR regulation. We screened a set of galectins for response to GPN, and observed galectin puncta formation, previously reported to be on lysosomes (Aits et al., 2015), with Gal3, Gal8, Gal9 and, to a lesser extent, galectin-12 (Figure 3A). This pattern was similar, with the exception of galectin-12, to the one observed with Salmonella-induced vesicle damage (Thurston et al., 2012). The two strongest responders, Gal8 and Gal9, formed puncta in response to GPN-induced lysosomal damage but not upon treatment with chloroquine, an acidotropic compound known to neutralize lysosomal pH, or Bafilomycin A1, an inhibitor of vacuolar H+ ATPase (Figure S3A). We next tested whether galectins can be in complexes with mTOR and its regulatory systems. Of the three included galectins (Gal3, Gal8 and Gal9), only Gal8 was found in co-IPs with mTOR and RagA (Figure 3B). Gal8 was localized on the damaged lysosome upon GPN treatment (Figure S3B). Additional components of the Ragulator-Rag system were found in complexes with Gal8 (Figure S3C, D). Association between Gal8 and RagA increased upon treatment with GPN (Figure 3C). This was also the case with Gal8 and Ragulator, since GPN treatment resulted in increased association between Gal8 and LAMTOR2/p14 (Figure 3C). In contrast, GPN reduced levels of Raptor and mTOR in complexes with Gal8 (Figure 3C).
Figure 3. Gal8 is in dynamic complexes with mTOR and its regulators and adaptors.
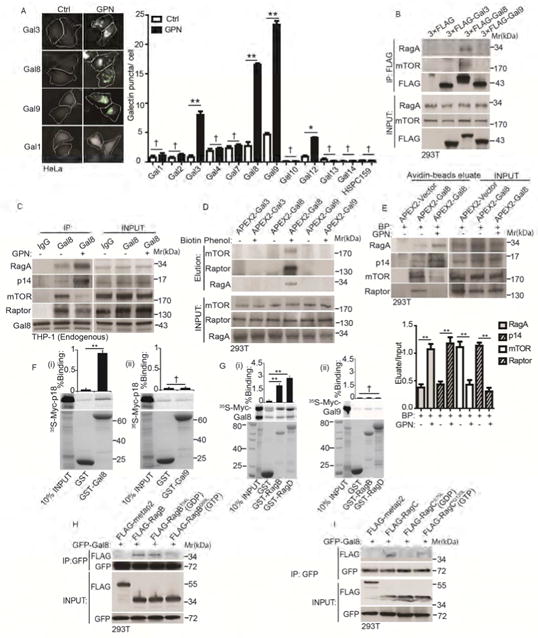
(A) Galectin puncta formation in response to GPN. Cells expressing YFP-galectin fusions were treated with 100 μM GPN or without (Ctrl) in full medium for 1 h and galectin puncta quantified by HC. Left, images of galectins 1, 3, 8, and 9. White masks, algorithm-defined cell boundaries (primary objects); green masks, computer-identified galectin puncta (target objects). (B) Co-immunoprecipitation (Co-IP) analysis of galectins and mTOR or RagA. Cells expressing FLAG-tagged galectins were subjected to anti-FLAG immunoprecipitation followed by immunoblotting for endogenous mTOR or RagA. (C) Co-IP analysis of endogenous proteins in macrophage-like cells treated with 100 μM GPN in full medium1 h. IP: anti-Gal8; immunoblotting: endogenous RagA, p14, mTOR and Raptor. (D) APEX2 proximity biotinylation analysis. Cells were transfected with APEX2 fusions with Gal3, 8 and 9, incubated or not with biotin-phenol, pulsed with H2O2, and biotinylated proteins affinity-isolated on streptavidin-beads analyzed by immunoblotting. (E) Proximity biotinylation as in D in response to GPN. BP, biotin-phenol. (F)(i-ii) GST pulldown assay of in vitro translated and radiolabeled Myc-tagged p18 with GST, or GST-tagged Gal8 and Gal9. Data (% binding). (G)(i-ii) GST pulldown assay of in vitro translated Myc-tagged Gal8 or Gal9 with GST or GST-tagged RagB/D. Data as in F. (H) Cells transfected with GFP-Gal8 and FLAG-tagged metap2 (negative control) or RagB variants (RagBWT, RagBT54L or RagBQ99L) were subjected to anti-GFP IP, followed by immunoblotting for FLAG-tagged proteins or GFP. (I) Cells transfected with GFP-Gal8 and FLAG-tagged metap2 or RagC variants (RagCWT, RagCS75L or RagCQ120L) processed as in H; immunoblotting: FLAG or GFP. Data, means □ SEM; blots: n ≥ 3, HC: n ≥ 3 (each experiment: 500 valid primary objects/cells per well, ≥ 5 wells/sample). † p ≥ 0.05 (not significant), *p < 0.05, **p < 0.01, ANOVA. See also Figure S3.
To confirm these relationships we employed an in vivo proximity biotinylation assay using the engineered ascorbate peroxidase probe APEX2 (Lam et al., 2015). This assay (Lam et al., 2015) probes protein-protein proximity in vivo, whereby a protein's fusion with APEX2 preferentially biotinylates its immediate neighbors, due to short half-life and narrow labeling radius (<20 nm) of biotin-phenoxyl radical (the peroxidase reaction products of APEX2 with biotin-phenol) (Rhee et al., 2013). APEX2 was fused at the N-terminus of Gal8 (and Gal9 as a control), cells transfected and treated with GPN, pulsed with biotin-phenol and H2O2, biotinylated products adsorbed to streptavidin beads in cell lysates, and proteins stripped from the beads and analyzed by immunoblotting. Using this assay, we found mTOR, Raptor and RagA in the proximity of Gal8 but not in the proximity of Gal3 or Gal9 (Figure 3D). Lysosomal damage with GPN increased proximity of Gal8 to Ragulator (tested by immunoblotting for LAMTOR2/p14) and RagA and decreased proximity of Gal8 to mTOR and Raptor (Figure 3E). GST-pulldown assays confirmed a capacity for direct interactions between Gal8 and Ragulator (using LAMTOR1/p18) (Figures 3F(i) and S3E(i)) and between GAL8 and all four Rag GTPases (Figures 3G(i)) and S3F(i-iv)). In contrast, Gal9, used as a comparator control in GST pull-downs, did not show direct binding to any of these proteins (Figures 3F(ii), G(ii), and S3E(ii)).
Gal8 showed in co-IPs higher associations with RagBT54L (GDP, inactive RagB form) than with RagBQ99L (GTP, constitutively active RagB form) (Figure 3H), and similarly with RagAT21L (GDP, inactive RagA form) than with RagAQ66L (GTP, constitutively active RagA form) (Figure S3G). Conversely, Gal8 co-IPs with RagC mutants indicated higher association of Gal8 with RagCQ120L (GTP, constitutively active form) than with RagCS75L (GDP, inactive form) (Figure 3I). This is consistent with Gal8's preference for Rag GTPases reflecting mTOR inactivation.
These findings establish Gal8 association with mTOR and its regulators and reveal dynamic changes following lysosomal damage reflected in altered abundance of key components in protein complexes with Gal8 and changes in the proximity of mTOR components and its regulators relative to Gal8. Following lysosomal damage, Gal8 is more firmly associated with Ragulator and RagA/B, whereas its proximity with mTOR and its adaptor Raptor lessens (Figure S3H).
Galectin 8 is required for mTOR inactivation upon lysosomal damage
To test whether Gal8 was functionally important in controlling mTOR, we generated a CRISPR Gal8 mutant in HeLa cells (Gal8KOHeLa) (Figure S4A). mTOR was not inactivated in Gal8KOHeLa cells relative to the wild type (Gal8WTHeLa) parental HeLa cells, assessed by S6K1 (pT389) and ULK1 (p-S757) phosphorylation levels (Figure 4A). In contrast, response to starvation remained intact in Gal8KOHeLa mutant cells (Figure S4B, C). The defect in GPN-response in Gal8KOHeLa cells was complemented by a full-size Gal8 construct (Figure S4D). We next examined which domain(s) of Gal8 were important for Rag and Ragulator binding and found that of the two domains, termed carbohydrate recognition domains CRD1 and CRD2, CRD2 bound to Gal8 (Figure S4E, F). GST-pulldown assays confirmed that CRD2 of Gal8 can directly bind RagA/C and RagB/D, tested as pairs, and LAMTOR1/p18, (Figure S4G(i-iii)). However, the loss of GPN-response in Gal8KOHeLa could not be fully complemented by either of the two Gal8 halves (CRD1 of CRD2) separately (Figure S4D), indicating that binding was not sufficient to confer function and that a full size Gal8 was required for its effects on mTOR inactivation in response to lysosomal damage. Translocation of mTOR from lysosomes to the cytosol was diminished in Gal8KOHeLa cells (Figure 4B). As a further control, we knocked out Gal3 by CRISPR in HeLa cells (Gal3KOHeLa) (Figure S4H). Unlike Gal8KOHeLa, the Gal3KOHeLa cells responded to GPN treatment by reducing S6K1 (pT389) and ULK1 (p-S757) phosphorylation similarly to the parental HeLa cells (Figure S4I). Furthermore, downstream effector mechanisms such as autophagy, measured by levels of LC3-II (Figure 4C), were not activated in Gal8KOHeLa cells as readily as in Gal8WTHeLa cells.
Figure 4. Gal8 is required for mTOR inactivation in response to lysosomal damage.
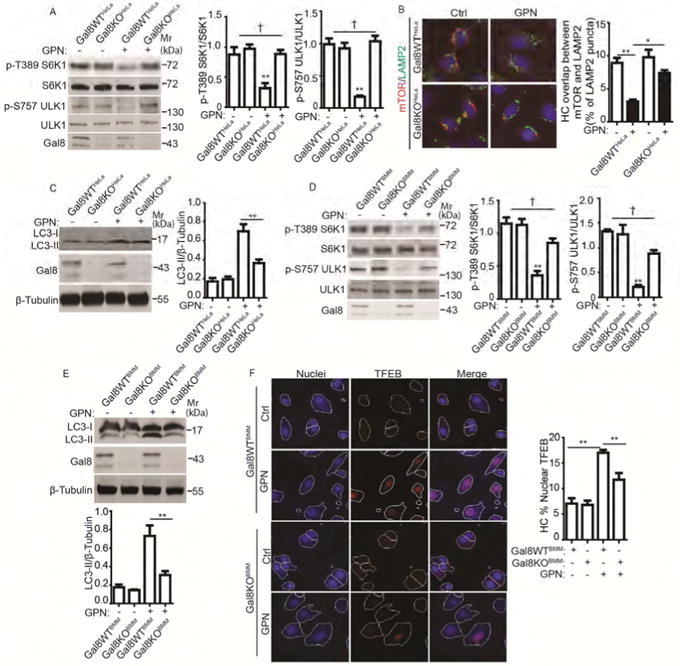
(A) mTOR activity, monitored by phosphorylation of S6K1 (p-T389) and ULK1 (S757), in parental (Gal8WTHeLa) and Gal8-knockout (Gal8KOHeLa) HeLa cells treated with 100 μM GPN in full medium for 1 h. (B) HC analysis of overlaps between mTOR and LAMP2 in Gal8WTHeLa and Gal8KOHeLa cells treated as in A. Ctrl (control): untreated cells. Red and green masks, computer-identified mTOR and LAMP2, respectively (target objects). (C) Immunoblotting analysis of LC3 lipidation (LC3-II) in Gal8WT eLa and Gal8KOHeLa treated as in A. (D) mTOR activity (monitored as in A) in bone marrow-derived macrophages (BMMs). BMMs of wild type C57BL (Gal8WTBMM) and their littermate Gal8-knockout mice (Gal8KOBMM) were treated with 400 μM GPN in full medium for 1 h. (E) Analysis of autophagy induction (monitored as in C) in Gal8WTBMM and Gal8KOBMM treated with 400 μM GPN in full medium for 1 h. (F) HC analysis of TFEB nuclear translocation in Gal8WTBMM and Gal8KOBMM treated with 400 μM GPN in full medium for 1 h. Nuclei: blue pseudocolor, Hoechst 33342; TFEB: red fluorescence, Alexa-568. Ctrl (control): untreated cells. White masks, algorithm-defined cell boundaries (primary objects); pink masks, computer-identified nuclear TFEB based on average intensity. Data, means □ SEM; blots: n ≥ 3, HC: n ≥ 3 (each experiment: 500 valid primary objects/cells per well, ≥ 5 wells/sample). † p ≥ 0.05 (not significant), *p < 0.05, **p < 0.01, ANOVA. See also Figure S4.
We next tested primary cells using murine bone marrow-derived macrophages (BMMs) from Gal8 KO mice. BMMs underwent lysosomal damage upon exposure to GPN (higher concentrations, 400 μM, than in HeLa or 293T cells were necessary) or LLOMe as reflected in reduced LysoTracker Red DND-99 staining (Figure S4J). As in Gal8KOHeLa cells, a resistance to mTOR inactivation was detected in Gal8 KO BMMs (Gal8KOBMM) vs. wild type BMMs (Gal8WTBMM) (Figure 4D). Induction of autophagy (negatively regulated by mTOR) in response to GPN, measured by LC3-II levels, was diminished in Gal8KOBMM relative to Gal8WTBMM (Figure 4E), consistent with incomplete inactivation of mTOR. TFEB nuclear translocation, which is under negative control by mTOR, was not as prominent in Gal8KOBMM relative to Gal8WTBMM macrophages in response to GPN treatment (Figure 4F). These findings indicate that Gal8 is a regulator of mTOR, that Gal8 is responsible in cells subjected to lysosomal damage for mTOR inactivation, and that this is reflected in downstream effector events (Figure S4K). We refer to galectins and their interactors involved in these processes as GALTOR, representing a dynamic galectin-based regulatory subsystem controlling mTOR, defined functionally herein as responding to lysosomal damage (Figure S3H).
The sensor SLC38A9 interacts with Gal8
SLC38A9 is a lysosomal amino acid transporter that interacts with the Rag-Ragulator complex and is required for arginine from lysosomes to activate mTOR (Jung et al., 2015; Rebsamen et al., 2015; Wang et al., 2015). Its sensory repertoire has recently been expanded to mTOR regulation in response to lysosomal cholesterol, independently of its arginine sensing functions (Castellano et al., 2017). Since SLC38A9 appears to integrate diverse signaling inputs for mTOR at lysosomes, we tested if SLC38A9 might be involved in transducing Gal8 lysosomal damage signals to mTOR. SLC38A9 and Gal8 co-IPed, but only upon lysosomal damage, and did not associate in the resting state (full medium) or upon starvation (Figure 5A). This suggests that Gal8 gains access to lumenal aspects of SLC38A9 including its lumenally exposed glycosylated groups (Wang et al., 2015) following lysosomal membrane perturbation. We generated mutants in Gal8 residues known to perturb its ability to bind glycans (Stowell et al., 2010): Gal8R69H (changing the canonical Arg residue in CRD1 to His) and Gal8R232H (changing a key Arg residue in CRD2 to His), and the double mutant Gal8R69H&R232H. Only when both residues R69 and R232 were mutated in CRD1 and CRD2, was the GPN-induced association between Gal8 and SLC38A9 strongly diminished (Figure 5B, C). Wild type Gal8 introduced into Gal8KOHeLa cells complemented the loss of mTOR activity monitored by S6K phosphorylation, but Gal8R69H&R232H did not (Figure 5D). The Gal8R69H&R232H mutant also displayed reduced recruitment to lysosomes following damage (Figure S5A), albeit its translocation was not completely abrogated, indicating involvement of additional interactions besides carbohydrate recognition.
Figure 5. Lysosomal damage promotes interactions between Gal8 and the amino acid and cholesterol sensor SLC38A9.
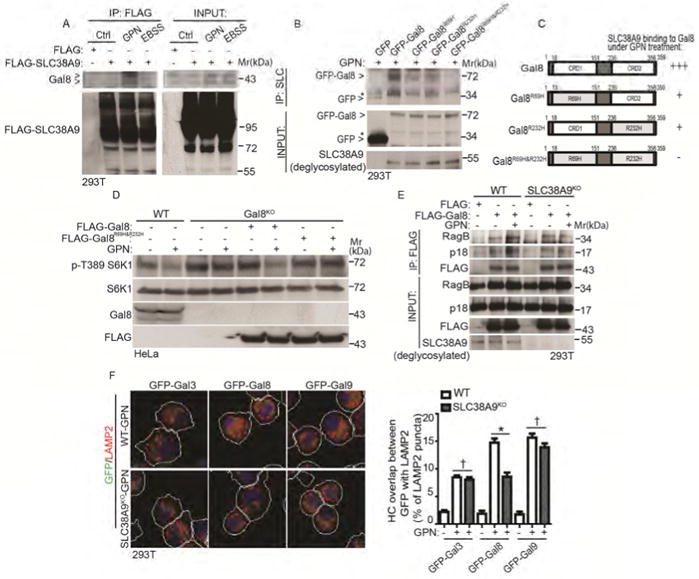
(A) Cells expressing FLAG-SLC38A9 were treated with 100 μM GPN in full medium or starved in EBSS for 1 h. Cell lysates were subjected to anti-FLAG immunoprecipitation and immunoblotted for endogenous Gal8. Control (Ctrl), untreated cells. Note: SLC38A9 is heavily glycosylated protein with smear pattern in immunoblots. (B) Co-IP analysis of interactions between SLC38A9 and Gal8. Cells expressing GFP-tagged Gal8 or glycan recognition-mutant forms of Gal8 (individual R69H, R232H or double/combined R69H & R232H; see panel C) were treated with 100 μM GPN for 1 h in full medium. IP, anti-SLC38A9 (SLC) antibody; immunoblotting with anti-GFP. *, non-specific bands. Note: input SLC3A89 was deglycosylated with PNGase F. (C) Schematic diagram of Gal8 domains (CRD and CRD2, carbohydrate recognition domains 1 and 2) and summary of interactions between SLC38A9 and Gal8. +++, strong; +, weak; -, not detectable. (D) mTOR activity in wild type (WT) and Gal8-knockout (Gal8KO) HeLa cells. Gal8KO cells transfected wtih FLAG-tagged Gal8 or double glycan (R69H & R232H) recognition-mutant form of FLAG-Gal8R69H&R232H were treated with 100 μM GPN for 1 h in full medium. mTOR activity was monitored by S6K1 (T389) phosphorylation. (E) Co-IP analysis of Gal8 with RagB or p18 in response to GPN treatment. Wild type (WT) or SLC38A9-knockout (SLC38A9KO) cells transfected with FLAG vector or FLAG-Gal8 were treated with 100 μM GPN in full medium for 1 h. IP, anti-FLAG; immunoblot, antibodies against RagB and p18. (F) HC quantification of overlaps between galectins and LAMP2 in response to GPN treatment. Wild type (WT) and SLC38A9 knockout (SLC38A9KO) HEK293T cells expressing GFP-galectin fusions were treated with 100 μM GPN in full medium for 1 h. White masks, automatically defined cell boundaries (primary objects); red and green masks, computer-identified LAMP2 and GFP-galectin profiles (target objects). HC data, means □ SEM; n ≥ 3 (each experiment: 500 valid primary objects/cells per well, ≥ 5 wells/sample). † p ≥ 0.05 (not significant), *p < 0.05, ANOVA. See also Figure S5.
A question arose whether SLC38A9 was necessary for Gal8 interactions with Rags and Ragulator. The baseline interactions between Gal8 and RagB or LAMTOR1/p18 were unaffected in SLC38A9 knockout cells (Figure 5E). However, increased interactions of Gal8 with RagB and LAMTOR1/p18 caused by lysosomal damage were not detectable in SLC38A9 knockout cells (Figure 5E). This was accompanied by reduced recruitment of Gal8 to lysosomes in SLC38A9 knockout cells exposed to GPN compared to wild type cells (Figure 5F). Thus, although SLC38A9 was not required for baseline Gal8-Rag/Ragulator interactions, it was needed for their enhanced association following lysosomal damage.
SLC38A9 is required for mTOR reactivation during recovery from lysosomal damage
The specificity of binding between Gal8 and SLC38A9 and their interaction following lysosomal damage suggested the possibility that SLC38A9 might transduce lysosomal damage signals to mTOR regulatory machinery. If this were the case, a knockout in SLC38A9 might no longer respond to lysosomal injury by resisting further inhibition of mTOR activity. As expected (Jung et al., 2015), basal mTOR activity was reduced in SLC38A9 KO cells (Figure 6A), but it was further reduced when cells were subjected to lysosomal damage by GPN. Thus, inactivation of mTOR in response to lysosomal damage occurs even in the absence of SLC38A9. This was confirmed by examining autophagy. LC3-II levels and LC3 puncta increased robustly in response to GPN in SLC38A9 knockout cells as well as in control (wild type) cells (Figure 6B).
Figure 6. SLC38A9 is required for mTOR reactivation during recovery from lysosomal damage.
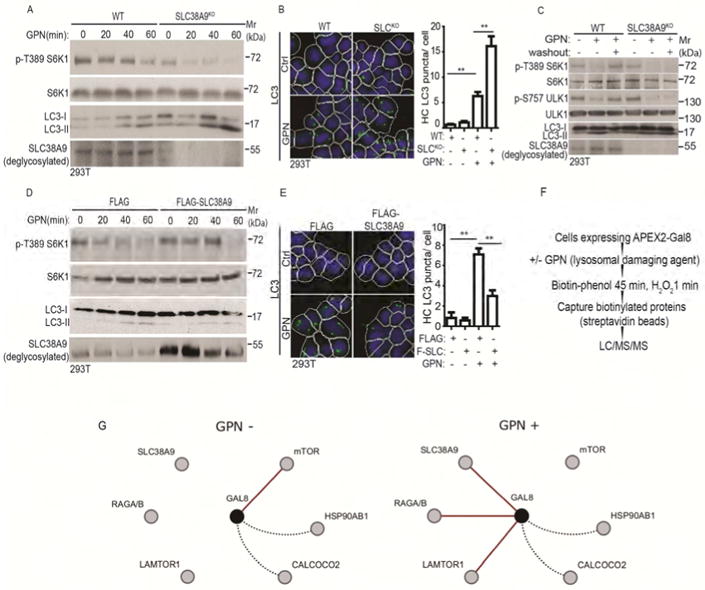
(A) mTOR activity (immunoblots; S6K1 phosphorylation at T389) and autophagy induction (LC3 immunoblots) in WT (wild type) and SLC38A9 knockout (SLC38A9KO) HEK293T cells treated with 100 μM GPN in full medium (time course). (B) HC analysis of autophagy induction (endogenous LC3 puncta) in WT and SLC38A9KO cells treated with 100 μM GPN in full medium for 30 min.. Control (Ctrl), untreated cells. White masks, algorithm-defined cell boundaries (primary objects); green masks, computer-identified LC3 puncta (target objects). (C) mTOR activity recovery and autophagy inhibition in SLC38A9KO cells after GPN washout. WT and SLC38A9KO HEK293T cells were treated with 100 μM GPN for 1 h followed by 1 h washout in full medium. mTOR activity and autophagy were monitored as in A. (D) mTOR activity and autophagy induction (monitored as in A) cells overexpressing FLAG-SLC38A9 or FLAG (vector control) treated with 100 μM GPN in full medium (time course). (E) HC analysis of autophagy induction in SLC38A9-overexpressing cells treated with GPN. FLAG and FLAG-SLC38A9 (F-SLC) expressing HEK293T cells were treated with 100 μM GPN in full medium for 30 min, and LC3 puncta were quantified by HC. Ctrl, no GPN. Masks, as in B. Data (B and E), means □ SEM, n ≥ 3 independent experiments (500 primary objects counted per well; ≥ 5 wells/sample per each experiment), **p < 0.01, ANOVA. (F) Schematic, strategy for APEX2-Gal8 LC-MS/MS proteomic analysis (see STAR methods). (G) Cytoscape depiction of dynamic changes in protein interactions/proximity relative to Gal8 in response to lysosomal damage caused by exposure to GPN (GPN+), based on protemic data in Table S1. Red lines, key changes in interactions/proximities (using > 100-fold change in precursor peak intensities as a cutoff) observed in each of the three complete biological replicates of HEK293T cells transfected with pJJiaDEST-APEX2-Gal8 subjected to separate LC-MS/MS analyses. Dotted black lines, examples of proteins identified in the LC/MS/MS analysis that did not display changes when comparing control (full medium without GPN; GPN-) vs. lysosomal damage (full medium with 100 μM GPN for 1 h; GPN+) (see Table S1). The MS/MS proteomic data have been deposited at MassIVE, ID MSV000081788 and linked to ProteomeXchange accession ID PXD008390). See also Figure S5 and Table S1.
However, SLC38A9 was required for return to normal mTOR activity upon GPN washout measured by S6K1 and ULK1 phosphorylation as well as by LC3-II levels (Figure 6C). When SLC38A9 was overexpressed in 293T cells (Figure 6D), GPN-induced inhibition of mTOR was prevented at the earlier time points during the time course, indicating that overexpressed SLC38A9 can interfere with the effects of lysosomal damage on mTOR inhibition, possibly by competition. These effects were confirmed by suppression of LC3-II levels and LC3 puncta in response to GPN in cells overexpressing SLC38A9 (Figure 6D, E). Thus, although SLC38A9 is not required to transduce lysosomal damage-associated inhibitory signals to mTOR, it can counteract their input when overexpressed and is necessary for restoration of mTOR activity during recovery from lysosomal damage (Figure S5B, C).
Proteomic proximity analyses of Gal8 during lysosomal damage
We next performed a bottom up proteomic analysis using liquid chromatography tandem mass spectrometry (LC/MS/MS) in conjunction with proximity biotinylation with APEX2 (Hung et al., 2016; Hung et al., 2014) in cells expressing APEX2-Gal8 and treated or not treated with GPN. Three independent experiments with proximity biotinylation and LC/MS/MS, identified by spectral counting (Liu et al., 2004) that SLC38A9 and RagA/B become proximal to APEX2-Gal8 (spectral counts increased in excess of 100-fold) in cells subjected to lysosomal damage by GPN (Figure 6F, Table S1, tabs 1-3). The Ragulator component LAMTOR1/p18 was also identified as showing a large increase in its proximity to APEX2-Gal8 by spectral counts following treatment of cells with GPN (Figure 6F, Table S1, tabs 1-3). In contrast, mTOR showed an inverse pattern, and was found by spectral counting in all three experiments as becoming more distal to APEX2-Gal8 (reflected in a decrease in spectral counts of >100-fold) in cells treated with GPN (Figure 6F, Table S1, tabs 1-3). Two arbitrarily chosen proteins, CALCOCO2 (NDP52), a protein previously shown to bind Gal8 (Thurston et al., 2012) and HSP90 (HSP90α/β), were identified in 2/3 or 3/3 experiments, respectively, but the spectral counts did not change much (by comparison to SLC38A9, RagA/B, LAMTOR1/p18 and mTOR) with GPN treatment (Figure 6F, Table S1, tabs 1-3). MS signal intensity of peptide precursor ions confirmed these relationships, i.e. a large increase in LAMTOR1/p18, SLC38A9, and RagA/B (>100-fold in each case), and a large decrease in mTOR proximity to APEX2-Gal8 following lysosomal damage with GPN (>100-fold) (Table S1, tab 4). No other identified proteins showed changes (in three experimental replicates ± GPN; Table S1) approaching magnitudes observed for SLC38A9, RagA/B, LAMTOR1/p18 on one end of the spectrum (increase), and mTOR on the opposite end of the spectrum (decrease) (Table S1, tabs 1-4). These data confirm our identification of SLC38A9, LAMTOR1/p18 and RagA/B as the main candidates for Gal8 effectors in control of mTOR in response to lysosomal damage (Figure 6G).
Galectin 9 interacts with AMPK and activates it during lysosomal damage
We included AMPKα in our experiments as an anticipated negative control for galectin association. AMPKα was not detected in complexes with Gal3 and Gal8, but surprisingly, AMPKα was found in co-IPs with Gal9 (Figure 7A). Unlike mTOR, which is inactivated with GPN, AMPK was activated by GPN as reflected in increased AMPKα T172 phosphorylation (Figure 7B). This was accompanied by increased phosphorylation of AMPK's downstream targets (Figure 7B). In cells treated with GPN, there was elevated phosphorylation of S79 within the critical metabolic enzyme acetyl-CoA carboxylase (ACC), and an increase in one of the activating AMPK phosphosites on ULK1 (pS317), but not of the mTOR-dependent inactivating phosphosite on ULK1, pS757, which was decreased (Figure 7B).
Figure 7. Galectin 9 interacts with AMPK and activates it during lysosomal damage.
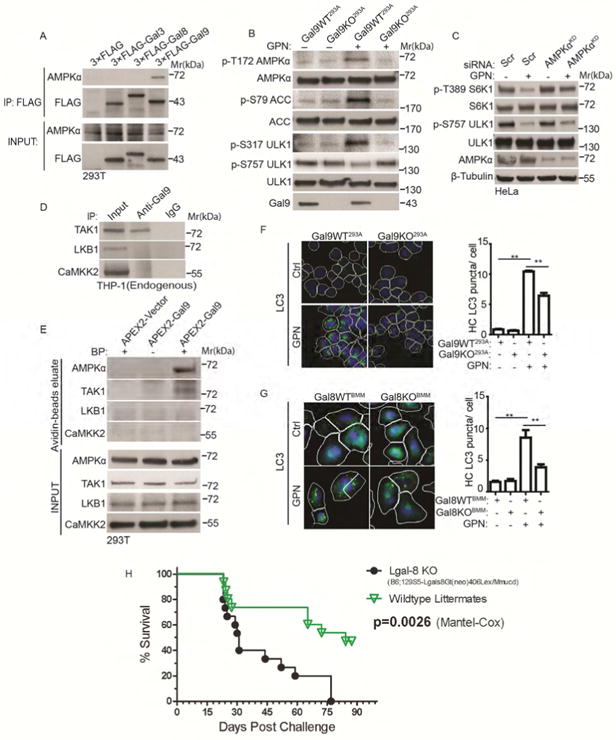
(A) Co-IP analysis of interactions between galectins and AMPKα. Cells transfected with FLAG-tagged galectins were subjected to anti-FLAG IP followed by immunoblotting for endogenous AMPKα. (B) AMPK activity in parental (Gal9WT293A) and Gal9-knockout (Gal9KO293A) HEK293A cells treated with 100 μM GPN in full medium for 1 h. AMPK activation was monitored by immunoblotting analysis of phosphorylated AMPKα (p-T172) and its targets acetyl-CoA carboxylase (ACC, p-S79) and ULK1 (p-S317; vs. p-S757 (phosphorylated by mTOR)) relative to total AMPKα, ACC and ULK1. (C) mTOR activity in HeLa cells transfected with scrambled siRNA (Scr) or AMPKα siRNA (AMPKαKD) treated with 100 μM GPN in full medium for 1 h. mTOR activity was monitored by immunoblotting for p-S6K1 (T389) and p-ULK1 (S757). (D) Co-IP analysis of interactions using Gal9 antibody or control IgG for IP and TAK1, LKB1 or CaMKK2 in immunoblots. (E) APEX2 biotinylation proximity analysis of AMPKα and its upstream regulators. Cells transfected with APEX2-Vector or APEX2-Gal9 were subjected to in vivo biotinylation (BP, biotin phenol), biotinylation proteins enriched on streptavidin beads, and the samples immunoblioted for TAK1, LKB1 and CaMKK2. (F) HC analysis of autophagy induction (LC3 puncta) in parental (Gal9WT293A) and Gal9-knockout (Gal9KO293A) HEK293A cells treated with 100 μM GPN in full medium for 1 h. White masks, algorithm-defined cell boundaries (primary objects); green masks, computer-identified LC3 puncta (target objects). (G) Analysis of autophagy induction in Gal8WTBMM and Gal8KOB M primary macrophages treated with 400 μM GPN in full medium for 1 h. LC3 puncta were quantified by HC as in F. HC data, means □ SEM, n ≥ 3 independent experiments (500 primary objects counted per well; ≥ 5 wells/sample per each experiment), **p < 0.01, ANOVA. (H) Survival curves of Gal8 wild type mice and their Gal8-knockout littermates in a model of respiratory infection with M. tuberculosis. Initial lung deposition, 700 CFU of M. tuberculosis Erdman. See also Figures S5 and S6.
We generated a Gal9 KO in HEK293A cells using CRISPR (Figure S5D), to test whether Gal9 was important for AMPK control. Gal9 KO abrogated the GPN-induced AMPK phosphorylation and the downstream pattern with ACC and ULK1 (Figure 7B). Gal9 KO cells retained increased AMPK phosphorylation in response to glucose starvation or oligomycin treatment (Figure S5E, F). The defect in response to GPN was complemented by introducing FLAG-Gal9 into Gal9 KO HEK293A cells (Figure S6A) A knockdown of Gal9 in HEK293T cells had a similar suppressive effect on AMPK phosphorylation response pattern elicited by lysosomal damage caused by LLOMe (Figure S6B). When Gal9 was overexpressed in HEK293T cells, LLOMe-induced AMPK signature phosphorylation pattern was elevated (Figure S6C). In cells knocked down for AMPKα, mTOR was partially resistant to inactivation by GPN (Figure 7C), which fits the known AMPK-mTOR co-regulation circuitry and inhibition of mTOR by AMPK (Gwinn et al., 2008; Shaw et al., 2004).
We next tested the major kinases upstream of AMPK, LKB1 (Hawley et al., 2003; Woods et al., 2003), CaMMK2 (Hawley et al., 2005; Woods et al., 2005), and TAK1 (Herrero-Martin et al., 2009) known to phosphorylate AMPKα at the T172 site. Only TAK1 was observed in co-IPs with Gal9 (Figure 7D). Similarly to AMPKα, TAK1 interacted with Gal9 but not with Gal3 or Gal8 (Figure S6D). Using biotinylation proximity assay with APEX2-Gal9, we also detected TAK1 but no LKB1 or CaMKK2 (Figure 7E). Deletion mapping of Gal9 indicated that both Gal9's CRDs (CRD1 and CRD2) were contributing to full association between Gal9 with AMPKα, although CRD1 retained partial binding capacity for AMPKα (Figure S6E, F). This was paralleled by Gal9 CRD1's ability to associate fully with TAK1 (Figure S6G). These results suggest that of the upstream kinases known to activate AMPK (Garcia and Shaw, 2017), TAK1 in association with Gal9 represented the best candidate for T172 phosphorylation and activation of AMPK in response to lysosomal damage. Accordingly, when we knocked down TAK1, this abrogated AMPKα and ACC phosphorylation in response to GPN (Figure S6H). However, we also observed a similar effect when LKB1 was knocked down, whereas CaMKK2 showed no effects (Figure S6H). The observed contribution of LKB1 to AMPKα activation in response to lysosomal damage is compatible with a recently reported assembly of LKB1 and AMPK on lysosomes (Zhang et al., 2014). The findings regarding Gal9-AMPK responses to lysosomal damage are summarized in Figure S6I.
Gal8 and Gal9 coordinate physiological responses to endomembrane damage
A question arose whether both Gal8 and Gal9 are needed for autophagic response to lysosomal damage. We tested Gal9KO 293A cells and found a decreased autophagic response to GPN (Figure 7F). Likewise, Gal8 KO in BMMs reduced autophagic response to lysosomal damage (Figure 7G). Thus both Gal8 and Gal9 are important for an optimal autophagic response.
Among the biological outputs known to associate with autophagic activation is the control of intracellular Mycobacterium tuberculosis (Mtb) (Gutierrez et al., 2004). Virulent Mtb (e.g. strain Erdman) can cause damage to endomembranes such as phagosomes or phagolysosomes (Manzanillo et al., 2012). A protective role for Gal9 has already been established using Gal9 KO mice through an incompletely understood mechanism (Jayaraman et al., 2010), and hence we asked whether Gal8 similarly to Gal9 contributed to protection against Mtb. When Gal8 KO mice were subjected to aerosol infection with Mtb Erdman, Gal8 KO animals showed increased susceptibility relative to wild type littermates (Figure 7H). In conclusion, Gal8 and Gal9 jointly orchestrate physiological responses to endomembrane/lysosomal damage.
Discussion
This study shows that mTOR and AMPK are coordinately regulated by lysosomal damage, that specific galectins that recognize lysosomal damage associate with these regulators of cellular metabolism, and that Gal8 inhibits mTOR in response to non-metabolic inputs such as loss of endomembrane integrity. The galectin-containing complexes, functionally defined as a subsystem converging upon and controlling mTOR, are collectively referred to here as GALTOR. GALTOR response results in reprogramming of downstream effectors, i.e. S6K, and ULK1, as parts of anabolic and catabolic pathways, and includes autophagy, which represents both a metabolic pathway and a protein and membrane cytoplasmic quality control process. Whereas mTOR and AMPK are established as regulators of autophagy in its metabolic function (Garcia and Shaw, 2017; Saxton and Sabatini, 2017), their engagement in activating autophagy as an intracellular organelle and protein quality control pathway has not been as intuitive or established. The present work closes this gap and assigns a non-metabolic, membrane-homeostatic role to mTOR and AMPK as one of their key functions.
When lysosomal membranes are injured, Gal8 suppresses mTOR activity through its Ragulator-Rag signaling machinery (Saxton and Sabatini, 2017), whereas Gal9 activates AMPK possibly through recruitment of its known upstream activator TAK1 (Herrero-Martin et al., 2009). In addition to TAK1, the LKB1-AMPK axis plays a role, recently reported to respond to disruptions in lysosomal v-ATPase (Zhang et al., 2014). Since AMPK inhibits mTOR via Raptor, TSC2 (Carroll et al., 2016; Demetriades et al., 2014; Saxton and Sabatini, 2017) and additional mechanisms (Zhang et al., 2014), the Gal9-driven activation of AMPK and Gal8-driven inactivation of mTOR upon lysosomal damage sets off a harmonized set of effects on AMPK and mTOR.
Galectins are intriguing proteins synthesized as cytosolic entities and released extracellularly (Arthur et al., 2015). Galectins' intracellular functions have been less understood. In autophagy, galectins have been implicated primarily as “tags” for damaged membranes to guide their selective autophagy (Chauhan et al., 2016; Thurston et al., 2012). Gal8 interacts with NDP52 in the selective autophagy process termed xenophagy (Thurston et al., 2012). However, Gal8's partner NDP52 is dispensable for mTOR inactivation since murine macrophages, which lack NDP52, are responsive to lysosomal damage. Instead, galectins through GALTOR directly control mTOR and AMPK.
The same core machinery regulating mTOR at the lysosome in response to nutrients (Castellano et al., 2017; Saxton and Sabatini, 2017) is engaged in transducing lysosomal damage. The following model emerges (Figure S3H). In the resting state, Gal8 is in complexes with mTOR. Following lysosomal damage, Gal8 increases interactions with the Ragulator-Rag/SLC38A9 apparatus while its association with mTOR and Raptor lessens. This is consistent with mTOR's translocation from the lysosome to the cytosol caused by lysosomal damage, whereas the Ragulator-Rag complex retained on the lysosome increases its interactions with Gal8. A reflection of these events is the preferential association of Gal8 with the inactive (GDP) form of RagA. In parallel, AMPK is activated through a Gal9-dependent pathway.
It is important to understand the effects driven by lysosomal/endomembrane damage on general metabolism. This connects organically with the roles of mTOR and AMPK in immunometabolism (O'Neill et al., 2016). In a good fit with this, the process of autophagy, which has numerous immunological functions (Deretic et al., 2013), is predominantly anti-inflammatory (Deretic and Levine, 2018) congruent with the pattern of inactive mTOR and active AMPK in anti-inflammatory and immunological memory polarization states (O'Neill et al., 2016). The integration of metabolic processes with responses to membrane damage uncovered herein should provide impetus to study roles of autophagy, mTOR and AMPK in immunometabolism and, conversely, to study the role of these metabolic systems in endomembrane and cytoplasmic quality control of relevance for aging, cancer, and a broad spectrum of diseases. The links between lysosomal damage and mTOR inhibition, AMPK activation, and autophagy induction, may explain the curious placement of mTOR and its regulators at the lysosome (Saxton and Sabatini, 2017), reflecting not only metabolic needs but also innate defenses against invading microbes, e.g. Mtb studied here and elsewhere (Gutierrez et al., 2004), or exogenous and endogenous agents (Deretic and Levine, 2018) of sterile endomembrane injury and inflammation.
STAR Methods
Contact for Reagent and Resource Sharing
Further information and requests for resources and reagents should be directed to and will be fulfilled by the Lead Contact, Vojo Deretic (vderetic@salud.unm.edu).
Experimental Model and Subject Details
Human subjects
Human peripheral blood-derived monocytes (MDMs) were obtained from peripheral blood of healthy adult volunteers of both sexes and ethnic mix reflecting general population in New Mexico, USA. Subjects were enrolled through an HRRC/Institutional Review Board-approved protocol.
Mice
C57BL/6J mice and their Gal8 knockout derivative (B6;129S5-Lgals8Gt(neo)406Lex/Mmucd) were bred to generate Gal8 wild type (wt) and Gal8 knockout C67BL/6 littermates accounting for metagenomic considerations. Mice were 4-10 weeks old and included both sexes equally or near-equally represented in experimental groups. Genotyping was through Transnetyx services. All breeding procedures have been carried out following protocols approved by IACUC.
Cell and cell line models
Cultured human (MDM) and murine (Bone marrow derived macrophages; BMMs) primary cells and authenticated cell lines were used for microscopy and biochemical analyses. Cell types, lines and culture conditions are described under Method Detals.
Murine tuberculosis infection model
Mycobacterium tuberculosis Erdman (Manzanillo et al., 2012) were cultured in Middlebrook 7H9 broth supplemented with 0.05% Tween 80, 0.2% glycerol, and 10% oleic acid, albumin, dextrose, and catalase (OADCBD Biosciences) at 37°C and homog enized to generate single-cell suspension for macrophage infection studies. Mice were exposed to Mtb Erdman aerosols (intermediate dose of 700 CFU initial lung deposition as previously defined (Chauhan et al., 2016)) using a GlasCol apparatus for aerosol delivery, and survival monitored for 100 days post infection. All procedures have been carried out under ABSL3 conditions, following protocols approved by IACUC, and adherence to approved protocols was monitored by an independent direct observer.
Method Details
Antibodies and reagents
Antibodies were from Cell Signaling Technology (CST) were phospho-T389 S6K1 (108D2, #9234) (1:1000 for Western blot (WB)), S6K1 (49D7, #2708) (1:1000 for WB), phospho-S757 ULK1 (#6888) (1:1000 for WB), phospho-S317 ULK1 (D2B6Y, #12753) (1:1000 for WB), ULK1 (D8H5, #8054) (1:1000 for WB), TSC2 (D93F12, #4308) (1:1000 for WB), RagA (D8B5, #4357) (1:1000 for WB), RagB (D18F3, #8150) (1:1000 for WB), RagC (#3360) (1:1000 for WB), RagD (#4470) (1:1000 for WB), LAMTOR1 (D11H6, #8975) (1:1000 for WB), LAMTOR2 (D7C10, #8145) (1:1000 for WB), LAMTOR3 (D38G5, #8168) (1:1000 for WB), mTOR (7C10, #2983) (1:1000 for WB; 1:400 for immunofluorescence(IF)), Raptor (24C12, #2280) (1:1000 for WB), TFEB (#4240) (1:1000 for WB; 1:200 for IF), ATG13 (E1Y9V, #13468) (1:100 for IF), TAK1 (#4505) (1:1000 for WB), AMPKα (#2532) (1:1000 for WB), phospho-T172 AMPKα (40H9, #2535)(1:1000 for WB), Acetyl-CoA Carboxylase (#3662) (1:1000 for WB), phospho-S79 Acetyl-CoA Carboxylase (#3661) (1:1000 for WB). Other antibodies used in this study were from the following sources: FLAG M2 (F1804) (1:1000 for WB), LC3B (L7543) (1:1000 for WB), SLC38A9 (HPA043785) (1:1000 for WB) from Sigma Aldrich; GFP (ab290) (1:1000 for WB), beta-Tubulin (ab6046) (1:1000 for WB), Galectin-9 (ab69630) (1:1000 for WB) from Abcam, LKB1 (ab61122) (1:1000 for WB), CAMKK2 (ab168818) (1:1000 for WB); Galectin-8 (H-80) (1:200 for WB), Galectin-3 (SC-32790) (1:200 for WB) and beta-Actin (C4) (1:1000 for WB) from Santa Cruz Biotechnology; LC3 (PM036) (1:500 for IF) from MBL International; LAMP2 (H4B4) (1:500 for IF) from DSHB of University of Iowa; HRP-labeled anti-rabbit(1:2000 for WB) and anti-mouse (1:2000 for WB) secondary antibodies from Santa Cruz Biotechnology; Clean-Blot IP Detection Kit (HRP) (21232) (1:1000 for WB), Alexa Fluor 488, 568 (1:500 for IF) from ThermoFisher Scientific.
Reagents used in this study were from the following sources: Streptavidin Magnetic Beads (88816), Dynabeads Protein G (10003D) from ThermoFisher Scientific; Gly-Phe-beta-Napthylamide (GPN) (21438-66-4) from Cayman Chemicals; Biotinyl tyramide (biotin-phenol) (CDX-B0270-M100) from AdipoGen; sodium ascorbate (A7631), sodium azide (S2002), Trolox (238813) and Leu-Leu-methyl ester hydrobromide (LLOMe, L7393) from Sigma Aldrich; Urea (17-1319-01) from Pharmabiotech; DMEM, RPMI and EBSS medias from Life Technologies; PNGaseF from New England Biolabs.
Cells and cell lines
HEK293T, HeLa and THP-1 cells were from ATCC. Bone marrow derived macrophages (BMMs) were isolated from femurs of Atg5fl/fl LysM-Cre mice or Gal8 Atg5fl/fl LysM-Cre and their Cre-negative litermates, and cultured in DMEM supplemented with mouse macrophage colony stimulating factor (mM-CSF, #5228, CST). THP-1 cells were differentiated with 50 nM phorbol 12-myristate 13-acetate (PMA) overnight before use. Glucose starvation was performed by glucose-free medium (ThermoFisher, #11966025) supplemented with 10% fetal bovine serum (FBS). TSC2-knockout HeLa cells and SLC38A9-knockout HEK293T cells were from David M. Sabatini (Whitehead Institute). HEK293T cells stably expressing FLAG-metap2/FLAG-p14 and constitutively active RagBQ99L were from Roberto Zoncu (UC Berkeley).
Cultured human peripheral blood monocyte cells
A 40-50 mL blood draw was collected from a healthy, consenting adult volunteer enrolled in our HRRC-approved study by a trained phlebotomist. Keeping different donors separate, blood in 10 mL vacutainers was pooled into 2 - 50 mL conicals, the volume brought to 50 mL with sterile 1× PBS and mixed by inversion. 25 mL of the blood mix were carefully layered onto 20 mL of Ficoll (Sigma, #1077) in separate conical tubes and centrifuged at 2000 rpm for 30 min at 22°C. The buffy layer containing human peripheral blood monocytes (PBMCs) was removed, pooled, washed with 1× PBS twice and resuspended in ∼20 mL RPMI media with 10% human AB serum and Primocin.
Plasmids, siRNAs, and transfection
The following plasmids were from Addgene: pRK5-HA GST RagA (#19298), pRK5-HA GST RagD (#19307), pRK5-HA GST RagA 21L (#19299), pRK5-HA GST RagA 66L (# 19300), pRK5-HA GST RagD 77L (#19308), pRK5-HA GST RagD 121L (#19309), pRK5-HA GST RagB (#19301), pRK5HA GST RagC (#19304), pRK5-HA GST RagB 99L (#19303), pRK5-HA GST RagB 54L (#19302), pRK5-HA GST RagC 75L (#19305), pRK5-HA GST RagC 120L (#19306), pRK5-p18-FLAG (#42331), pRK5-FLAG-SLC38A9.1 (#71855), pcDNA3 APEX2-NES (#49386). pDONR221-metap2 (HsCD00043030) was from DNASU. Plasmids used in this study, such as LAMTOR1/p18, RagA, B, C or D and the corresponding mutants, were cloned into pDONR221 using BP cloning, and expression vectors were made utilizing LR cloning (Gateway, ThermoFisher Scientific) in appropriate pDEST vectors for immunoprecipitation or GST-pulldown assay.
The Gateway Vector Conversion System (ThermoFisher Scientific) was used to construct pJJiaDEST-APEX2. Galectin-8 mutants were generated utilizing the QuikChange site-directed mutagenesis kit (Agilent) and confirmed by sequencing (Genewiz). YFP-fused galectins were from Felix Randow (MRC Laboratory of Molecular Biology, UK). All siRNAs were from GE Dharmacon. Plasmid transfections were performed using the ProFection Mammalian Transfection System (Promega) or Amaxa nucleofection (Lonza). siRNAs were delivered into cells using either Lipofectamine RNAiMAX (ThermoFisher Scientific) or Amaxa nucleofection (Lonza).
High content microscopy
Cells in 96 well plates were treated, followed by fixation in 4% paraformaldehyde for 5 min. Cells were then permeabilized with 0.1% saponin in 3% Bovine serum albumin (BSA) for 30 min followed by incubation with primary antibodies for 2 h and secondary antibodies for 1h. High content microscopy with automated image acquisition and quantification was carried out using a Cellomics HCS scanner and iDEV software (ThermoFisher Scientific). Automated epifluorescence image collection was performed using a minimum of 500 cells per well. Epifluorescence images were machine analyzed using preset scanning parameters and object mask definitions. Hoechst 33342 staining was used for autofocus and to automatically define cellular outlines based on background staining of the cytoplasm. Primary objects were cells, regions of interest (ROI) or targets were algorithm-defined for shape/segmentation, maximum/minimum average intensity, total area and total intensity minima and maxima limits, etc., to automatically identify puncta or other profiles within valid primary objects. Nuclei were defined as a region of interest for TFEB translocation. All data collection, processing (object, ROI, and target mask assignments) and analyses were computer driven independently of human operators.
Immunofluorescence confocal microscopy and analysis
HeLa or HEK293T cells were plated onto coverslips in 6-well plates. After treatment, cells were fixed in 4% paraformaldehyde for 5 min followed by permeabilization with 0.1% saponin in 3% BSA for 30 min. Cells were then incubated with primary antibodies for 2 h and appropriate secondary antibodies Alexa Fluor 488 or 568 (ThermoFisher Scientific) for 1h at room temperature. Coverslips were mounted using Prolong Gold Antifade Mountant (ThermoFisher Scientific). Images were acquired using a confocal microscope (META; Carl Zeiss) equipped with a 63×/1.4 NA oil objective, camera (LSM META; Carl Zeiss), and AIM software (Carl Zeiss).
Co-immunoprecipitation assay
Cells transfected with 8-10 μg of plasmids were lysed in NP-40 buffer (ThermoFisher Scientific) supplemented with protease inhibitor cocktail (Roche, 11697498001) and 1 mM PMSF (Sigma, 93482) for 30 min on ice. Supernatants were incubated with (2-3 μg) antibodies overnight at 4°C. The immune complexes were captured with Dynabeads (ThermoFisher Scientific), followed by three times washing with 1× PBS. Proteins bound to Dynabeads were eluted with 2×Laemmli sample buffer (Biorad) and subjected to immunoblot analysis.
APEX2-labeling and streptavidin enrichment for immunoblotting analyses
HEK293T cells transfected with pJJiaDEST-APEX2 or pJJiaDEST-APEX2-Gal8 were incubated with 100 μM GPN (Cayman Chemicals) in full medium for 1h (confluence of cells remained at 70-80%). Cells were next incubated in 500 μM biotin-phenol (AdipoGen) in full medium for the last 30 min of GPN incubation. A 1 min pulse with 1 mM H2O2 at room temperature was stopped with quenching buffer (10 mM sodium ascorbate, 10 mM sodium azide and 5 mM Trolox in Dulbecco's Phosphate Buffered Saline (DPBS)). All samples were washed twice with quenching buffer, and twice with DPBS.
For immunoblotting analysis, cell pellets were lysed with 500 μL ice-cold RIPA lysis buffer (ThermoFisher Scientific) with protease inhibitor cocktail (Roche), 1 mM PMSF (sigma), 10 mM sodium ascorbate, 10 mM sodium azide and 5 mM Trolox, gently pipetted and then the incubated for 30 min. The lysates were clarified by centrifugation at 13,000 rpm for 5 min, followed by measuring protein concentrations using a Pierce BCA Protein Assay kit, with freshly made bovine serum albumin (BSA) solutions as standards. Streptavidin–coated magnetic beads (ThermoFisher Scientific) were washed with RIPA lysis buffer. 3 mg of each sample was mixed with 100 μL of streptavidin beads. The suspensions were gently rotated at 4 °C overnight to bind biotinylated proteins. The flowthrough was removed, and the beads were washed twice with 1mL RIPA lysis buffer, 1mL of 2 M urea (Pharmabiotech) in 10 mM Tris-HCl (PH8.0), and again twice with 1mL RIPA lysis buffer. Beads-bound biotinylated proteins were desorbed from beads by heating the beads at 100°C for 10 min in 30 μL 2×La emmli sample buffer (Biorad) supplemented with 2 mM biotin (Sigma). 15 μL of each sample was separated by SDS-PAGE and analyzed by Western blot using indicated antibodies.
For LC-MS/MS analysis, cell pellets were lysed in 500 μL ice-cold lysis buffer (6 M urea, 0.3 M Nacl, 1 mM EDTA, 1 mM EGTA, 10 mM sodium ascorbate, 10 mM sodium azide, 5 mM Trolox, 1% glycerol and 25 mm Tris/HCl [PH 7.5]) for 30 min by gentle pipetting. Lysates were clarified by centrifugation and protein concentrations determined as above. Streptavidin–coated magnetic beads (Pierce) were washed with lysis buffer. 3 mg of each sample was mixed with 100 μL of streptavidin bead. The suspensions were gently rotated at 4 °C for overnight to bind biotinylated proteins. The flowthrough after enrichment was removed and the beads were washed in sequence with 1 mL IP buffer (150 mM NaCl, 10 mM Tris-HCl pH8.0, 1 mM EDTA, 1 mM EGTA, 1% Triton X-100) twice; 1 mL 1M KCl; 1mL of 50 mM Na2CO3; 1 mL 2M Urea in 20 mM Tris HCl pH8; 1 mL IP buffer. Biotinylated proteins were eluted, 5-10% of the sample processed for Western Blot and 90-95% of the sample processed for mass spectrometry.
LC-MS/MS
Digested peptides were analyzed by LC-MS/MS on a Thermo Scientific Q Exactive Plus Orbitrap Mass spectrometer in conjunction Proxeon Easy-nLC II HPLC (Thermo Scientific) and Proxeon nanospray source. The digested peptides were loaded a 100 micron × 25 mm Magic C18 100Å 5U reverse phase trap where they were desalted online before being separated using a 75 micron × 150 mm Magic C18 200Å 3U reverse phase column. Peptides were eluted using a 140 minute gradient with a flow rate of 300nl/min. An MS survey scan was obtained for the m/z range 350-1600, MS/MS spectra were acquired using a top 15 method, where the top 15 ions in the MS spectra were subjected to HCD (High Energy Collisional Dissociation). An isolation mass window of 1.6 m/z was for the precursor ion selection, and normalized collision energy of 27% was used for fragmentation. A fifteen-second duration was used for the dynamic exclusion.
GST-pulldown assay
GST and GST-tagged proteins were produced in SoluBL21 Competent E.coli (Genlantis, C700200) and purified by binding to Glutathionine Sepharose 4 Fast Flow beads (GE Healthcare, 17-5132-01) while myc-tagged proteins were in vitro translated using the TNT T7 Reticulocyte Lysate System (Promega, 14610) in the presence of 35S-methionine. 10 μL of translated protein were incubated with immobilized GST-tagged protein in NETN-buffer (50 mM Tris pH 8.0, 150 mM NaCl, 1 mM EDTA, 0.5% NP-40) supplemented with cOmplete Mini EDTA-free protease inhibitor cocktail tablets (Roche, 11836170001, 1 tablet/10 mL) for 1h at 4 °C followed by five times washing with NETN buffer. 2 × SDS gel loading buffer were added and protein separated by SDS-PAGE. Gels were stained with Coomassie Brilliant Blue R-250 Dye (ThermoFisher Scientific, 20278) to visualize the fusion proteins. Radioactive signals were detected by Fujifilm bioimaging analyzer BAS-5000 and quantified with ScienceLab ImageGuage software (Fujifilm).
Generation of Gal3, Gal8 CRISPR and Gal9 CRISPR mutant cells
Gal3/8-depleted cells were generated with CRISPR/Cas9-mediated knockout system, HeLa cells were transfected with a Gal3/8 CRISPR/Cas9 KO plasmid purchased from Santa Cruz Biotechnology, sc-417680/401785). Human Gal3 target sequence was a pool of 3 different gRNA plasmids (gRNA1: CAGCTCCATGATGCGTTATC; gRNA2: CAGACCCAGATAACGCATCA; gRNA3: CGGTGAAGCCCAATGCAAAC) and human Gal8 target sequence was a pool of 3 different gRNA plasmids (gRNA1: CATGAAACCTCGAGCCGATG; gRNA2: ATGTTCCTAGTGACGCAGAC; gRNA3: CGTATCACAATCAAAGTTCC) located within the coding DNA sequence fused to Streptococcus pyogenes Cas9, and GFP. Transfected cells (green fluorescence) were sorted by flow cytometry and single-cell clones analyzed by immunoblotting for a loss of Gal3/8 band (Figure S4H/A).
For Gal9, the lentiviral vector lentiCRISPRv2 carrying both Cas9 enzyme and a gRNA targeting Gal9 (gRNA target sequence: ACACACACACCTGGTTCCAC) was transfected into HEK293T cells together with the packaging plasmids psPAX2 and pCMV-VSV-G at the ratio of 5:3:2. Two days after transfection, the supernatant containing lentiviruses was collected and used to infect HEK293A cells. 36 hours after infection, the cells were selected with puromycin (1 mg/mL) for one week in order to select Gal9-knockout cells. Gal9 knockout was confirmed by Western blot. Selection of single clones was performed by dilution in 96-well, which were confirmed by Western blots (Figure S5D).
Quantification and Statistical Analysis
Mass spectrometry data processing and analysis
Tandem mass spectra were extracted by Proteome Discoverer version 2.2. Charge state deconvolution and deisotoping were not performed. All MS/MS samples were analyzed using Sequest-HT (XCorr Only) (Thermo Fisher Scientific, San Jose, CA, USA; in Proteome Discoverer 2.2.0.388). Sequest (XCorr Only) was set up to search the gpm common laboratory contaminants and the Uniprot human proteome 3AUP000005640 with isoforms (Aug 2017, 93299 entries) assuming the digestion enzyme trypsin. Sequest (XCorr Only) was searched with a fragment ion mass tolerance of 0.020 Da and a parent ion tolerance of 10.0 PPM. Carbamidomethyl of cysteine was specified in Sequest (XCorr Only) as a fixed modification. Deamidated of asparagine, oxidation of methionine and acetyl of the n-terminus were specified in Sequest (XCorr Only) as variable modifications. Precursor intensity was determined using Proteome Discoverer 2.2 using the Minora Feature detector with the default options.
Scaffold (version Scaffold_4.8.2, Proteome Software Inc., Portland, OR) was used to validate MS/MS based peptide and protein identifications. Peptide identifications were accepted if they could be established at greater than 93.0% probability to achieve an FDR less than 0.1% by the Scaffold Local FDR algorithm. Protein identifications were accepted if they could be established at greater than 99.0% probability and contained at least two identified peptides. This filtering resulted in a decoy false discovery rate of 0.08% on the spectra level and 0.7% on the protein level. Protein probabilities were assigned by the Protein Prophet algorithm. Proteins that contained similar peptides and could not be differentiated based on MS/MS analysis alone were grouped to satisfy the principles of parsimony. Proteins sharing significant peptide evidence were grouped into clusters. Complete MS/MS proteomic data have been deposited at MassIVE, ID MSV000081788 and linked to ProteomeXchange accession ID PXD008390.
Data in this study are presented as means ± SEM (n ≥ 3). Data were analyzed with either analysis of variance (ANOVA) with Tukey's HSD post-hoc test, or a two-tailed Student's t test. Animal survival data were analyzed by log-rank (Mantel-Cox) method. Statistical significance was defined as: † (not significant) p ≥ 0.05 and *p < 0.05, **p < 0.01.
Data and Software Availability
The mass spectrometry ProteomeXchange (http://www.proteomexchange.org) dataset PXD008390 reported in this study has been deposited in MassIVE repository (https://massive.ucsd.edu) with the accession number for MSV000081788. Original source files (microscopy images and western blots) have been deposited in Mendeley as a Dataset available at https://data.mendeley.com/datasets/m6jwzzt37g/draft?a=f1533bde-0864-4300-bed4-a6169d4a0158.
Supplementary Material
Supplemental Table S1, related to Figure 6. APEX2-Gal8 proximity-biotinylation LC/MS/MS proteomic analysis
HEK293T cells transfected with pJJiaDEST-APEX2-Gal8 (APEX2 fusion with LGALS8) were incubated in full medium with (plus, +GPN) or without (minus, -GPN) 100 μM GPN for 1h, processed for and subjected to LC/MS/MS as described in STAR method, and proteomic data analyses Scaffold exported from Scaffold into excel sheet tabs displaying parameters as indicated in tab titles. Three repeats in treatment-control pairs are marked as follows (i-iii): (i) gpn1 (minus, full medium control) and gpn2 (plus, 100 μM GPN); (ii) gpn3 (minus, full medium control) and gpn4 (plus, 100 μM GPN); (iii) gpn5 (minus, full medium control) and gpn6 (plus, 100 μM GPN). The MS/MS proteomic data (ProteomeXchange accession ID PXD008390) have been deposited at MassIVE, ID MSV000081788. See also Figure 6G.
Highlights.
Lysosomal damage inhibits mTOR through a galectin-based system termed GALTOR
Galectin 8 inhibits mTOR via interactions with the Ragulator-Rag SLC38A9 system
Lysosomal damage activates AMPK through Galectin 9 with the engagement of TAK1
Galectins control autophagy in response to lysosomal damage via mTOR and AMPK
Acknowledgments
We thank D. Sabatini for SLC38A9 and TSC2 knockout cell lines, F. Randow for galectin constructs, and R. Zoncu for reagents, experimental suggestions, and comments. This work was supported by NIH R01 grants AI042999 and AI111935 and a center grant 1P20GM121176-01 to VD and grant 249884 from the Research Council of Norway to TJ.
Footnotes
Author Contributions: Conceptualization, J.J. and V.D.; Formal Analysis, B.P., J.J., T.J., V.D.; Investigation and Validation J.J. Y.P.A., T.J., A.C-T., Y.G., S.K., S.W.C., R.P., M.M., M.S., B.P.; Resources, V.D., T.J., B.P.; Data Curation, B.P., L.A.; Writing – Original draft, V.D., J.J.; Writing – Review and Editing, V.D., J.J.; Visualization, J.J., Y.P.A., L.A., B.P.; Supervision, V.D., T.J. and B.P.; Project Administration, V.D.; Funding Acquisition, T.J. and V.D.
Declaration of Interests: The authors declare no competing interests.
Publisher's Disclaimer: This is a PDF file of an unedited manuscript that has been accepted for publication. As a service to our customers we are providing this early version of the manuscript. The manuscript will undergo copyediting, typesetting, and review of the resulting proof before it is published in its final citable form. Please note that during the production process errors may be discovered which could affect the content, and all legal disclaimers that apply to the journal pertain.
References
- Aits S, Kricker J, Liu B, Ellegaard AM, Hamalisto S, Tvingsholm S, Corcelle-Termeau E, Hogh S, Farkas T, Holm Jonassen A, et al. Sensitive detection of lysosomal membrane permeabilization by lysosomal galectin puncta assay. Autophagy. 2015;11:1408–1424. doi: 10.1080/15548627.2015.1063871. [DOI] [PMC free article] [PubMed] [Google Scholar]
- Arthur CM, Baruffi MD, Cummings RD, Stowell SR. Evolving mechanistic insights into galectin functions. Methods Mol Biol. 2015;1207:1–35. doi: 10.1007/978-1-4939-1396-1_1. [DOI] [PMC free article] [PubMed] [Google Scholar]
- Bar-Peled L, Schweitzer LD, Zoncu R, Sabatini DM. Ragulator is a GEF for the rag GTPases that signal amino acid levels to mTORC1. Cell. 2012;150:1196–1208. doi: 10.1016/j.cell.2012.07.032. [DOI] [PMC free article] [PubMed] [Google Scholar]
- Berg TO, Stromhaug E, Lovdal T, Seglen O, Berg T. Use of glycyl-L-phenylalanine 2-naphthylamide, a lysosome-disrupting cathepsin C substrate, to distinguish between lysosomes and prelysosomal endocytic vacuoles. Biochem J. 1994;300(Pt 1):229–236. doi: 10.1042/bj3000229. [DOI] [PMC free article] [PubMed] [Google Scholar]
- Betz C, Hall MN. Where is mTOR and what is it doing there? J Cell Biol. 2013;203:563–574. doi: 10.1083/jcb.201306041. [DOI] [PMC free article] [PubMed] [Google Scholar]
- Carroll B, Maetzel D, Maddocks OD, Otten G, Ratcliff M, Smith GR, Dunlop EA, Passos JF, Davies OR, Jaenisch R, et al. Control of TSC2-Rheb signaling axis by arginine regulates mTORC1 activity. eLife. 2016;5 doi: 10.7554/eLife.11058. [DOI] [PMC free article] [PubMed] [Google Scholar]
- Castellano BM, Thelen AM, Moldavski O, Feltes M, van der Welle RE, Mydock-McGrane L, Jiang X, van Eijkeren RJ, Davis OB, Louie SM, et al. Lysosomal cholesterol activates mTORC1 via an SLC38A9-Niemann-Pick C1 signaling complex. Science. 2017;355:1306–1311. doi: 10.1126/science.aag1417. [DOI] [PMC free article] [PubMed] [Google Scholar]
- Chauhan S, Kumar S, Jain A, Ponpuak M, Mudd MH, Kimura T, Choi SW, Peters R, Mandell M, Bruun JA, et al. TRIMs and Galectins Globally Cooperate and TRIM16 and Galectin-3 Co-direct Autophagy in Endomembrane Damage Homeostasis. Dev Cell. 2016;39:13–27. doi: 10.1016/j.devcel.2016.08.003. [DOI] [PMC free article] [PubMed] [Google Scholar]
- Demetriades C, Doumpas N, Teleman AA. Regulation of TORC1 in response to amino acid starvation via lysosomal recruitment of TSC2. Cell. 2014;156:786–799. doi: 10.1016/j.cell.2014.01.024. [DOI] [PMC free article] [PubMed] [Google Scholar]
- Deosaran E, Larsen KB, Hua R, Sargent G, Wang Y, Kim S, Lamark T, Jauregui M, Law K, Lippincott-Schwartz J, et al. NBR1 acts as an autophagy receptor for peroxisomes. J Cell Sci. 2013;126:939–952. doi: 10.1242/jcs.114819. [DOI] [PubMed] [Google Scholar]
- Deretic V, Levine B. Autophagy balances inflammation in innate immunity. Autophagy. 2018:1–9. doi: 10.1080/15548627.2017.1402992. [DOI] [PMC free article] [PubMed] [Google Scholar]
- Deretic V, Saitoh T, Akira S. Autophagy in infection, inflammation and immunity. Nat Rev Immunol. 2013;13:722–737. doi: 10.1038/nri3532. [DOI] [PMC free article] [PubMed] [Google Scholar]
- Fujita N, Morita E, Itoh T, Tanaka A, Nakaoka M, Osada Y, Umemoto T, Saitoh T, Nakatogawa H, Kobayashi S, et al. Recruitment of the autophagic machinery to endosomes during infection is mediated by ubiquitin. J Cell Biol. 2013;203:115–128. doi: 10.1083/jcb.201304188. [DOI] [PMC free article] [PubMed] [Google Scholar]
- Garcia D, Shaw RJ. AMPK: Mechanisms of Cellular Energy Sensing and Restoration of Metabolic Balance. Mol Cell. 2017;66:789–800. doi: 10.1016/j.molcel.2017.05.032. [DOI] [PMC free article] [PubMed] [Google Scholar]
- Gutierrez MG, Master SS, Singh SB, Taylor GA, Colombo MI, Deretic V. Autophagy is a defense mechanism inhibiting BCG and Mycobacterium tuberculosis survival in infected macrophages. Cell. 2004;119:753–766. doi: 10.1016/j.cell.2004.11.038. [DOI] [PubMed] [Google Scholar]
- Gwinn DM, Shackelford DB, Egan DF, Mihaylova MM, Mery A, Vasquez DS, Turk BE, Shaw RJ. AMPK phosphorylation of raptor mediates a metabolic checkpoint. Mol Cell. 2008;30:214–226. doi: 10.1016/j.molcel.2008.03.003. [DOI] [PMC free article] [PubMed] [Google Scholar]
- Hawley SA, Boudeau J, Reid JL, Mustard KJ, Udd L, Makela TP, Alessi DR, Hardie DG. Complexes between the LKB1 tumor suppressor, STRAD alpha/beta and MO25 alpha/beta are upstream kinases in the AMP-activated protein kinase cascade. Journal of Biology. 2003;2:28. doi: 10.1186/1475-4924-2-28. [DOI] [PMC free article] [PubMed] [Google Scholar]
- Hawley SA, Pan DA, Mustard KJ, Ross L, Bain J, Edelman AM, Frenguelli BG, Hardie DG. Calmodulin-dependent protein kinase kinase-beta is an alternative upstream kinase for AMP-activated protein kinase. Cell Metabolism. 2005;2:9–19. doi: 10.1016/j.cmet.2005.05.009. [DOI] [PubMed] [Google Scholar]
- Herrero-Martin G, Hoyer-Hansen M, Garcia-Garcia C, Fumarola C, Farkas T, Lopez-Rivas A, Jaattela M. TAK1 activates AMPK-dependent cytoprotective autophagy in TRAIL-treated epithelial cells. The EMBO journal. 2009;28:677–685. doi: 10.1038/emboj.2009.8. [DOI] [PMC free article] [PubMed] [Google Scholar]
- Hornung V, Bauernfeind F, Halle A, Samstad EO, Kono H, Rock KL, Fitzgerald KA, Latz E. Silica crystals and aluminum salts activate the NALP3 inflammasome through phagosomal destabilization. Nat Immunol. 2008;9:847–856. doi: 10.1038/ni.1631. [DOI] [PMC free article] [PubMed] [Google Scholar]
- Hung V, Udeshi ND, Lam SS, Loh KH, Cox KJ, Pedram K, Carr SA, Ting AY. Spatially resolved proteomic mapping in living cells with the engineered peroxidase APEX2. Nat Protoc. 2016;11:456–475. doi: 10.1038/nprot.2016.018. [DOI] [PMC free article] [PubMed] [Google Scholar]
- Hung V, Zou P, Rhee HW, Udeshi ND, Cracan V, Svinkina T, Carr SA, Mootha VK, Ting AY. Proteomic mapping of the human mitochondrial intermembrane space in live cells via ratiometric APEX tagging. Mol Cell. 2014;55:332–341. doi: 10.1016/j.molcel.2014.06.003. [DOI] [PMC free article] [PubMed] [Google Scholar]
- Inoki K, Li Y, Xu T, Guan KL. Rheb GTPase is a direct target of TSC2 GAP activity and regulates mTOR signaling. Genes Dev. 2003;17:1829–1834. doi: 10.1101/gad.1110003. [DOI] [PMC free article] [PubMed] [Google Scholar]
- Jayaraman P, Sada-Ovalle I, Beladi S, Anderson AC, Dardalhon V, Hotta C, Kuchroo VK, Behar SM. Tim3 binding to galectin-9 stimulates antimicrobial immunity. J Exp Med. 2010;207:2343–2354. doi: 10.1084/jem.20100687. [DOI] [PMC free article] [PubMed] [Google Scholar]
- Johansen T, Lamark T. Selective autophagy mediated by autophagic adapter proteins. Autophagy. 2011;7:279–296. doi: 10.4161/auto.7.3.14487. [DOI] [PMC free article] [PubMed] [Google Scholar]
- Jung J, Genau HM, Behrends C. Amino Acid-Dependent mTORC1 Regulation by the Lysosomal Membrane Protein SLC38A9. Mol Cell Bio. 2015;35:2479–2494. doi: 10.1128/MCB.00125-15. [DOI] [PMC free article] [PubMed] [Google Scholar]
- Karanasios E, Walker SA, Okkenhaug H, Manifava M, Hummel E, Zimmermann H, Ahmed Q, Domart MC, Collinson L, Ktistakis NT. Autophagy initiation by ULK complex assembly on ER tubulovesicular regions marked by ATG9 vesicles. Nat Comm. 2016;7:12420. doi: 10.1038/ncomms12420. [DOI] [PMC free article] [PubMed] [Google Scholar]
- Khaminets A, Heinrich T, Mari M, Grumati P, Huebner AK, Akutsu M, Liebmann L, Stolz A, Nietzsche S, Koch N, et al. Regulation of endoplasmic reticulum turnover by selective autophagy. Nature. 2015;522:354–358. doi: 10.1038/nature14498. [DOI] [PubMed] [Google Scholar]
- Kim E, Goraksha-Hicks P, Li L, Neufeld TP, Guan KL. Regulation of TORC1 by Rag GTPases in nutrient response. Nature Cell Biol. 2008;10:935–945. doi: 10.1038/ncb1753. [DOI] [PMC free article] [PubMed] [Google Scholar]
- Kim J, Kundu M, Viollet B, Guan KL. AMPK and mTOR regulate autophagy through direct phosphorylation of Ulk1. Nat Cell Biol. 2011;13:132–141. doi: 10.1038/ncb2152. [DOI] [PMC free article] [PubMed] [Google Scholar]
- Lam SS, Martell JD, Kamer KJ, Deerinck TJ, Ellisman MH, Mootha VK, Ting AY. Directed evolution of APEX2 for electron microscopy and proximity labeling. Nature Methods. 2015;12:51–54. doi: 10.1038/nmeth.3179. [DOI] [PMC free article] [PubMed] [Google Scholar]
- Lazarou M, Sliter DA, Kane LA, Sarraf SA, Wang C, Burman JL, Sideris DP, Fogel AI, Youle RJ. The ubiquitin kinase PINK1 recruits autophagy receptors to induce mitophagy. Nature. 2015;524:309–314. doi: 10.1038/nature14893. [DOI] [PMC free article] [PubMed] [Google Scholar]
- Liu H, Sadygov RG, Yates JR., 3rd A model for random sampling and estimation of relative protein abundance in shotgun proteomics. Anal Chem. 2004;76:4193–4201. doi: 10.1021/ac0498563. [DOI] [PubMed] [Google Scholar]
- Long X, Lin Y, Ortiz-Vega S, Yonezawa K, Avruch J. Rheb binds and regulates the mTOR kinase. Current biology. 2005;15:702–713. doi: 10.1016/j.cub.2005.02.053. [DOI] [PubMed] [Google Scholar]
- Manifava M, Smith M, Rotondo S, Walker S, Niewczas I, Zoncu R, Clark J, Ktistakis NT. Dynamics of mTORC1 activation in response to amino acids. Elife. 2016;5 doi: 10.7554/eLife.19960. [DOI] [PMC free article] [PubMed] [Google Scholar]
- Manzanillo PS, Shiloh MU, Portnoy DA, Cox JS. Mycobacterium Tuberculosis Activates the DNA-Dependent Cytosolic Surveillance Pathway within Macrophages. Cell Host & Microbe. 2012;11:469–480. doi: 10.1016/j.chom.2012.03.007. [DOI] [PMC free article] [PubMed] [Google Scholar]
- Mizushima N, Yoshimori T, Ohsumi Y. The role of atg proteins in autophagosome formation. Ann Rev Cell Dev Bio. 2011;27:107–132. doi: 10.1146/annurev-cellbio-092910-154005. [DOI] [PubMed] [Google Scholar]
- Napolitano G, Ballabio A. TFEB at a glance. J Cell Sci. 2016;129:2475–2481. doi: 10.1242/jcs.146365. [DOI] [PMC free article] [PubMed] [Google Scholar]
- O'Neill LA, Kishton RJ, Rathmell J. A guide to immunometabolism for immunologists. Nat Rev Immunol. 2016;16:553–565. doi: 10.1038/nri.2016.70. [DOI] [PMC free article] [PubMed] [Google Scholar]
- Rebsamen M, Pochini L, Stasyk T, de Araujo ME, Galluccio M, Kandasamy RK, Snijder B, Fauster A, Rudashevskaya EL, Bruckner M, et al. SLC38A9 is a component of the lysosomal amino acid sensing machinery that controls mTORC1. Nature. 2015;519:477–481. doi: 10.1038/nature14107. [DOI] [PMC free article] [PubMed] [Google Scholar]
- Rhee HW, Zou P, Udeshi ND, Martell JD, Mootha VK, Carr SA, Ting AY. Proteomic mapping of mitochondria in living cells via spatially restricted enzymatic tagging. Science. 2013;339:1328–1331. doi: 10.1126/science.1230593. [DOI] [PMC free article] [PubMed] [Google Scholar]
- Sancak Y, Bar-Peled L, Zoncu R, Markhard AL, Nada S, Sabatini DM. Ragulator-Rag complex targets mTORC1 to the lysosomal surface and is necessary for its activation by amino acids. Cell. 2010;141:290–303. doi: 10.1016/j.cell.2010.02.024. [DOI] [PMC free article] [PubMed] [Google Scholar]
- Sancak Y, Peterson TR, Shaul YD, Lindquist RA, Thoreen CC, Bar-Peled L, Sabatini DM. The Rag GTPases bind raptor and mediate amino acid signaling to mTORC1. Science. 2008;320:1496–1501. doi: 10.1126/science.1157535. [DOI] [PMC free article] [PubMed] [Google Scholar]
- Sancak Y, Thoreen CC, Peterson TR, Lindquist RA, Kang SA, Spooner E, Carr SA, Sabatini DM. PRAS40 is an insulin-regulated inhibitor of the mTORC1 protein kinase. Mol Cell. 2007;25:903–915. doi: 10.1016/j.molcel.2007.03.003. [DOI] [PubMed] [Google Scholar]
- Saxton RA, Sabatini DM. mTOR Signaling in Growth, Metabolism, and Disease. Cell. 2017;168:960–976. doi: 10.1016/j.cell.2017.02.004. [DOI] [PMC free article] [PubMed] [Google Scholar]
- Shaw RJ, Bardeesy N, Manning BD, Lopez L, Kosmatka M, DePinho RA, Cantley LC. The LKB1 tumor suppressor negatively regulates mTOR signaling. Cancer Cell. 2004;6:91–99. doi: 10.1016/j.ccr.2004.06.007. [DOI] [PubMed] [Google Scholar]
- Stowell SR, Arthur CM, Dias-Baruffi M, Rodrigues LC, Gourdine JP, Heimburg-Molinaro J, Ju T, Molinaro RJ, Rivera-Marrero C, Xia B, et al. Innate immune lectins kill bacteria expressing blood group antigen. Nature Medicine. 2010;16:295–301. doi: 10.1038/nm.2103. [DOI] [PMC free article] [PubMed] [Google Scholar]
- Tee AR, Manning BD, Roux PP, Cantley LC, Blenis J. Tuberous sclerosis complex gene products, Tuberin and Hamartin, control mTOR signaling by acting as a GTPase-activating protein complex toward Rheb. Current biology. 2003;13:1259–1268. doi: 10.1016/s0960-9822(03)00506-2. [DOI] [PubMed] [Google Scholar]
- Thiele DL, Lipsky PE. Mechanism of L-leucyl-L-leucine methyl ester-mediated killing of cytotoxic lymphocytes: dependence on a lysosomal thiol protease, dipeptidyl peptidase I, that is enriched in these cells. Proc Natl Acad Sci U S A. 1990;87:83–87. doi: 10.1073/pnas.87.1.83. [DOI] [PMC free article] [PubMed] [Google Scholar]
- Thurston TL, Wandel MP, von Muhlinen N, Foeglein A, Randow F. Galectin 8 targets damaged vesicles for autophagy to defend cells against bacterial invasion. Nature. 2012;482:414–418. doi: 10.1038/nature10744. [DOI] [PMC free article] [PubMed] [Google Scholar]
- Wang S, Tsun ZY, Wolfson RL, Shen K, Wyant GA, Plovanich ME, Yuan ED, Jones TD, Chantranupong L, Comb W, et al. Metabolism. Lysosomal amino acid transporter SLC38A9 signals arginine sufficiency to mTORC1. Science. 2015;347:188–194. doi: 10.1126/science.1257132. [DOI] [PMC free article] [PubMed] [Google Scholar]
- Woods A, Dickerson K, Heath R, Hong SP, Momcilovic M, Johnstone SR, Carlson M, Carling D. Ca2+/calmodulin-dependent protein kinase kinase-beta acts upstream of AMP-activated protein kinase in mammalian cells. Cell metabolism. 2005;2:21–33. doi: 10.1016/j.cmet.2005.06.005. [DOI] [PubMed] [Google Scholar]
- Woods A, Johnstone SR, Dickerson K, Leiper FC, Fryer LG, Neumann D, Schlattner U, Wallimann T, Carlson M, Carling D. LKB1 is the upstream kinase in the AMP-activated protein kinase cascade. Current biology. 2003;13:2004–2008. doi: 10.1016/j.cub.2003.10.031. [DOI] [PubMed] [Google Scholar]
- Zhang CS, Jiang B, Li M, Zhu M, Peng Y, Zhang YL, Wu YQ, Li TY, Liang Y, Lu Z, et al. The lysosomal v-ATPase-Ragulator complex is a common activator for AMPK and mTORC1, acting as a switch between catabolism and anabolism. Cell Metabolism. 2014;20:526–540. doi: 10.1016/j.cmet.2014.06.014. [DOI] [PubMed] [Google Scholar]
- Zhang J, Tripathi DN, Jing J, Alexander A, Kim J, Powell RT, Dere R, Tait-Mulder J, Lee JH, Paull TT, et al. ATM functions at the peroxisome to induce pexophagy in response to ROS. Nat Cell Biol. 2015;17:1259–1269. doi: 10.1038/ncb3230. [DOI] [PMC free article] [PubMed] [Google Scholar]
- Zoncu R, Bar-Peled L, Efeyan A, Wang S, Sancak Y, Sabatini DM. mTORC1 senses lysosomal amino acids through an inside-out mechanism that requires the vacuolar H(+)-ATPase. Science. 2011;334:678–683. doi: 10.1126/science.1207056. [DOI] [PMC free article] [PubMed] [Google Scholar]
Associated Data
This section collects any data citations, data availability statements, or supplementary materials included in this article.
Supplementary Materials
Supplemental Table S1, related to Figure 6. APEX2-Gal8 proximity-biotinylation LC/MS/MS proteomic analysis
HEK293T cells transfected with pJJiaDEST-APEX2-Gal8 (APEX2 fusion with LGALS8) were incubated in full medium with (plus, +GPN) or without (minus, -GPN) 100 μM GPN for 1h, processed for and subjected to LC/MS/MS as described in STAR method, and proteomic data analyses Scaffold exported from Scaffold into excel sheet tabs displaying parameters as indicated in tab titles. Three repeats in treatment-control pairs are marked as follows (i-iii): (i) gpn1 (minus, full medium control) and gpn2 (plus, 100 μM GPN); (ii) gpn3 (minus, full medium control) and gpn4 (plus, 100 μM GPN); (iii) gpn5 (minus, full medium control) and gpn6 (plus, 100 μM GPN). The MS/MS proteomic data (ProteomeXchange accession ID PXD008390) have been deposited at MassIVE, ID MSV000081788. See also Figure 6G.