Abstract
In epilepsy, seizures can evoke cardiac rhythm disturbances such as heart rate changes, conduction blocks, asystoles, and arrhythmias, which can potentially increase risk of sudden unexpected death in epilepsy (SUDEP). Electroencephalography (EEG) and electrocardiography (ECG) are widely used clinical diagnostic tools to monitor for abnormal brain and cardiac rhythms in patients. Here, a technique to simultaneously record video, EEG, and ECG in mice to measure behavior, brain, and cardiac activities, respectively, is described. The technique described herein utilizes a tethered (i.e., wired) recording configuration in which the implanted electrode on the head of the mouse is hard-wired to the recording equipment. Compared to wireless telemetry recording systems, the tethered arrangement possesses several technical advantages such as a greater possible number of channels for recording EEG or other biopotentials; lower electrode costs; and greater frequency bandwidth (i.e., sampling rate) of recordings. The basics of this technique can also be easily modified to accommodate recording other biosignals, such as electromyography (EMG) or plethysmography for assessment of muscle and respiratory activity, respectively. In addition to describing how to perform the EEG-ECG recordings, we also detail methods to quantify the resulting data for seizures, EEG spectral power, cardiac function, and heart rate variability, which we demonstrate in an example experiment using a mouse with epilepsy due to Kcna1 gene deletion. Video-EEG-ECG monitoring in mouse models of epilepsy or other neurological disease provides a powerful tool to identify dysfunction at the level of the brain, heart, or brain-heart interactions.
Keywords: Genetics, Issue 131, Electroencephalography, electrocardiography, seizure, heart rate variability, power spectrum analysis, atrioventricular conduction block, brain-heart interaction
Introduction
Electroencephalography (EEG) and electrocardiography (ECG) are powerful and widely used techniques for assessing in vivo brain and cardiac function, respectively. EEG is the recording of electrical brain activity by attaching electrodes to the scalp1. The signal recorded with non-invasive EEG represents voltage fluctuations arising from summated excitatory and inhibitory postsynaptic potentials generated mainly by cortical pyramidal neurons1,2. EEG is the most common neurodiagnostic test for evaluating and managing patients with epilepsy3,4. It is especially useful when epileptic seizures occur without obvious convulsive behavioral manifestations, such as absence seizures or non-convulsive status epilepticus5,6. Conversely, non-epilepsy related conditions that lead to convulsive episodes or loss of consciousness may be misdiagnosed as epileptic seizures without video-EEG monitoring7. In addition to its usefulness in the field of epilepsy, EEG is also widely used to detect abnormal brain activity associated with sleep disorders, encephalopathies, and memory disorders, as well as to supplement general anesthesia during surgeries2,8,9.
In contrast to EEG, ECG (or EKG as it is sometimes abbreviated) is the recording of the electrical activity of the heart10. ECGs are usually performed by attaching electrodes to the limb extremities and chest wall, which allows detection of the voltage changes generated by the myocardium during each cardiac cycle of contraction and relaxation10,11. The primary ECG waveform components of a normal cardiac cycle include the P wave, the QRS complex, and the T wave, which correspond to atrial depolarization, ventricular depolarization, and ventricular repolarization, respectively10,11. ECG monitoring is routinely used to identify cardiac arrhythmias and defects of the cardiac conduction system12. Among epilepsy patients, the importance of using ECG to identify potentially life-threatening arrhythmias is amplified since they are at significantly increased risk of sudden cardiac arrest, as well as sudden unexpected death in epilepsy13,14,15.
In addition to their clinical applications, EEG and ECG recordings have become an indispensable tool for identifying brain and heart dysfunction in mouse models of disease. Although traditionally these recordings have been performed separately, here we describe a technique to record video, EEG, and ECG simultaneously in mice. The simultaneous video-EEG-ECG method detailed here utilizes a tethered recording configuration in which the implanted electrode on the head of the mouse is hard-wired to the recording equipment. Historically, this tethered, or wired, configuration has been the standard and most extensively used method for EEG recordings in mice; however, wireless EEG telemetry systems have also been developed recently and are gaining in popularity16.
Compared to wireless EEG systems, the tethered arrangement possesses several technical advantages that may make it preferable depending on the desired application. These advantages include a greater number of channels for recording EEG or other biopotentials; lower electrode costs; electrode disposability; less susceptibility to signal loss; and greater frequency bandwidth (i.e., sampling rate) of recordings17. Done properly, the tethered recording method described here is capable of providing high quality, artifact-free EEG, and ECG data simultaneously, along with the corresponding video for behavioral monitoring. This EEG and ECG data can then be mined to identify neural, cardiac, or neurocardiac abnormalities such as seizures, changes in EEG power spectrum, cardiac conduction blocks (i.e., skipped heart beats), and changes in heart rate variability. To demonstrate the application of these EEG-ECG quantitative methods, we present an example experiment using a Kcna1 knockout (-/-) mouse. Kcna1-/- mice lack voltage-gated Kv1.1 α-subunits and as a consequence exhibit spontaneous seizures, cardiac dysfunction, and premature death, making them an ideal model for simultaneous EEG-ECG evaluation of deleterious epilepsy-associated neurocardiac dysfunction.
Protocol
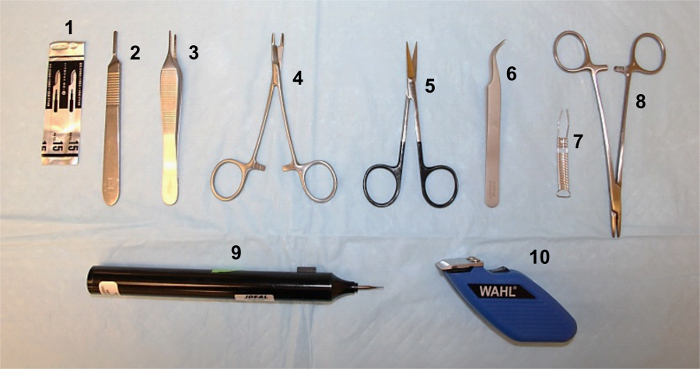
All experimental procedures should be carried out in accordance with the guidelines of the National Institutes of Health (NIH), as approved by your institution's Institutional Animal Care and Use Committee (IACUC). The main surgical tools needed for this protocol are shown in Figure 1.
1. Preparing Electrode for Implantation
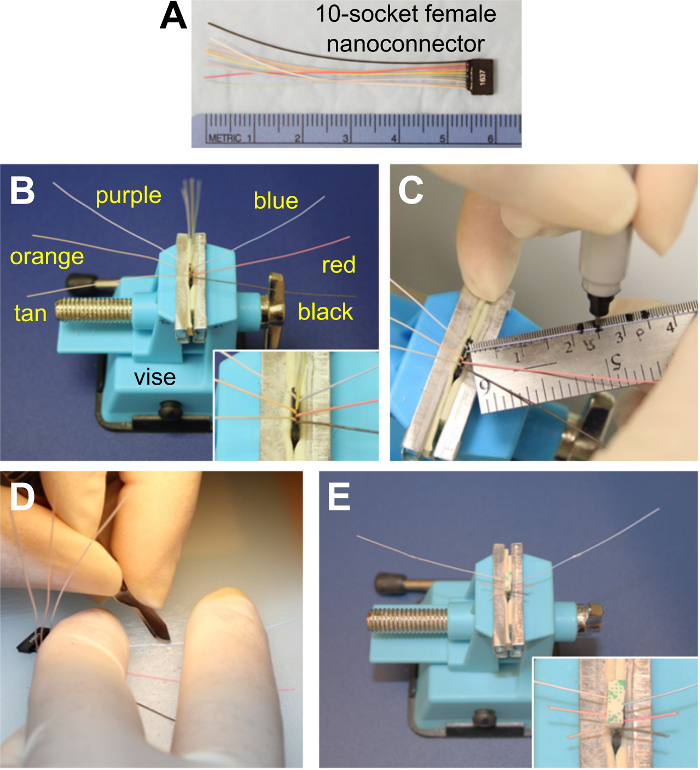
Place the 10-socket female nanoconnector (i.e, the electrode; Figure 2A) into a tabletop vise with the 10 wires facing up and the black wire in the front. Using fine forceps, fold down the first (black) wire to the right and the second (tan) wire to the left. Next fold down the red, orange, blue, and purple wires alternating right and left (Figure 2B). Cut off the yellow, green, white, and gray wires at the base of their attachment.
To prepare the ECG wires, use a permanent marker to make marks on the purple wire at ~3.2 cm and ~3.5 cm from the base of the electrode and on the blue wire at ~2.2 cm and ~2.5 cm (Figure 2C). Remove the electrode from the vise and expose the silver filaments between the marked areas by stripping the insulation on one side of the wire with a scalpel blade (Figure 2D). NOTE: Scraping the wires should be done under the microscope. Caution should be used to ensure the silver filaments are not damaged as the insulation is scraped away.
Place the electrode back in the vise. Affix a piece of double-sided mounting tape, precut to the length and width of the electrode, to the top of the wires using a thin layer of superglue. NOTE: Before adhering the tape, be sure that the wires are lying flat, sticking straight out to the sides, and not twisted over one another.
Trim the wires to be used for EEG at a slightly V-shaped angle to a length of approximately 7-9 mm, with the tan and black wires cut the shortest. Do not cut the wires to be used for ECG (Figure 2E).
Package and sterilize the electrode for later use.
2. Preparing the Mouse for Surgery
Weigh the mouse. Inject a 5 mg/kg dose of Carprofen subcutaneously (s.c.). Anesthetize the animal with an intraperitoneal (i.p.) injection of Mouse Anesthetic Cocktail containing Ketamine (80 mg/kg), Xylazine (10 mg/kg), and Acepromazine (1 mg/kg).
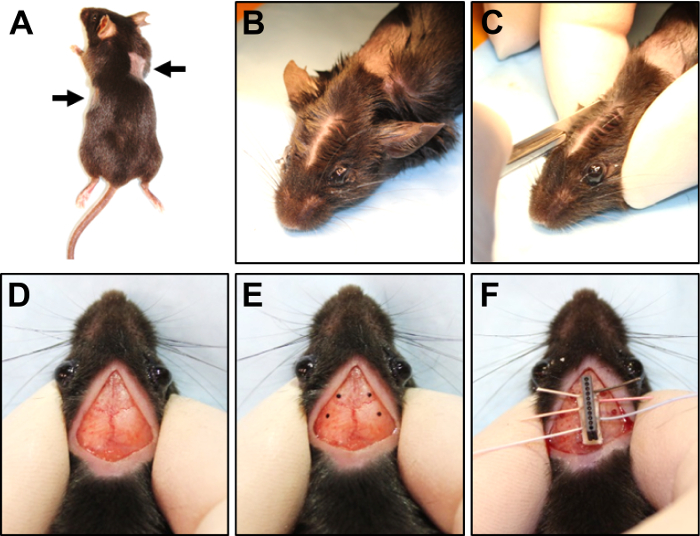
Once the mouse becomes anesthetized, apply a thin line of veterinary ophthalmic ointment to each eye. Using an electric trimmer, shave two small areas (~2 cm2) on both sides of the trunk of the mouse, corresponding to where the ECG wires will be implanted (Figure 3A). NOTE: The shaved area on the right side should be located in an approximately dorsolateral position just behind the right "armpit" of the animal. On the left side, the shaved area should be located in a more ventrolateral orientation along the side of the animal, but about 1 cm more posterior than the shaved area on the right side (Figure 3A).
Remove the clipped hair and clean both shaved areas with a chlorhexidine solution.
3. Attaching the Electrode to the Skull
Place the mouse in the prone position on the stage of the dissecting microscope and confirm the adequate depth of anesthesia by the absence of the toe-pinch reflex. NOTE: Steps 3.2 to 5.6 should be done with the aid of a microscope.
Holding the head steady between the thumb and forefinger, part the fur down the center of the head from between the ears to just behind the eyes with a cotton swab soaked in alcohol (Figure 3B). NOTE: Although this surgery should be done with aseptic technique, it is not a sterile procedure since the scalp cannot be shaved and the mouse must be manipulated during the surgery.
- Using a scalpel, make a ~1-cm midline incision through the scalp between the parted fur from just in front of the ears to just between the eyes (Figure 3C, D).
- Using either the side of the scalpel or a cotton-tipped applicator, gently scrape the mucus membrane on top of the skull until the bone appears dry.
- Pluck the fur around the perimeter of the incision forming a thin border of bald skin. Carefully remove any fur that may have fallen into the surgical field with a pair of forceps. Dry the surface of the skull with a sterile cotton-tipped applicator, applying gentle pressure for several seconds if needed.
Make four marks on the skull with a sterilized permanent marker at the sites where the burr holes will be drilled (Figure 3E). Place two marks, one on each side of the sagittal suture anterior to bregma, approximately 4 mm anterior and 5 mm lateral to bregma (above frontal cortex), for the reference and ground wires. Place another two marks, one on each side of the sagittal suture posterior to bregma, approximately 2 mm posterior and 7 mm lateral to bregma (above parietotemporal cortex), for the two EEG recording wires. NOTE: This is not a stereotactic surgery and the distances given are approximations which will vary depending on the size of the mouse. Ensure that the holes are placed far enough laterally to easily accommodate the base of the electrode implant which will be affixed to the midline along the sagittal suture (Figure 3F).
- Using a sterile micro drill, make small burr holes at each mark with a 0.8-mm diameter drill bit.
- Apply gentle pressure while drilling to create small recesses at each marked spot. Drill through the skull by pulsing the drill bit as the hole nears completion, being sure not to apply too much pressure, which could lead to penetrating and damaging the underlying brain tissue.
- After all holes are drilled, wipe the area clean with a cotton-tipped applicator.
- To adhere the electrode to the top of the skull, remove the paper backing from the double-sided mounting tape on the electrode. Apply a thin layer of superglue to the tape. Using a pair of forceps, remove the electrode from the vise. Orient it such that, when positioned along the sagittal suture, the shorter EEG wires are rostral and the longer ECG wires are caudal.
- Adhere the electrode to the skull over the sagittal suture between the holes (Figure 3F). NOTE: The skull must be completely dry for the glue on the electrode to stick. Be sure not to occlude the burr holes in the skull with the electrode or glue.
- Briefly, hold the electrode in place to ensure adhesion to the skull and then allow the glue to dry for 5-10 min.
4. Implanting the Wires for ECG
Rotate the mouse slightly onto its right side while keeping the head upright. Take the long ECG wire on the left side and extend it down the side of the mouse to the shaved area on the left side. Visualize where the exposed wire will be positioned once it is tunneled beneath the skin. NOTE: For reference, a small mark can be made on the skin with a permanent marker.
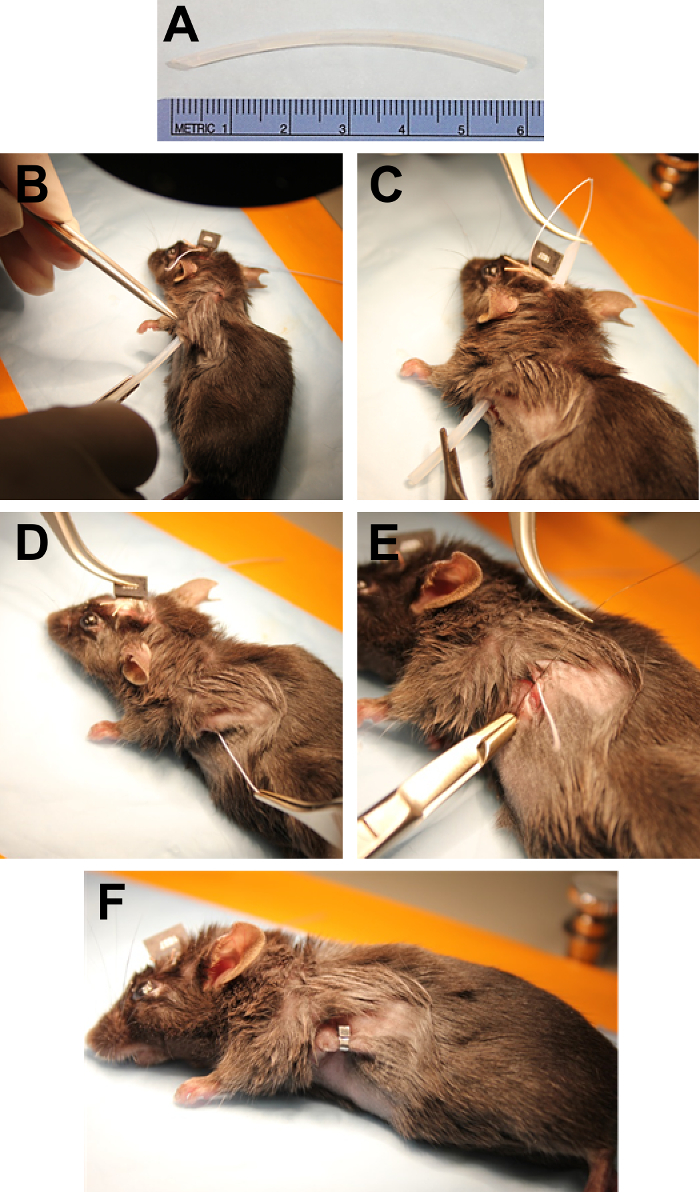
Using a scalpel, make a ~1-cm incision in the skin at the location where the exposed wire will be positioned. While holding the incision open with Adson forceps, use Dumont forceps to loosen the skin around the incision from the underlying connective tissue to form a pocket for the wire. Beginning at the incision site on the side of the animal, tunnel subcutaneously with a piece of sterile polyethylene tubing (that has been prepared by cutting it to ~6 cm in length with the leading edge beveled) until the beveled edge exits the incision made on the head (Figure 4A, B).
Feed the ECG wire through the tubing using Dumont forceps (Figure 4C). While removing the tubing, grasp the electrode wire with Adson forceps as it exits the lateral incision. Pull the wire taut (Figure 4D).
Fix the ECG wire in place by suturing it to the tissue under the skin with 6-0 Nylon (Figure 4E). Using forceps and Olsen-Hegar needle holders, apply one suture over the exposed filaments and another suture either before or after the exposed portion.
Cut the electrode wire about 2-3 mm past the last suture and tuck the end into the pocket of skin formed previously. Pull the two sides of the incision together and close with a wound clip applied using Crile-Wood needle holders (Figure 4F).
Turn the mouse so that the nose is pointing in the opposite direction. With the head still in the upright prone position, rotate the mouse slightly onto its left side.
Repeat the above steps to place the contralateral ECG wire. NOTE: To approximate a lead II ECG recording configuration, the right ECG wire should be placed slightly more dorsal and anterior than the left ECG wire, which should be slightly more ventral and posterior.
5. Implanting the Wires for EEG
To implant the wires for EEG, place the mouse flat in the prone position and hold the scalp incision open with the thumb and forefinger of the non-dominant hand.
With forceps, remove any fur that may have been pulled under the skin by the tubing. If necessary, dry the skull again with a cotton-tipped applicator. Using Dumont forceps, carefully scoop out and remove any debris or blood clots that may have collected in the burr holes.
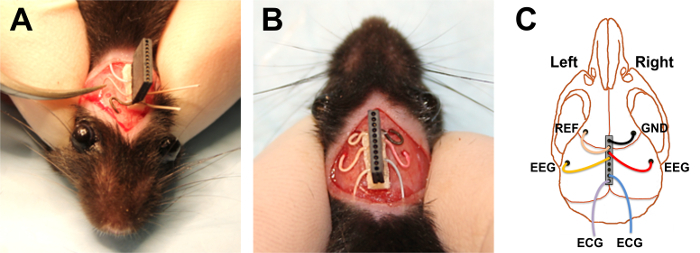
Starting with the most anterior hole on one side, bend the wire that is closest to that hole so that it is positioned directly over the hole but not yet inserted. Grasp the lower end of the wire and feed it as horizontally as possible into the hole until ~2-3 mm of the wire is under the skull (Figure 5A). NOTE: The wires should lie horizontally between the skull and the surface of the brain. The wires should not impale the brain.
With the end of the wire secure in the hole, gently fold down the remaining portion of the wire so that it lies flat against the skull.
Continue in the same manner with the posterior wire on the same side. Repeat for the anterior and posterior wires on the other side (Figure 5B). NOTE: The wire configuration is summarized in Figure 5C.
6. Closing the Head Incision with Dental Cement
Mix two scoops of polycarboxylate powder with ~5 drops of polycarboxylate liquid. Stir the mixture with a toothpick to make a paste with the desired viscosity. NOTE: Subsequent steps 6.2 to 6.4 must be performed quickly since the dental cement dries within 1 min after mixing.
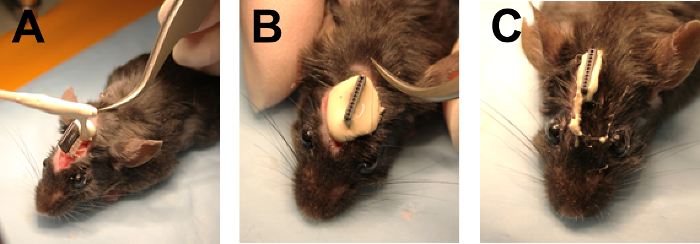
Pick up a large drop of cement paste with the toothpick and apply it around the base of the electrode beginning caudally (Figure 6A). Continue around the electrode allowing the cement to drip over the wires forming a cap around the implant (Figure 6B).
Using Dumont forceps, pull the fur at the edges of the incision up over the cement cap and press together, being careful not to disturb the wires implanted beneath. Press the fur up into the cement to help with closure.
Seal the incision between the eyes by bonding the fur with the dental cement (Figure 6C).
7. Aiding Post-Surgical Recovery
Place the mouse in an empty cage on a circulating heat pad. Monitor the mouse until it regains consciousness and can maintain sternal recumbency.
Post-surgically, house the mouse individually in a cage with food pellets and hydrating gel placed on the floor of the cage. Top the cage with a micro-isolator lid.
At 24 h post-surgery, inject (s.c.) the mouse with 5 mg/kg Carprofen.
Allow ≥ 48 h of post-surgical recovery before recording.
8. Recording EEG-ECG Signals from a Tethered Mouse
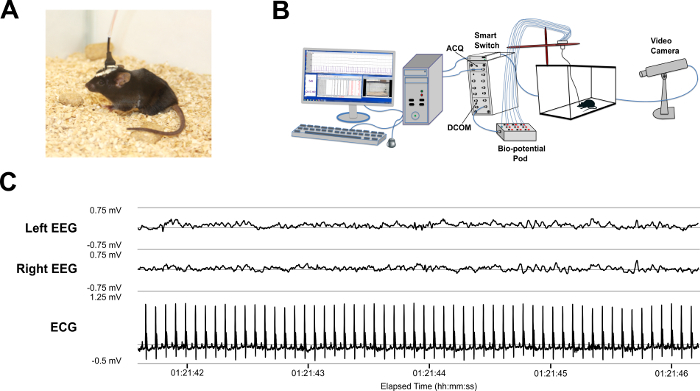
Following recovery, transfer the implanted mouse to a recording chamber with transparent walls to facilitate video monitoring.To tether (i.e., "plug in") the mouse (Figure 7A), gently but firmly hold the mouse in one hand while using the other hand to insert the 10-pin (male) nanoconnector with guide post into the sockets of the EEG-ECG electrode implant (female) on the mouse's head.
Secure the wiring above the chamber using a support rod, ensure there is enough slack in the wire to permit the mouse to move freely but not so much that the wiring drags the floor of the chamber.
Connect the wiring from the 10-pin nanoconnector to a computer-connected signal acquisition interface unit with synchronized video recording as depicted in Figure 7B.
Set the sampling rates for the recording to be ≥ 2 KHz for ECG and ≥ 500 Hz for EEG (i.e., at least twice the frequency that one is interested in studying).
For optimal viewing of the signal traces, apply the following filters as done previously18: a 60-Hz notch filter for all data, a 75-Hz low- and 0.3-Hz high-pass band filter for EEG, and a 3-Hz high-pass filter for ECG.
Record simultaneous video and EEG-ECG (Figure 7C) and save the digitized data for offline analyses with signal processing software.
Once the recordings are complete, carefully unhook the mouse and return it to its home cage.
9. Analyzing EEG Recordings
- Perform seizure quantification analysis.
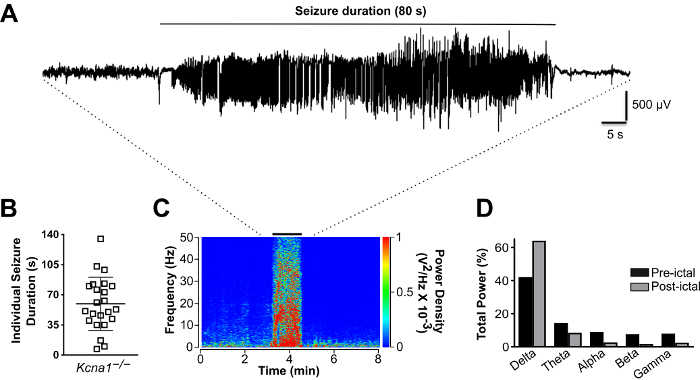
- Visually inspect the entire EEG recording to manually identify seizure episodes, defined in this model as high-amplitude (at least two times the baseline), rhythmic electrographic discharges lasting greater than 5 s (Figure 8A). Examine the video that corresponds to the electrographic seizures to identify seizure-associated behaviors.
- To calculate seizure frequency (seizures/h), divide the number of seizures by the total number of recording hours.
- To calculate seizure duration, measure the elapsed time from the onset of electrographic seizure until the cessation of spiking (Figure 8A).
- To calculate seizure burden, defined as the time spent seizing per hour, sum the seizure durations and divide by the total recording hours.
- Perform spectral power analysis of pre- and post-ictal EEG.
- Select a 30-min (or any other desired time duration) segment of peri-ictal EEG data centered around the seizure episode to be examined. Export the raw data (with filter settings removed) as an ASCII data file or some other file type compatible with power spectrum software.
- Convert the ASCII file to a text file using a simple text editor application.
- Open the resulting text file of the EEG segment in power spectrum software and specify the following settings: "ignore non- numeric lines"; "comma as data delimiter"; and 1000 Hz default sampling rate.
- Once the EEG signal appears in the power spectrum software in its respective channel, click on the channel drop-down menu and select "digital filter." Apply digital band-pass filters corresponding to the desired frequency range to be analyzed.
- Open "Spectrum View" from the menu panel, select the appropriate EEG display channel to be analyzed, and then click "settings." Under "settings," specify the following parameters for the spectrogram and click "Close" to generate the spectrogram (Figure 8C): FFT Size: 8192, Data window: Welch, Window overlap: 93.75%, Display Mode: power density, Spectrogram colors: rainbow, No. of colors: 64, PSD averaging: 1, Remove zero frequency component: checked as "on".
- Adjust the colorimetric scale as needed for optimal visualization of the spectrogram.
- Open "Analysis Manager" from the menu panel. Click on "+ new analysis" to create two analyses (Analysis 1 and Analysis 2), which will correspond to the pre- and post-ictal EEG segments to be analyzed. Specify the desired pre- and post-ictal segments on the spectrogram and associate them with Analysis 1 and Analysis 2, respectively. NOTE: Only EEG data without noise and artifacts should be considered and periods of the EEG recordings with significant artifacts should be removed from the analysis.
- Once the analysis segments are created, open "Data Pad View" from the menu panel. Click on the appropriate EEG channel to open the "Data Pad Column Setup" menu for that channel.
- In "Data Pad Column Setup," select the option for "Spectrum" and then select "Percentage Total Power."
- In the "Data Pad Column Setup," click on "options" and specify the frequency range to be examined. Click "OK" in the "Spectrum Data Pad Options" and in the "Data Pad Column Setup," and the percentage (%) power for the specified frequency band will appear in the Data Pad View for the selected analysis segment (i.e., Analysis 1 or Analysis 2) as specified in the "Analysis Manager." NOTE: The % power, or relative power, of each band is expressed as the percentage of total spectral power within the specified frequency range.
- Repeat the previous step for each frequency band to be analyzed. NOTE: Frequently used ranges for the five main EEG frequency bands include18: δ-band = 0.5-3 Hz, -band = 3.5-7 Hz, α-band = 8-12 Hz, β-band = 13-20 Hz, and γ-band = 21-50 Hz.
10. Analyzing ECG Recordings
- Quantify skipped heart beats.
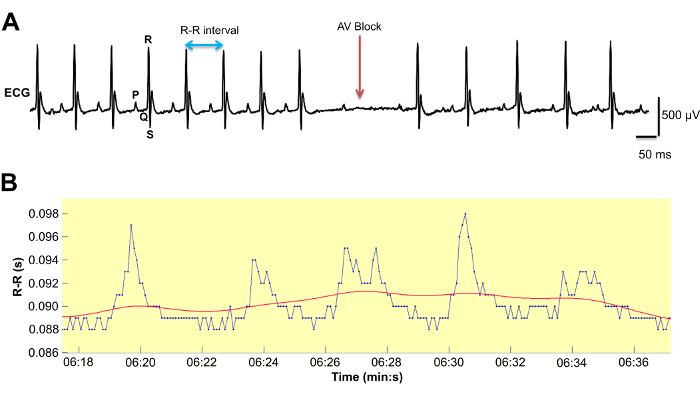
- Visually inspect the entire ECG recording to manually identify skipped heart beats, defined as a prolongation of the RR interval equaling ≥ 1.5 times the previous R-R interval, which is often associated with a non-conducted P-wave indicative of atrioventricular conduction block (Figure 9A).
- To calculate the frequency of skipped heart beats per hour, divide the total number of skipped beats during the recording session by the total duration of recording hours.
- Perform heart rate variability (HRV) analysis.
- In the data acquisition software, change the logging settings to 1 epoch for the ECG channel. Generate parser segments for the ECG recordings: one 5-min ECG segment every 3 hrs during the 12-hour light-phase period, for a total of 4 segments. NOTE: The ECG recordings selected for analysis should be during times when the animal is stationary and the data is free of movement artifacts.
- Generate a spreadsheet of the R-R interval values from the selected parsed ECG segments by clicking "save parsed derived data." Review the spreadsheet for any missing data or bad data and remove all other numerical values except R-R interval data. Save this modified spreadsheet as a text file selecting the option for "tab delimited."
- Open the text file as a custom ASCII file in the HRV software, specifying the following options:Number of header lines: 0, Column Separator: Tab/ Space, Data type: RR, Data Column: 1, Data units: ms, and Time index column: none.
- In the preferences section of the menu, set the options as detailed below.
- Set Analysis options as mentioned. R-R interval detrending, detrending method: smoothn priors,smoothing parameter: 500, HRV frequency bands19,Very low frequency: 0-0.15 Hz, Low frequency: 0.15-1.5 Hz and High frequency: 1.5-5 Hz
- Set Advanced settings as mentioned. Spectrum estimation options, Interpolation of RR series: 20Hz, Points in frequency domain: 500 points/Hz, FFT spectrum using Welchs periodogram methods, Window width: 32s, and Window overlap: 50%
- Run the HRV analysis to generate time domain analysis values for Mean RR, STD RR (i.e., SDNN), RMSSD and frequency domain analysis values for HF power, LF power, and the ratio of LF/HF power. If desired, save the results as a PDF file.
Representative Results
To demonstrate how to analyze the data from EEG-ECG recordings to identify neurocardiac abnormalities, results are shown for a 24-h EEG-ECG recording of a Kcna1-/- mouse (2 months old). These mutant animals, which are engineered to lack voltage-gated Kv1.1 α-subunits encoded by the Kcna1 gene, are a frequently used genetic model of epilepsy since they exhibit reliable and frequent generalized tonic-clonic seizure activity beginning at about 2-3 weeks of age20. In addition to spontaneous seizures, Kcna1-/- mice also exhibit premature death coinciding with the onset of epilepsy, as well as interictal and seizure-associated cardiac dysfunction21,22. Therefore, Kcna1-/- mice are also often used to study the potential pathophysiological processes underlying sudden unexpected death in epilepsy (SUDEP), the leading cause of epilepsy-related mortality, which is believed to involve seizure-related cardiorespiratory arrest by, as of yet, poorly understood mechanisms23.
In this experiment, the EEG component of the recordings from the Kcna1-/- mouse showed frequent spontaneous seizures which are typically observed as an initial large spike at seizure onset followed by brief voltage depression, transitioning into high amplitude spiking and terminating in burst suppression patterns (Figure 8A). Using the simultaneously recorded video, these electrographic seizures were found to coincide with seizure-like behaviors, characterized by rearing and forelimb clonus which subsequently developed into full-body tonic-clonic convulsions. Of note, one of the key advantages of EEG is the ability to identify "silent" electrographic seizures that are not associated with obvious behaviors, meaning they would be missed by an observer scoring seizures based on behavior alone. The quantification of seizure incidence in this particular Kcna1-/- mouse revealed 15 seizures during the 24-h recording period (Figure 8B). The duration of these seizures averaged ~60 s, ranging from about 15-105 s (Figure 8B). To demonstrate relative spectral power density analysis of the pre- and post-ictal period, a seizure of 80-s duration was selected for evaluation using the power spectrum software and a peri-ictal spectrogram generated (Figure 8C). The post-ictal relative spectral power of the delta frequency band was increased by ~50% compared to the pre-ictal baseline (Figure 8D). In addition, the post-ictal relative power of the other higher frequency EEG bands exhibited corresponding decreases compared to the pre-ictal period (Figure 8D). The increase in post-ictal delta power and the decreases in post-ictal power of the other bands are indicative of EEG slowing, a characteristic of long, severe seizures in this model18.
Analyzing the ECG component of the recording from the Kcna1-/- mouse, the number of interictal skipped heart beats was manually counted as described above. The frequency of skipped heart beats in this Kcna1-/- mouse was 5.84/h (Table 1), which is a >5-fold increase compared to WT mice in our previous studies18,21. In the ECG of Kcna1-/- mice, skipped heart beats often exhibit a P wave that is not followed by a QRS complex, as shown in Figure 9A, indicating an atrioventricular (AV) conduction block21. Next, using the HRV software, HRV was analyzed to provide a measure of the influence of the autonomic nervous system on cardiac function in this animal. The following time domain measures of HRV were calculated for the Kcna1-/- mouse: the standard deviation of the beat-to-beat intervals (SDNN), which is an index of total autonomic variability; and the root mean square of successive beat-to-beat differences (RMSSD), which is an index of parasympathetic tone.24 Using the signal acquisition software-generated R-R interval values for the Kcna1-/- mouse (Figure 9B), the HRV software calculated a heart rate of 737 beats/min (Table 1), which is similar to WT mice in our previous studies18. The SDNN and RMSSD values were calculated to be 2.4 ms and 3.2 ms, respectively (Table 1), which are about 2- to 3-fold higher than a normal WT mouse18. The elevated time domain HRV measures in this Kcna1-/- mouse indicate increased parasympathetic tone, suggesting abnormal autonomic control of the heart. Next, we used HRV software to calculate the following values of HRV in the frequency domain, which are summarized in Table 1: the low frequency power percentage (LF); the high frequency power percentage (HF); and the LF/HF ratio. The HF components are thought to reflect parasympathetic modulation, whereas the LF components are thought to reflect a combination of sympathetic and parasympathetic influences25. The LF/HF ratio is used to capture the relative balance of parasympathetic and sympathetic activity.
Finally, in addition to deriving quantitative measures of neural and cardiac dysfunction, the EEG-ECG recordings can also be analyzed qualitatively for the temporal relationship between EEG and ECG abnormalities to identify potential neurocardiac dysfunction, as done previously21,26. For example, when seizures or interictal epileptiform discharges are identified in the EEG, the corresponding ECG can be inspected for cardiac abnormalities, such as conduction blocks or arrhythmias, that may be evoked by epileptic brain activity. In Kcna1-/- mice, seizures sometimes evoke bradycardia or asystole that can progress to lethality21,22. In another epilepsy model, the Kcnq1 mutant mouse, conduction blocks and asystoles occur concurrently with interictal EEG discharges, suggesting they are a consequence of pathological neurocardiac interplay26. Thus, simultaneous recordings of EEG and ECG provide a more complete picture of the interaction between the brain and the heart, which is especially important in epilepsy since seizures can evoke potentially lethal cardiac dysfunction.
Figure 1. Surgical tools needed for the procedure.(1) surgical blade #15; (2) scalpel handle #3; (3) Adson forceps; (4) Olsen-Hegar needle holder; (5) fine scissors; (6) Dumont #7 forceps; (7) Michel wound clips; (8) Crile-Wood needle holder; (9) micro drill with 0.8-mm bit; (10) electric trimmer. Please click here to view a larger version of this figure.
Figure 2. Preparing the electrode for implantation.(A) Example of a 10-socket female nanoconnector (i.e., electrode). (B) The electrode in the tabletop vise with the wires to be implanted for EEG and ECG folded down. The wire colors are indicated. The remaining wires, which are pointed upwards, will be cut off. The inset shows a magnified view of the wires coming out of the electrode. (C) Marking the blue ECG wire to indicate where to strip off the insulation. (D) Using a scalpel blade to strip off the wire insulation revealing the silver filaments inside. (E) The final configuration of the prepared electrode, showing the trimmed EEG wires and the stripped ECG wires with the mounting tape adhered to the top. The inset shows a magnified view of the mounting tape and the wires coming out of the electrode. Please click here to view a larger version of this figure.
Figure 3. Surgical attachment of the electrode to the skull.(A) Example of a mouse with the sides shaved (indicated by arrows) for ECG wire implantation. (B) Parting of the fur between the eyes and ears to make a path for incision. (C) Using a scalpel to make a scalp incision. (D) The scalp incision. (E) Example of the four marks on the skull used to indicate drill sites. (F) Placement of the electrode on the skull after drilling the burr holes. Please click here to view a larger version of this figure.
Figure 4. Tunneling and implantation of the ECG wires.(A) Example of a polyethylene tube that has been cut to about 6 cm and beveled on one end to facilitate subcutaneous tunneling. (B) Tunneling subcutaneously with the polyethylene tube beginning at the lateral incision site. (C) Feeding the ECG wire from the electrode on the head through the tube. (D) Pulling the wire taut after removing the tube. (E) Applying a suture to the uninsulated exposed portion of the ECG wire to hold it in place on the underlying tissue. (F) Closure of the side incision with a wound clip. Please click here to view a larger version of this figure.
Figure 5. Implanting the EEG wires. (A) Grasping the red EEG wire and feeding it horizontally into the burr hole in the skull, following placement of the black ground wire. (B) The final configuration of the nanoconnector and wires following implantation. (C) Schematic showing placement of the bilateral EEG and ECG wires, as well as reference (REF) and ground (GND) wires. Please click here to view a larger version of this figure.
Figure 6. Closing the head incision. (A) Application of dental cement around the base of the electrode beginning caudally and proceeding rostrally. (B) Example of the dental cement cap surrounding the entire nanoconnector and wires, immediately prior to final closure of the incision. (C) Example of the final sealed incision. Please click here to view a larger version of this figure.
Figure 7. Recording of video EEG-ECG signals. (A) Example of a tethered mouse during a recording. (B) Schematic showing the equipment configuration for the in vivo tethered video-EEG-ECG recording system. The wiring from a 10-pin male nanoconnector, which plugs into the female nanoconnector implanted on the skull, is soldered to 1.5-mm female cables which are connected to a 12-channel isolated bio-potential pod interface. This pod is then linked by a serial link cable to a digital communication module (DCOM), which transfers digitized data to a signal acquisition interface unit (ACQ) that is connected to a desktop computer with data acquisition software. Video is also simultaneously acquired using a network video camera positioned outside of and adjacent to the cage. The camera is linked to the computer via a power over Ethernet smart switch. (C) Representative traces of typical EEG and ECG signal data with the following filters applied: 60-Hz notch, 75-Hz low- and 0.3-Hz high-pass band filters for EEG; and a 3-Hz high-pass filter for ECG. Please click here to view a larger version of this figure.
Figure 8. Analysis of EEG signals.(A) An EEG trace showing a representative spontaneous seizure in a Kcna1-/- mouse. (B) Plot of the time durations of each seizure observed during the 24-h recording session in the Kcna1-/- mouse. The bars correspond to the mean ± standard deviation. (C) Peri-ictal spectrogram showing the frequency and power density before, during, and after the representative seizure. (D) Comparison of the relative power in each EEG frequency band during the pre- and post-ictal periods reveals an increase in relative delta power and decreases in theta, alpha, beta, and gamma power. Please click here to view a larger version of this figure.
Figure 9. Analysis of ECG signals.(A) A sample ECG trace from a Kcna1-/- mouse showing normal sinus rhythm preceding an atrioventricular conduction block, which manifests as a P wave that is not followed by a QRS complex. A P wave, QRS complex, and R-R interval are labeled for reference. (B) A representative plot of an R-R interval series obtained from the ECG recording of the Kcna1-/- mouse showing the fluctuations in the time between beats. The red line shows the low frequency trend components that get removed from the R-R interval series following detrending. Please click here to view a larger version of this figure.
| Skipped heart beats/ h | Heart Rate Variability (HRV) | |||||
| Time Domain | Frequency Domain | |||||
| HR | SDNN | RMSSD | LF | HF | LF/HF ratio | |
| (beats/min) | (ms) | (ms) | (%) | (%) | ||
| 5.84 | 736.8 | 2.4 | 3.2 | 52.27 | 46.38 | 1.127 |
Table 1. Quantification of skipped heart beats, heart rate (HR), and heart rate variability (HRV) in a Kcna1-/-mouse. The following time domain measures of HRV are given: standard deviation of beat-to-beat intervals (SDNN) and the root mean square of successive beat-to-beat differences (RMSSD). In the frequency domain, the following HRV measures are shown: low frequency power percentage (LF %); high frequency power percentage (HF %); and the ratio of low frequency power to high frequency power (LF/HF ratio).
Discussion
To obtain high quality EEG-ECG recordings that are free from artifacts, every precaution should be taken to prevent degradation or loosening of the implanted electrode and wires. As an EEG head implant becomes loose, the wire contacts with the brain will degrade leading to decreased signal amplitudes. Loose implants or poor wire contacts can also cause distortion of the electrical signals, introducing movement artifacts and background noise to the recordings. To prevent potential loosening of the head implant, apply a generous amount of dental cement around the base of the implant when closing the scalp incision to ensure maximal strength and adhesion. Care should also be taken to ensure complete removal of fur from the skull, since fur remnants can cause post-surgical inflammation leading to swelling around the implant and premature implant detachment. Over time, the head implants have the potential to loosen due to the stress associated with repeated plugging and unplugging of the animal. Therefore, if possible, attempt to minimize the number of times the animal is plugged/unplugged by performing single long duration recordings rather than multiple short duration recordings. Another potential source of postsurgical implant damage and subsequent animal injury is physical contact between the implant and the wiretop in the animal's home cage. To eliminate the need for wiretops, food pellets and hydrating gel can be placed on the cage floor. Finally, to maintain the integrity of the ECG leads, handling of the animal should be minimized, especially along the sides of the body where the ECG wires run.
In addition to degradation of the implant or wire contacts, another potential complication of a tethered recording configuration is the possibility of the animal becoming detached (i.e., unplugged or unhooked) during an experiment leading to signal loss. Detachment can be especially troublesome for mice that experience severe convulsive seizures with running and bouncing. To minimize the likelihood of the mouse becoming detached, optimize the amount of slack in the wire tether. The best wire length is usually a balance between providing enough slack for the animal to explore all corners of the cage but not so little that there is unnecessary tension in the wires that could promote detachment. In determining the optimal wire length, ensure that there is not so much slack that the mouse can readily chew on the wire, which can lead to signal loss if the wire is broken. Using electrode nanoconnector implants with at least 10-wires (i.e., 10-pin/socket pairs) is also important for providing extra stability to the tethered connection, as nanoconnectors with less than 10-wires tend to unhook more frequently. To further reduce the likelihood of the animal becoming detached, this protocol can easily be modified by connecting the wires from the mouse's head to a low-torque commutator suspended above the recording chamber. The commutator works by rotating as the mouse moves to relieve the buildup of torsional strain in the wire, thereby preventing the mouse from unplugging.
A major strength of this tethered video-EEG-ECG protocol is the ability to modify the method for additional applications. As described here, only six of the available ten electrode wires are utilized. However, the remaining four wires could also be implanted as an additional four EEG leads to provide better spatial resolution of brain activity. Alternatively, two of the unused wires could be sutured into the muscles of the neck to record the electromyogram (EMG), which provides a measure of muscle activity that in combination with EEG is important for determining sleep/wake status. Another possible modification would be to record the animal in a whole-body plethysmography chamber that is modified to accommodate the wire tether. In plethysmography, small pressure changes associated with inspiration and expiration are converted into respiratory waveforms. Therefore, by incorporating plethysmography, it is technically possible to achieve a simultaneous recording of video, EEG, ECG, EMG, and respiration, which would represent a readout of behavior and brain, heart, muscle, and lung activities. Such comprehensive in vivo physiological recordings are virtually impossible in the telemetry systems of today making the tethered approach described here an especially powerful tool for simultaneous interrogation of multiple biosignals in mice.
Disclosures
The authors have nothing to disclose.
Acknowledgments
This work was supported by Citizens United for Research in Epilepsy (grant number 35489); the National Institutes of Health (grant numbers R01NS100954, R01NS099188); and a Louisiana State University Health Sciences Center Malcolm Feist Postdoctoral Fellowship.
References
- Fisch BJ. Fisch and Spehlmann's EEG Primer. Amsterdam, Netherlands: Elsevier; 1999. [Google Scholar]
- Constant I, Sabourdin N. The EEG signal: a window on the cortical brain activity. Paediatr. Anaesth. 2012;22(6):539–552. doi: 10.1111/j.1460-9592.2012.03883.x. [DOI] [PubMed] [Google Scholar]
- Mendez OE, Brenner RP. Increasing the yield of EEG. J. Clin. Neurophysiol. 2006;23(4):282–293. doi: 10.1097/01.wnp.0000228514.40227.12. [DOI] [PubMed] [Google Scholar]
- Smith SJM. EEG in the diagnosis, classification, and management of patients with epilepsy. J. Neurol. Neurosurg. Psychiatry. 2005;76(Suppl 2):ii2–ii7. doi: 10.1136/jnnp.2005.069245. [DOI] [PMC free article] [PubMed] [Google Scholar]
- Bauer G, Trinka E. Nonconvulsive status epilepticus and coma. Epilepsia. 2010;51(2):177–190. doi: 10.1111/j.1528-1167.2009.02297.x. [DOI] [PubMed] [Google Scholar]
- Hughes JR. Absence seizures: a review of recent reports with new concepts. Epilepsy Behav. 2009;15(4):404–412. doi: 10.1016/j.yebeh.2009.06.007. [DOI] [PubMed] [Google Scholar]
- Mostacci B, Bisulli F, Alvisi L, Licchetta L, Baruzzi A, Tinuper P. Ictal characteristics of psychogenic nonepileptic seizures: what we have learned from video/EEG recordings--a literature review. Epilepsy Behav. 2011;22(2):144–153. doi: 10.1016/j.yebeh.2011.07.003. [DOI] [PubMed] [Google Scholar]
- Smith SJM. EEG in neurological conditions other than epilepsy: when does it help, what does it add? J. Neurol. Neurosurg. Psychiatry. 2005;76(Suppl 2):ii8–ii12. doi: 10.1136/jnnp.2005.068486. [DOI] [PMC free article] [PubMed] [Google Scholar]
- Kennett R. Modern electroencephalography. J. Neurol. 2012;259(4):783–789. doi: 10.1007/s00415-012-6425-6. [DOI] [PubMed] [Google Scholar]
- Thaler MS. The Only EKG Book You'll Ever Need. Lippincott Williams & Wilkins; 2012. [Google Scholar]
- Becker DE. Fundamentals of electrocardiography interpretation. Anesth. Prog. 2006;53(2):53–63. doi: 10.2344/0003-3006(2006)53[53:FOEI]2.0.CO;2. quiz 64. [DOI] [PMC free article] [PubMed] [Google Scholar]
- Luz EJS, Schwartz WR, Cámara-Chávez G, Menotti D. ECG-based heartbeat classification for arrhythmia detection: A survey. Comput. Methods Programs Biomed. 2016;127:144–164. doi: 10.1016/j.cmpb.2015.12.008. [DOI] [PubMed] [Google Scholar]
- Bardai A, et al. Epilepsy is a risk factor for sudden cardiac arrest in the general population. PloS One. 2012;7(8):e42749. doi: 10.1371/journal.pone.0042749. [DOI] [PMC free article] [PubMed] [Google Scholar]
- Lamberts RJ, et al. Increased prevalence of ECG markers for sudden cardiac arrest in refractory epilepsy. J. Neurol. Neurosurg. Psychiatry. 2015;86(3):309–313. doi: 10.1136/jnnp-2014-307772. [DOI] [PMC free article] [PubMed] [Google Scholar]
- Thurman DJ, Hesdorffer DC, French JA. Sudden unexpected death in epilepsy: assessing the public health burden. Epilepsia. 2014;55(10):1479–1485. doi: 10.1111/epi.12666. [DOI] [PubMed] [Google Scholar]
- Zayachkivsky A, Lehmkuhle MJ, Dudek FE. Long-term Continuous EEG Monitoring in Small Rodent Models of Human Disease Using the Epoch Wireless Transmitter System. J. Vis. Exp. 2015. p. e52554. [DOI] [PMC free article] [PubMed]
- Bertram EH. Models of Seizures and Epilepsy. Academic Press; 2017. Monitoring for Seizures in Rodents; pp. 97–109. [Google Scholar]
- Mishra V, et al. Scn2a deletion improves survival and brain-heart dynamics in the Kcna1-null mouse model of sudden unexpected death in epilepsy (SUDEP) Hum. Mol. Genet. 2017;26(11):2091–2103. doi: 10.1093/hmg/ddx104. [DOI] [PMC free article] [PubMed] [Google Scholar]
- Thireau J, Zhang BL, Poisson D, Babuty D. Heart rate variability in mice: a theoretical and practical guide. Exp. Physiol. 2008;93(1):83–94. doi: 10.1113/expphysiol.2007.040733. [DOI] [PubMed] [Google Scholar]
- Smart SL, et al. Deletion of the K(V)1.1 potassium channel causes epilepsy in mice. Neuron. 1998;20(4):809–819. doi: 10.1016/s0896-6273(00)81018-1. [DOI] [PubMed] [Google Scholar]
- Glasscock E, Yoo JW, Chen TT, Klassen TL, Noebels JL. Kv1.1 potassium channel deficiency reveals brain-driven cardiac dysfunction as a candidate mechanism for sudden unexplained death in epilepsy. J. Neurosci. 2010;30(15):5167–5175. doi: 10.1523/JNEUROSCI.5591-09.2010. [DOI] [PMC free article] [PubMed] [Google Scholar]
- Moore BM, Jerry Jou , Tatalovic C, Kaufman M, S E, Kline DD, Kunze DL. The Kv1.1 null mouse, a model of sudden unexpected death in epilepsy (SUDEP) Epilepsia. 2014;55(11):1808–1816. doi: 10.1111/epi.12793. [DOI] [PubMed] [Google Scholar]
- Ryvlin P, et al. Incidence and mechanisms of cardiorespiratory arrests in epilepsy monitoring units (MORTEMUS): a retrospective study. Lancet Neurol. 2013;12(10):966–977. doi: 10.1016/S1474-4422(13)70214-X. [DOI] [PubMed] [Google Scholar]
- Stables CL, Auerbach DS, Whitesall SE, D'Alecy LG, Feldman EL. Differential impact of type-1 and type-2 diabetes on control of heart rate in mice. Auton. Neurosci. 2016;194:17–25. doi: 10.1016/j.autneu.2015.12.006. [DOI] [PMC free article] [PubMed] [Google Scholar]
- Gehrmann J, Hammer PE, Maguire CT, Wakimoto H, Triedman JK, Berul CI. Phenotypic screening for heart rate variability in the mouse. Am. J. Physiol. Heart Circ. Physiol. 2000;279(2):H733–H740. doi: 10.1152/ajpheart.2000.279.2.H733. [DOI] [PubMed] [Google Scholar]
- Goldman AM, Glasscock E, Yoo J, Chen TT, Klassen TL, Noebels JL. Arrhythmia in heart and brain: KCNQ1 mutations link epilepsy and sudden unexplained death. Sci. Transl. Med. 2009;1(2):2ra6. doi: 10.1126/scitranslmed.3000289. [DOI] [PMC free article] [PubMed] [Google Scholar]


