Abstract
The myriad physiological functions of γ-amino butyric acid (GABA) are mediated by the GABA-benzodiazepine receptor complex comprising of the GABAA, GABAB, and GABAC groups. The various GABAA subunits with region-specific distributions in the brain subserve different functional and physiological roles. For example, the sedative and anticonvulsive effects of classical benzodiazepines are attributed to the α1 subunit, and the α2 and α3 subunits mediate the anxiolytic effect. To optimize pharmacotherapies with improved efficacy and devoid of undesirable side effects for the treatment of anxiety disorders, subtype-selective imaging radiotracers are required to assess target engagement at GABA sites and determine the dose–receptor occupancy relationships. The goal of this work was to characterize, in nonhuman primates, the in vivo binding profile of a novel positron emission tomography (PET) radiotracer, [11C]ADO, which has been indicated to have functional selectivity for the GABAA α2/α3 subunits. High specific activity [11C]ADO was administrated to 3 rhesus monkeys, and PET scans of 120-minute duration were performed on the Focus-220 scanner. In the blood, [11C]ADO metabolized at a fairly rapid rate, with ∼36% of the parent tracer remaining at 30 minutes postinjection. Uptake levels of [11C]ADO in the brain were high (peak standardized uptake value of ∼3.0) and consistent with GABAA distribution, with highest activity levels in cortical areas, intermediate levels in cerebellum and thalamus, and lowest uptake in striatal regions and amygdala. Tissue kinetics was fast, with peak uptake in all brain regions within 20 minutes of tracer injection. The one-tissue compartment model provided good fits to regional time–activity curves and reliable measurement of kinetic parameters. The absolute test–retest variability of regional distribution volumes (V T) was low, ranging from 4.5% to 8.7%. Pretreatment with flumazenil (a subtype nonselective ligand, 0.2 mg/kg, intravenous [IV], n = 1), Ro15-4513 (an α5-selective ligand, 0.03 mg/kg, IV, n = 2), and zolpidem (an α1-selective ligand, 1.7 mg/kg, IV, n = 1) led to blockade of [11C]ADO binding by 96.5%, 52.5%, and 76.5%, respectively, indicating the in vivo binding specificity of the radiotracer. Using the nondisplaceable volume of distribution (V ND) determined from the blocking studies, specific binding signals, as measured by values of regional binding potential (BP ND), ranged from 0.6 to 4.4, which are comparable to those of [11C]flumazenil. In conclusion, [11C]ADO was demonstrated to be a specific radiotracer for the GABAA receptors with several favorable properties: high brain uptake, fast tissue kinetics, and high levels of specific binding in nonhuman primates. However, subtype selectivity in vivo is not obvious for the radiotracer, and thus, the search for subtype-selective GABAA radiotracers continues.
Keywords: GABAA receptors, α2 subunit, α3 subunit, benzodiazepine, PET, radioligand, carbon-11
Introduction
γ-Amino butyric acid (GABA) is the predominant inhibitory neurotransmitter in the central nervous system.1 The myriad physiological functions of GABA are mediated by 2 distinct receptor systems, the ionotropic GABAA/C and the metabotropic GABAB receptors, which together represent the largest population of neurotransmitter receptors at inhibitory synapses in the mammalian brain. The GABAA receptors, which are members of the family of ligand-gated chloride-ion channels with a primary binding site as well as multiple allosteric modulatory sites, are the most rigorously characterized because of the variety of chemotypes that elicit a wide range of responses.2 When benzodiazepines (BZs) or other allosteric modulators (eg, barbiturates and neurosteroids) bind to GABAA receptors, conformational changes increase the permeability of the central pore to chloride ions, resulting in a chloride flux that hyperpolarizes the neuron.3 Classical BZs, among the most widely prescribed drugs in modern medicine, are well known for their anxiolytic and anticonvulsant activities and efficacious in the treatment of several illnesses of high socioeconomic burdens, including Alzheimer’s disease, schizophrenia, alcohol dependence, and mood disorders. Nonetheless, they also display some undesirable side effects such as ataxia, sedation, as well as tolerance and dependence upon chronic administration.4,5
There are several subunit isoforms for the GABAA receptors in humans (α1-6, β1-3, γ1-3, δ, ε, Π, θ, and ρ1-3),6 whereas only the pentamers containing α1-, α2-, α3-, or α5-subunit are BZ sensitive. The various subunits with region-specific distributions in the brain are believed to subserve different functional and physiological roles and mediate a variety of pharmacological effects.6-8 For instance, the sedative and anticonvulsive effects (and hence abuse potential) of classical BZs are attributed to the α1 subunit,9 and the α2 and α3 subunits mediate the anxiolytic effect,10 while action at the α5 subunit is thought to be involved in temporal and spatial memory.11 The recently discovered antihyperalgesic effect of BZs is mainly due to interaction with the α2-containing GABAA receptors in the spinal cord.12 Finally, human genetic studies suggest that the α2 subunit may play a role in cannabis abuse, nicotine dependence, as well as the behavioral effects of alcohol consumption.6 For this reason, the pharmacological targeting of a particular subunit, or a combination of subunits, may be an effective approach for the treatment of anxiety disorders, epilepsy, and cognitive impairment with little of the accompanying undesirable side effects.13 In turn, these subtype-selective GABAA receptor modulators, which have been explored as therapeutic agents, constitute new and valuable leads for the development of in vitro and in vivo pharmacological tools to further elucidate the role of GABAA receptor subunits in neuropsychiatric disorders and to assist in the development of optimized pharmacotherapies.
Positron emission tomography (PET) or single-photon emission computed tomography (SPECT) imaging with subtype-selective GABAA receptor radiotracers would provide a noninvasive tool to further interrogate the GABAA receptors and gain insights into the functions of each of their subunits in vivo. Such a radiotracer can also be used as a direct biomarker to assess target engagement at GABA sites and correlate receptor occupancy, dose exposure, and therapeutic response, thus aiding the development of novel therapeutic agents with optimal-benefit side-effect profiles. The most commonly used PET and SPECT radiotracers for imaging GABAA in vivo include [11C]flumazenil ([11C]Ro15-1788), [123I]iomazenil ([123I]Ro16-0154), and [11C]Ro15-4513 (Figure 1). Both [11C]flumazenil, a GABAA-BZ antagonist, and [123I]iomazenil, an antagonist and/or a partial agonist, are nonselective allosteric modulators that bind with high affinity to GABAA receptors containing the α1, α2, α3, and α5 subunits (K i ∼ 1 nM) and less so to those containing the α4 and α6 subunit (K i ∼ 150 nM).14 Consistent with the high abundance of α1-containing receptors found in the rat brain, particularly in the cortex,7,8 [11C]flumazenil binding in vivo primarily reflects this subpopulation in human.15 [123I]iomazenil is very similar to [11C]flumazenil in its binding profile. [11C]Ro15-4513, a negative allosteric modulator, is a partial inverse agonist at the GABAA-BZ site with a regional distribution profile different from that of [11C]flumazenil, as it targets preferentially the α5-containing subunit.16,17 The extensive effort put forth to develop and validate radiotracers for imaging the BZ site of GABAA receptor has led to several other PET radiotracers for this target (see the study by Katsifis et al13 and Grunder et al18 and references therein), including [18F]fluoro-ethylflumazenil,18 [11C]flunitrazepam,19 and [11C]fludiazepam.20 However, none of these radiotracers have proved to offer advantages over [11C]flumazenil or [123I]iomazenil for imaging GABAA receptors in vivo.
Figure 1.
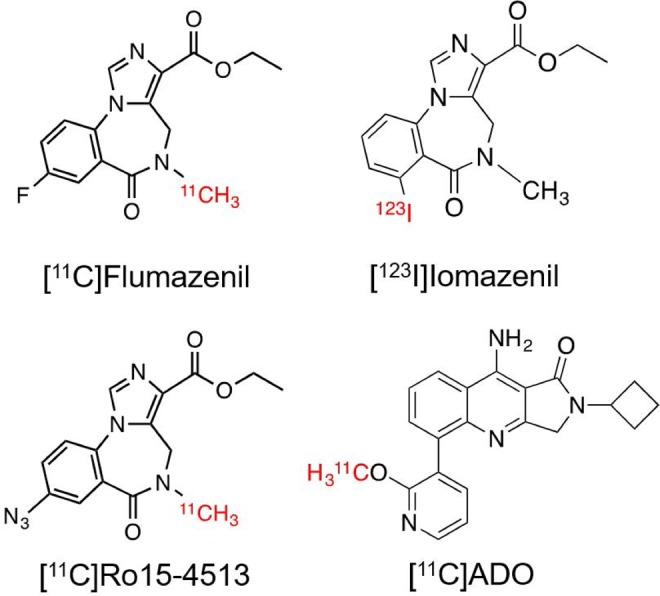
Radiotracers for GABAA receptors. GABAA indicates γ-amino butyric acid.
The quinolone compound ADO (9-amino-2-cyclobutyl-5-(2-methoxypyridin-3-yl)-2,3-dihydro-1H-pyrrolo[3,4-b]quinolin-1-one), described in previous publications (compound #45),21,22 has been proposed to have functional selectivity for the α2/α3 subunits of GABAA receptors with pK i of 8.62. In addition, [11C]ADO (Figure 1) was successfully labeled at the methoxy position and confirmed by ex vivo biodistribution study in rodents to have potential as a GABAA subtype-selective imaging agent. In this study, we translated [11C]ADO to higher species for in vivo characterization of its binding profile in nonhuman primates. To comprehensively assess its binding specificity and subtype selectivity in vivo, we conducted blocking experiments with preadministration of the nonsubtype selective flumazenil, the α5-prefering Ro15-4513, and the α1-selective ligand zolpidem.
Materials and Methods
Radiochemistry
[11C]ADO was prepared by modification of our previously reported method.23 Briefly, O-alkylation of the 2-pyridinol precursor was achieved by reaction with [11C]CH3I in the Bioscan AutoLoop synthesis module (Miami, FL) as shown in Figure 2. [11C]Methyl iodide was swept with helium at a flow rate of 18 mL/min through a stainless steel loop preloaded with a solution of the 2-pyridinol precursor (1 mg) and cesium carbonate (115 mM) in dimethyl sulfoxide. After the radioactivity peaked in the loop, the reaction mixture was allowed to stand at ambient temperature for 5 minutes and then purified by semipreparative high-performance liquid chromatography (HPLC) (Column: Phenomenex Luna C-18(2), 5 µm, 9.4 mm × 250 mm (Torrance, CA); mobile phase: 55% acetonitrile/45% 10 mM NH4HCO3 [vol/vol, pH ∼8]; flow rate: 3 mL/min, ultraviolet [UV] detector λ = 254 nm). The product fraction (retention time of ∼11 minutes) was collected, diluted with deionized water (50 mL), and passed through a Waters Classic C18 SepPak cartridge (Milford, MA). The cartridge was rinsed with 0.001 N HCl (10 mL) and dried. The trapped product was eluted off the SepPak with 1 mL of absolute ethanol (US Pharmacopeial Convention, USP grade, Rockville, MD), followed by 3 mL of USP saline, into a product vial containing 7 mL of USP saline and 40 µL of 4.2% USP NaHCO3 solution. The combined mixture was then passed through a sterile membrane filter (0.22 µm, Millipore, Billerica, MA) for terminal sterilization and collected in an empty sterile vial to afford a formulated solution ready for dispensing and administration. For quality control, radiochemical purity, specific activity, and identity of the final product were determined by analytical HPLC (Column: Phenomenex Prodigy C18 ODS3, 5 µm, 4.6 mm × 250 mm; mobile phase: 45% acetonitrile/55% 10 mM ammonium bicarbonate [vol/vol]; flow rate: 1.5 mL/min; UV detector λ = 254 nm).
Figure 2.
Radiosynthesis of [11C]ADO.
Positron Emission Tomography Imaging in Nonhuman Primates
Three rhesus macaques (Macaca mulatta) were used in this study. These animals were as follows: monkey 1 (M1), female, 7 years, 7 kg; monkey 2 (M2), male, 7 years, 19 kg; and monkey 3 (M3), male, 16 years, 15 kg. All procedures followed institutional guidelines and were approved by the Yale University Institutional Animal Care and Use Committee. Procedures for animal handling and preparation were the same as described previously.24
Dynamic PET scans with [11C]ADO were performed on the Focus-220 scanner for a duration of 120 minutes each. Procedures for data acquisition were the same as described previously.24 Baseline scans were acquired for all 3 animals for a total of 6 scans (3, 2, and 1 baseline scan in M1, M2, and M3, respectively). Binding specificity and subtype selectivity of the radiotracer were assessed in 4 additional blocking scans with [11C]ADO in 3 animals, following administration of 0.66 nmol/kg (0.2 mg/kg) of flumazenil in M1, or 0.09 nmol/kg (0.03 mg/kg) of Ro15-4513 in M2 and M3, or 5.53 nmol/kg (1.7 mg/kg) of zolpidem in M2 as a 5- to 10-minute slow bolus starting 8 to 15 minutes before radiotracer administration.
Arterial Input Function Determination
Twenty-one arterial blood samples were drawn at various time points after radiotracer administration, processed, and counted for arterial input function measurement. Selected blood samples drawn at 3, 8, 15, 30, 60, and 90 minutes after radiotracer injection were processed and analyzed to determine the radio-metabolite profile using a column-switching HPLC procedure described previously by us.24 The unchanged parent fraction was determined as the ratio of the radioactivity corresponding to the parent to the total amount of radioactivity collected. The time course of the parent fraction was first fitted with a bounded sum of exponential function and then corrected with the normalized filtrate recovery (1 − C filter/C plasma, fitted with an exponential rise to plateau function). The arterial input function was estimated as the product of the radioactivity concentration and the fitted parent fraction in arterial plasma. Additionally, the free fraction (f P) in plasma was measured with Millipore ultrafiltration devices (Centifree 4104) in triplicate for each scan.
Image Processing and Data Analysis
List-mode PET data were processed as previously described.24 Reconstructed PET images were registered to each subject’s magnetic resonance image using a rigid body registration algorithm.25 Binary template masks identifying the amygdala, caudate, cerebellum, cingulate cortex, frontal cortex, hippocampus, occipital cortex, pons, putamen, temporal cortex, and thalamus were used to extract time–activity curves (TACs) from these regions.
For all scans, the primary outcome measure was total distribution volume (V T).26 Free-fraction corrected total distribution volumes (V T/f P) were also determined. These values were calculated in all regions with the 1-tissue compartment (1TC) and 2-tissue compartment (2TC) models.27 To compare model suitability, an Akaike information criterion (AIC)24 value was calculated for each model fit in every region. Values within each region were compared across models, and the lowest AIC value indicated a preferred model fit.
The test–retest reproducibility of the primary outcome measure, V T, was evaluated in each region for M1 and M2 with repeated PET scans done on the same day (M1) or different days (M1: 20 days apart; M2: 35 days apart). Test–retest variability (TRV) was calculated as the difference in values between the 2 scans divided by the average of the values from both scans or %TRV = [(V T Test − V T Retest)/(V T Test + V T Retest)/2] × 100.
Graphical method derived from the equation for V T estimates for both baseline and blocking scans was used for the analysis of receptor occupancy assuming uniform occupancy in all regions,28 as follows:
From this linear relationship, the nondisplaceable distribution volume, V ND, can be calculated as the y intercept divided by the slope, which equals the fractional target occupancy postblocking. The nondisplaceable binding potential, BP ND, can be derived from the equation: BP ND = V T/V ND − 1. Finally, the receptor occupancy in different regions can be calculated: Occupancy = 1 − BP ND Blocking/BP ND Baseline.
Results
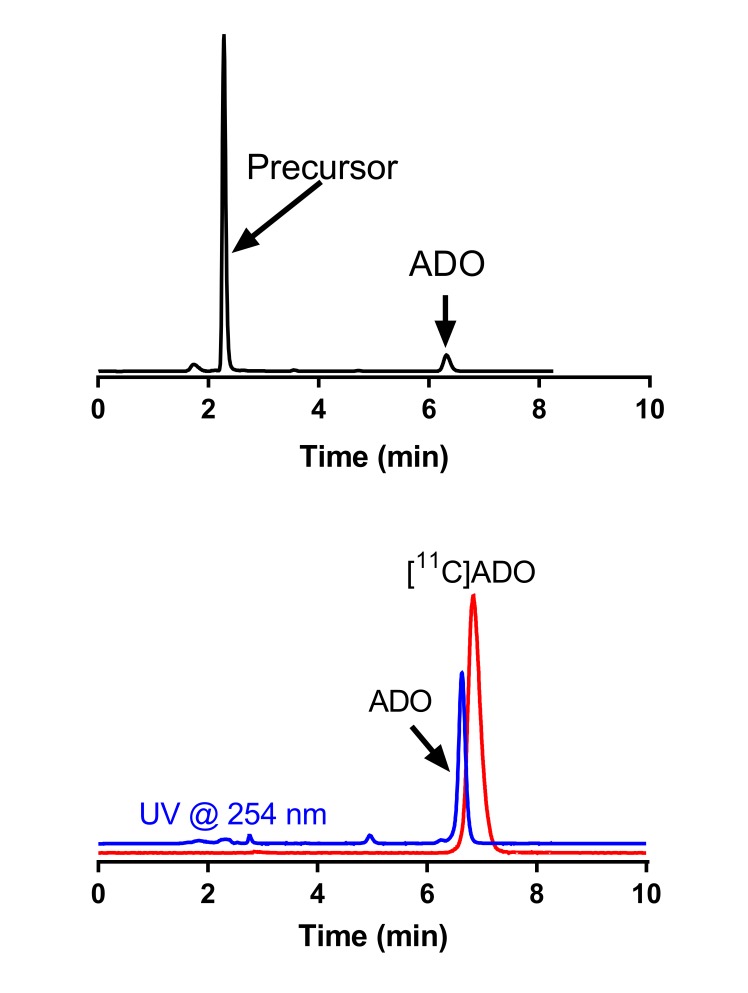
[11C]ADO was prepared in 3.52% ± 1.04% radiochemical yield, with radiochemical purity of 99.3% ± 0.5% and specific activity of 911.3% ± 294.8 MBq/nmol at the end of synthesis (n = 9), which is higher than that from previous publication23 and can be attributed to the high specific activity of [11C]CH3I produced through gas-phase reaction and used herein. Example HPLC chromatograms from quality control analysis of the final [11C]ADO product solution are shown in Supplemental Figure A.
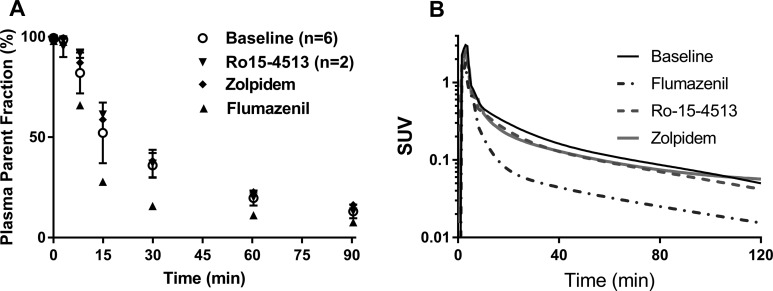
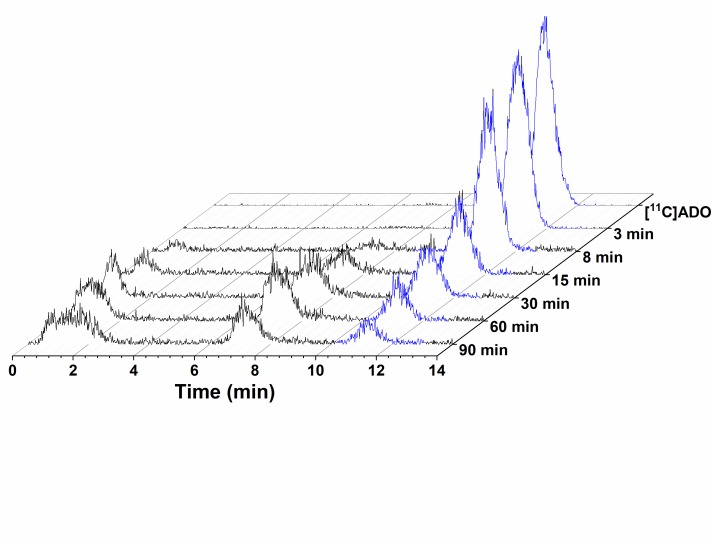
[11C]ADO was metabolized at a fairly rapid rate in all 3 monkeys (Figure 3A). In the baseline scans, [11C]ADO parent fraction constituted 36% ± 6% of total plasma radioactivity at 30 minutes postinjection, which was further decreased to 13% ± 3% (n = 5, baseline scans) at 90 minutes postinjection (see Supplemental Figure B for representative HPLC chromatograms from plasma metabolite analysis). The parent [11C]ADO curve peaked at 3 minutes with standardized uptake value (SUV) of 2.4 ± 0.8 and decreased to SUV of 0.05 ± 0.02 at 90 minutes postinjection in the baseline scans. Pretreatment with flumazenil appeared to accelerate the clearance of [11C]ADO, with much lower plasma radioactivity corresponding to the parent (e.g., from 32.8% to 15.7% at 30 minutes postinjection), whereas pretreatment with either Ro15-4513 or zolpidem exerted limited effect on [11C]ADO metabolism (Figure 3B). The free fraction (f P) of [11C]ADO in plasma was 15.8% ± 3.4% (n = 10).
Figure 3.
Percentage of parent fraction in plasma over time for [11C]ADO during baseline and blocking scans (A) and representative metabolite-corrected plasma time–activity curves (B). Plasma curves are displayed in SUV units (concentration/[injected dose/body weight]). SUV indicates standardized uptake value.
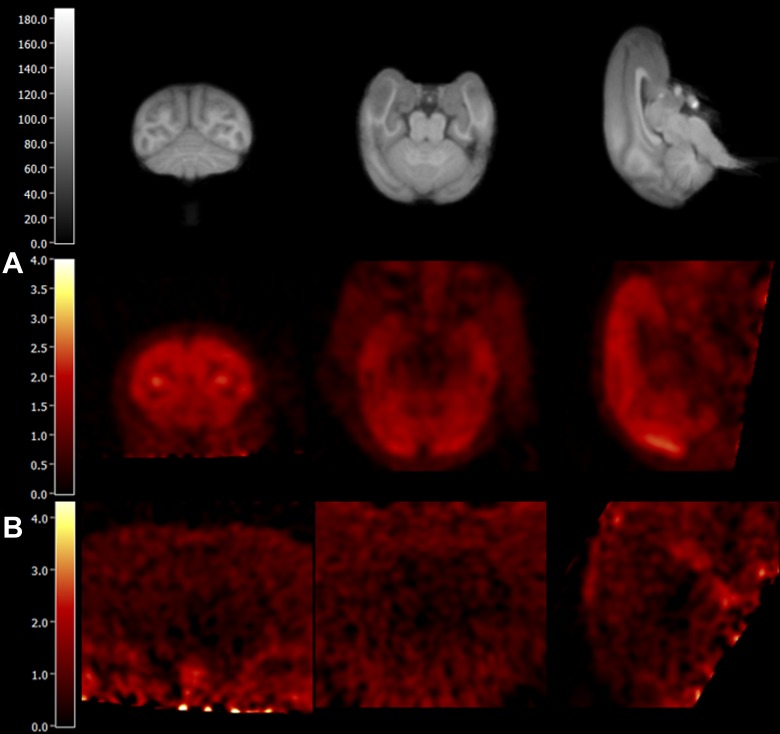
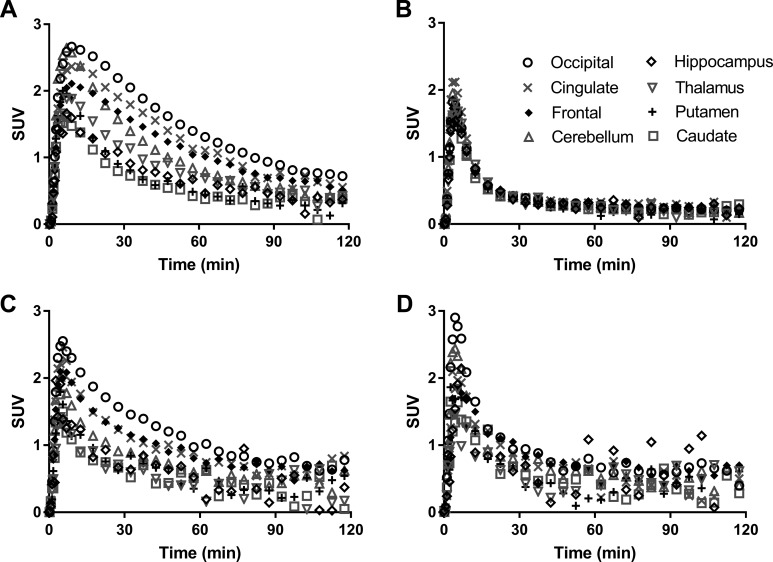
Representative PET images and regional TACs from baseline and blocking scans are depicted in Figures 4 and 5, respectively. In the baseline scan, radioactivity concentrations peaked at 10 to 30 minutes postinjection in the monkey brain regions, with SUV of ∼3.0 (Figures 4A and 5A), and decreased thereafter. The highest uptake was detected in cortical areas, intermediate levels in cerebellum and thalamus, and lowest uptake in striatal regions, pons and amygdala (Figure 5A). Flumazenil at the dose of 0.2 mg/kg provided nearly complete blockade of [11C]ADO binding (Figures 4B and 5B), while significant blockade of [11C]ADO binding was also seen with 0.03 mg/kg of Ro15-4513 and 1.7 mg/kg of zolpidem (Figure 5C and D).
Figure 4.
PET SUV images summed from 30 to 45 minutes postinjection of [11C]ADO from a baseline scan (A) and a blocking scan with 0.2 mg/kg flumazenil (B) in monkey M1. Coronal (left), transverse (middle), and sagittal (right) views are shown, along with co-registered MR images (top). MR indicates magnetic resonance; PET, positron emission tomography; SUV, standardized uptake value.
Figure 5.
Regional time–activity curves of [11C]ADO in selected monkey brain regions from a representative baseline scan (A) and blocking scans with 0.2 mg/kg of flumazenil (B), 0.03 mg/kg of Ro15-4513 (C), and 1.7 mg/kg of zolpidem (D). Radioactivity concentrations are expressed as SUV. SUV indicates standardized uptake value.
The 1TC provided good fits for [11C]ADO regional TACs and reliable measures of kinetic parameters. Values of AIC for 1TC were lower than those from 2TC, and kinetic modeling of the data with 2TC did not converge to reliable V T estimates in several regions. One-tissue compartment–derived V T values ranged from 3.7 ± 1.0 in pons to 11.2 ± 2.6 mL/cm3 in occipital cortex, while K 1 values ranged from 0.28 ± 0.08 mL/cm3·min in hippocampus to 0.43 ± 0.16 mL/cm3·min in cerebellum. Highest V T values were found in cortical regions, intermediate values in cerebellum and thalamus, and lowest values in pons, hippocampus, brainstem, and striatum (caudate and putamen) as shown in Table 1 and consistent with the uptake pattern seen in the TACs (Figure 5A). Given the seemingly higher regional V T values detected from M1 plus a statistically significant difference in plasma f P among the monkeys (P = .02, 1-way analysis of variance), regional V T values normalized by f P were also calculated. Regional V T/f P values (P = .58) were much more similar among the 3 monkeys (Table 2), suggesting that correction for f P is important, as has been shown previously.29
Table 1.
Regional V T Values From Baseline Scans on Monkeys M1, M2, and M3 and Blocking Studies With 0.2 mg/kg of Flumazenil (M1), 0.03 mg/kg of Ro15-4513 (M2 and M3), and 1.7 mg/kg of Zolpidem (M2), Respectively.
| Scan condition | Brainstem | Cerebellum | Cingulate Cortex | Frontal Cortex | Hippocampus | Insula Cortex | Occipital Cortex | Pons | Striatuma | Temporal Cortex | Thalamus |
|---|---|---|---|---|---|---|---|---|---|---|---|
| Baseline | |||||||||||
| M1 (n = 3)b | 4.2 (0.3) | 8.6 (0.6) | 11.3 (0.7) | 10.2 (0.5) | 5.9 (0.3) | 9.3 (0.4) | 13.3 (0.6) | 4.3 (0.3) | 5.1 (0.2) | 9.8 (0.4) | 7.1 (0.4) |
| M2 (n = 2)b | 3.7 (0.5) | 6.1 (0.5) | 7.3 (0.0) | 7.5 (0.1) | 4.4 (0.6) | 7.0 (0.3) | 10.1 (0.6) | 3.7 (0.0) | 3.3 (0.1) | 7.1 (0.2) | 3.8 (0.2) |
| M3 (n = 1) | 1.7 | 3.7 | 5.3 | 5.2 | 2.9 | 4.7 | 7.3 | 1.8 | 2.1 | 5.3 | 2.8 |
| Blocking | |||||||||||
| Flumazenil-M1 | 3.0 | 2.9 | 3.4 | 3.0 | 3.0 | 2.9 | 3.1 | 3.0 | 2.8 | 2.9 | 3.1 |
| Ro15-4513-M2 | 2.8 | 3.7 | 4.5 | 4.8 | 3.2 | 4.0 | 5.7 | 3.0 | 2.6 | 4.2 | 2.4 |
| Ro15-4513-M3 | 1.6 | 2.4 | 3.2 | 3.0 | 2.0 | 2.9 | 4.1 | 1.4 | 1.8 | 3.1 | 1.7 |
| Zolpidem-M2 | 2.3 | 2.9 | 3.3 | 3.7 | 2.2 | 3.0 | 3.7 | 2.3 | 2.4 | 2.5 | 2.1 |
aThe averaged values of caudate and putamen.
bMean (SD).
Table 2.
Regional V T/f P Values From Baseline Scans on Monkeys M1, M2, and M3 and Blocking Studies With 0.2 mg/kg of Flumazenil (M1), 0.03 mg/kg of Ro15-4513 (M2 and M3), and 1.7 mg/kg of Zolpidem (M2), Respectively.
| Scan condition | Brainstem | Cerebellum | Cingulate Cortex | Frontal Cortex | Hippocampus | Insula Cortex | Occipital Cortex | Pons | Striatuma | Temporal Cortex | Thalamus |
|---|---|---|---|---|---|---|---|---|---|---|---|
| Baseline | |||||||||||
| M1 (n = 3)b | 22.8 (4.2) | 46.6 (9.1) | 60.6 (8.8) | 54.8 (9.2) | 31.7 (5.3) | 50.0 (8.4) | 71.8 (11.5) | 23.3 (3.7) | 27.3 (4.4) | 53.1 (9.0) | 38.0 (5.1) |
| M2 (n = 2)b | 25.4 (6.0) | 42.2 (7.8) | 50.1 (4.8) | 51.7 (5.8) | 30.3 (7.2) | 48.2 (6.7) | 69.6 (10.8) | 25.2 (2.8) | 22.6 (3.1) | 48.6 (6.1) | 26.2 (4.1) |
| M3 (n = 1) | 16.5 | 36.3 | 52.0 | 50.8 | 28.1 | 45.6 | 70.9 | 17.6 | 20.3 | 51.6 | 27.7 |
| Blocking | |||||||||||
| Flumazenil-M1 | 17.2 | 16.8 | 19.4 | 17.5 | 17.6 | 16.8 | 18.1 | 17.1 | 16.3 | 16.9 | 18.0 |
| Ro15-4513-M2 | 16.7 | 22.0 | 26.7 | 28.4 | 19.0 | 23.7 | 33.6 | 18.0 | 15.1 | 24.8 | 14.2 |
| Ro15-4513-M3 | 12.4 | 19.2 | 25.6 | 26.4 | 15.9 | 23.2 | 33.1 | 11.1 | 14.6 | 24.7 | 13.5 |
| Zolpidem-M2 | 14.7 | 18.7 | 21.3 | 23.8 | 14.4 | 19.4 | 24.1 | 14.8 | 15.3 | 16.4 | 13.5 |
aThe averaged values of caudate and putamen.
bMean (SD).
Of the 3 monkeys, 3 baseline scans with [11C]ADO were performed on M1, with 2 on the same day (4 hours apart) and the third scan 20 days later, and 2 baseline scans with [11C]ADO were acquired on M2, 35 days apart. Both M1 and M2 appeared to have slightly lower V T estimates for their first scans as TRVs for most regions of interest were negative. The absolute TRVs for M1 were 4.5% ± 3.7% between scan 1 and scan 2, acquired on the same day, 8.0% ± 3.3% between scan 1 and scan 3, and 6.2% ± 4.0% between scan 2 and scan 3, respectively. Similar V T variation (absolute TRV = 8.7% ± 6.6%) was also obtained between the 2 baseline [11C]ADO scans for M2.
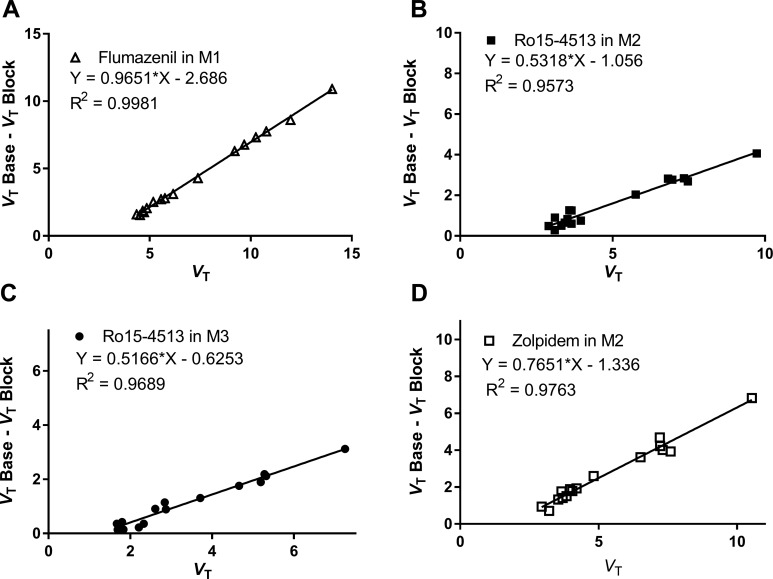
Blocking effects on [11C]ADO were investigated with subtype nonselective flumazenil to determine in vivo binding specificity, and with α5-selective Ro15-4513 and α1-selective zolpidem to assess subtype selectivity of the radiotracer. Occupancy plots are shown in Figure 6. Pretreatment with flumazenil (0.2 mg/kg, intravenous [IV], in M1) led to nearly complete blockade of [11C]ADO-specific binding (occupancy of 96.5%, Figure 6A), indicating the in vivo binding specificity of the radiotracer for GAGAA.
Figure 6.
Occupancy plots using 1TC V T values from the baseline and corresponding blocking scans with 0.2 mg/kg of flumazenil (A) in M1, 0.03 mg/kg of Ro15-4513 (B and C in M2 and M3, respectively), and 1.7 mg/kg of zolpidem (D) in M2. 1TC indicates the one-tissue compartment model.
Maeda et al., have used the α5-selective Ro15-4513 and the α1-selective zolpidem as blocking agents to dissect the in vivo binding profile of [11C]Ro-15-4513.17 From these studies, the effective doses of Ro15-4513 to block 50% of [11C]Ro-15-4513 binding (ED 50) in the cingulate cortex and occipital cortex were calculated as 2.1 and 28.0 μg/kg (IV), respectively (Jun Maeda, personal communication), whereas the ED 50 values of zolpidem was determined to be 0.9 and 1.7 mg/kg (IV), respectively, for the cerebellum and occipital cortex.17 We used the higher doses of Ro15-4513 and zolpidem in our blocking studies of [11C]ADO. Pretreatment of 2 separate monkeys (M2 and M3) with 0.03 mg/kg of Ro15-4513 (IV) led to 53% and 52% blockade of [11C]ADO binding (Figure 6B and C). With a pretreatment dose of 1.7 mg/kg zolpidem (IV, in M2), 76.5% of overall occupancy was seen (Figure 6D). From these occupancy plots using the 1TC V T values derived from the baseline and corresponding blocking scans (Figure 6), [11C]ADO nonspecific volume of distribution (V ND) was calculated at 2.77 mL/cm3 (M1, flumazenil blocking), 1.98 mL/cm3 (M2, Ro15-4513 blocking), 1.21 mL/cm3 (M3, Ro15-4513 blocking), and 1.75 mL/cm3 (M2, zolpidem blocking), respectively. Under the assumption that the V ND is the same across regions, binding potential (BP ND) values were determined using V ND value from the individual blocking scans in monkeys and are listed in Table 3.
Table 3.
Regional BP ND Values From Baseline Scans on Monkeys M1, M2, and M3, Respectively, and From Blocking Studies With 0.2 mg/kg of Flumazenil (M1), 0.03 mg/kg of Ro15-4513 (M2 and M3), and 1.7 mg/kg of Zolpidem (M2), Respectively.
| Scan condition | Brainstem | Cerebellum | Cingulate cortex | Frontal cortex | Hippocampus | Insula cortex | Occipital cortex | Pons | Striatuma | Temporal cortex | Thalamus |
|---|---|---|---|---|---|---|---|---|---|---|---|
| Baseline | |||||||||||
| M1 (n = 3)b | 0.5 (0.1) | 2.1 (0.2) | 3.1 (0.2) | 2.7 (0.2) | 1.1 (0.1) | 2.3 (0.1) | 3.8 (0.2) | 0.6 (0.1) | 0.8 (0.1) | 2.6 (0.1) | 1.6 (0.2) |
| M2 (n = 2)b | 1.0 (0.1) | 2.3 (0.2) | 2.9 (0.2) | 3.1 (0.2) | 1.4 (0.1) | 2.8 (0.1) | 4.5 (0.2) | 1.0 (0.1) | 0.8 (0.1) | 2.8 (0.1) | 1.1 (0.2) |
| M3 (n = 1) | 0.4 | 2.1 | 3.4 | 3.3 | 1.4 | 2.9 | 5.0 | 0.5 | 0.7 | 3.4 | 1.3 |
| Averagec | 0.6 (0.3) | 2.2 (0.1) | 3.1 (0.2) | 3.0 (0.3) | 1.3 (0.1) | 2.7 (0.3) | 4.4 (0.6) | 0.7 (0.3) | 0.8 (0.1) | 2.9 (0.4) | 1.3 (0.2) |
| Blocking | |||||||||||
| Flumazenil-M1 | 0.1 | 0.0 | 0.2 | 0.1 | 0.1 | 0.1 | 0.1 | 0.1 | 0.0 | 0.1 | 0.1 |
| Ro15-4513-M2 | 0.3 | 1.0 | 1.6 | 1.7 | 0.6 | 1.4 | 2.4 | 0.1 | 0.5 | 1.6 | 0.4 |
| Ro15-4513-M3 | 0.4 | 0.9 | 1.3 | 1.4 | 0.6 | 1.0 | 1.9 | 0.5 | 0.3 | 1.1 | 0.2 |
| Zolpidem-M2 | 0.3 | 0.7 | 0.9 | 1.1 | 0.3 | 0.7 | 1.1 | 0.3 | 0.3 | 0.4 | 0.2 |
aThe averaged values of caudate and putamen.
bMean (SD).
cMean (SD) from the baseline scans of 3 monkeys.
Discussion
This work was conducted to assess the in vivo kinetic properties of the GABAA radiotracer [11C]ADO in nonhuman primates and its subtype selectivity. ADO had been proposed to possess subtype-selective activity of α2/3 neutral antagonism and α2/3 agonism in functional assays in vitro.21 If subtype-selective binding was demonstrated in vivo, [11C]ADO would provide a tool for screening α2/3-selective therapeutic agents with anxiolytic activity but no undesirable sedative effect.
The radiosynthesis of [11C]ADO was straightforward. Using [11C]methyl iodide for O-methylation of the 2-pyridinol precursor in a loop method, the final product was produced in high radiochemical purity and high specific activity.
In monkeys, [11C]ADO metabolized at a relatively fast rate, generating radioactive metabolites that were more polar than the parent radiotracer based on their shorter retention times on the reverse-phase HPLC chromatogram. In the brain, [11C]ADO displayed fast kinetics, with radioactivity concentrations across the brain peaked within 10 minutes of radiotracer administration and decreased rapidly thereafter. Differential uptake was seen in brain regions, with highest activity levels in cortical regions, intermediate levels in cerebellum, thalamus, hippocampus, and low uptake in brain stem and pons.
The 1TC model provides good fitting of brain regional TACs and reliable estimates of regional V T based on 120 minutes of data acquisition. Highest V T values were found in cortical regions and cerebellum, intermediate values in hippocampus, thalamus and striatum, and lowest values in pons and brainstem (Table 1). The absolute TRVs of V T were low, ranging from 4.5% to 8.7% between repeat scans on the same day, or in different days, indicating good test–retest reproducibility of kinetic parameters in monkeys.
Regional V T values of [11C]ADO displayed individual differences between animals, as did the free fraction of radiotracer in plasma (f P). Appropriately, when corrected by f P from the individual scan, regional V T/f P values were very similar among the 3 monkeys (Table 3, P = .58). This is reasonable since V T is the equilibrium ratio of tissue to plasma, and higher free fractions in plasma will lead to higher tissue uptake.
Pretreatment with subtype nonselective flumazenil (0.2 mg/kg, targeting α1, α2, α3, and α5 subunits) reduced V T in all brain regions, including the pons, to a mostly uniform value and resulted in a nearly complete blockade of [11C]ADO-specific binding (96.5% occupancy, Table 1 and Figure 6A). Value of V T in the pons was reduced by ∼30%, indicating that the pons is not a suitable reference region for [11C]ADO.
In comparison to the reported [11C]flumazenil BP ND values computed with the pons as the reference region in monkeys,30 our estimated BP ND values for [11C]ADO derived from individually measured V ND values were very similar across brain regions (see Table 4 for the comparison). However, unlike [11C]flumazenil, the pons may not be suitable to serve as a reference region for [11C]ADO, as some specific uptake was observed therein.
Table 4.
Regional BP ND Valuesa for [11C]ADO (n = 3) and [11C]Flumazenil (n = 4)b in the Monkey Brain.
| Radiotracer | Cerebellum | Cingulate Cortex | Frontal Cortex | Insula Cortex | Occipital Cortex | Temporal Cortex | Thalamus |
|---|---|---|---|---|---|---|---|
| [11C]ADO | 2.17 (0.13) | 3.14 (0.23) | 3.01 (0.31) | 2.66 (0.27) | 4.42 (0.59) | 2.91 (0.41) | 1.32 (0.25) |
| [11C]flumazenil | 1.78 (0.33) | 3.19 (0.46) | 3.29 (0.49) | 3.08 (0.39) | 3.88 (0.30) | 2.81 (0.33) | 1.39 (0.11) |
aValues are mean (SD).
bData are taken from Sandiego et al.30
The different subunits of GABAA receptors are localized, to certain degree, not only in discrete brain regions but also with some overlaps. The α1 subunit is the most abundant and concentrated particularly in the cortex. The α4 subunit is rich in the thalamus, with the α5 subunit predominant in the hippocampus and the α6 subunit exclusively found in the cerebellum. For the α2 subunit, it is preferentially distributed in the hippocampus, forebrain areas, and the cerebellum, whereas the α3 subunit is localized in the olfactory bulb, cortex, thalamic nucleus, superior colliculus, and the amygdala.7,8 Dissecting the subtype selectivity of GABAA radiotracers in vivo is not easy, because of a lack of truly subtype-selective compounds and overlaps in subunit distribution in brain regions. We used Ro15-4513 and zolpidem in additional blocking studies to assess the subtype selectivity of [11C]ADO. Ro15-4513 has been reported to have 10 to 20 times higher affinity for the α5 than α1, α2, or α3 subunit, whereas zolpidem was found to have 10 times higher affinity for the α1 than α2 or α3 subunit and no affinity for the α5 subunit.31 Using a dose of Ro15-4513 (0.03 mg/kg) calculated to block 50% of binding of [11C]Ro15-4513 to the low-affinity binding site (presumably the α1, α2, and α3 subunits) and much higher percentage of the high binding affinity site (presumably α5 subunit), a uniform blocking effect was observed on [11C]ADO binding across brain regions in 2 different monkeys (Figure 6B and C). Similarly, using a dose of zolpidem calculated to block 50% of [11C]Ro15-4513 binding in the occipital cortex (and lower blocking in other regions), no differential blocking effect was observed on [11C]ADO binding across brain regions (Figure 6D). These data indicated a lack of subunit selectivity for [11C]ADO binding in vivo in the monkey brain.
In conclusion, results from the present study indicate that [11C]ADO is a specific radiotracer for the GABAA receptor with several favorable properties: high brain uptake, fast tissue kinetics, and good specific binding signals. The magnitude of specific binding signals provided by [11C]ADO is on a par with that of [11C]flumazenil. However, subtype selectivity of [11C]ADO is not demonstrated. As a result, the search for an α2/α3 subtype-selective GABAA PET radiotracer continues.
Supplementary Material
Acknowledgments
The authors would like to thank Dr Jun Maeda for providing the ED 50 values of Ro15-4513 and to thank the staff of the Yale PET Center for their expert assistance in carrying out the experiments.
Footnotes
Declaration of Conflicting Interests: The author(s) declared no potential conflicts of interest with respect to the research, authorship, and/or publication of this article.
Funding: The author(s) received no financial support for the research, authorship, and/or publication of this article.
Supplemental Material: Supplementary material for this article is available online.
References
- 1. Obata K. Synaptic inhibition and γ-aminobutyric acid in the mammalian central nervous system. Proc Jpn Acad Ser B Phys Biol Sci. 2013;89(4):139–156. [DOI] [PMC free article] [PubMed] [Google Scholar]
- 2. Sieghart W, Fuchs K, Tretter V, et al. Structure and subunit composition of GABAA receptors. Neurochem Int. 1999;34(5):379–385. [DOI] [PubMed] [Google Scholar]
- 3. Nutt DJ, Malizia AL. New insights into the role of the GABAA-benzodiazepine receptor in psychiatric disorder. Br J Psychiatry. 2001;179:390–396. [DOI] [PubMed] [Google Scholar]
- 4. Atack JR. Anxioselective compounds acting at the GABAA receptor benzodiazepine binding site. Curr Drug Targets CNS Neurol Disord. 2003;2(4):213–232. [DOI] [PubMed] [Google Scholar]
- 5. Korpi ER, Mattila MJ, Wisden W, Luddens H. GABAA-receptor subtypes: clinical efficacy and selectivity of benzodiazepine site ligands. Ann Med. 1997;29(4):275–282. [DOI] [PubMed] [Google Scholar]
- 6. Stephens DN, King SL, Lambert JJ, Belelli D, Duka T. GABAA receptor subtype involvement in addictive behaviour. Genes Brain Behav. 2017;16(1):149–184. [DOI] [PubMed] [Google Scholar]
- 7. Fritschy JM, Mohler H. GABAA-receptor heterogeneity in the adult rat brain: differential regional and cellular distribution of seven major subunits. J Comp Neurol. 1995;359(1):154–1494. [DOI] [PubMed] [Google Scholar]
- 8. Pirker S, Schwarzer C, Wieselthaler A, Sieghart W, Sperk G. GABAA receptors: immunocytochemical distribution of 13 subunits in the adult rat brain. Neuroscience. 2000;101(4):815–850. [DOI] [PubMed] [Google Scholar]
- 9. Rudolph U, Crestani F, Benke D, et al. Benzodiazepine actions mediated by specific γ-aminobutyric acidA receptor subtypes. Nature. 1999;401(6755):796–800. [DOI] [PubMed] [Google Scholar]
- 10. Sigel E, Steinmann ME. Structure, function, and modulation of GABAA receptors. J Biol Chem. 2012;287(9):40224–40231. [DOI] [PMC free article] [PubMed] [Google Scholar]
- 11. McKernan RM, Rosahl TW, Reynolds DS, et al. Sedative but not anxiolytic properties of benzodiazepines are mediated by the GABAA receptor α1 subtype. Nat Neurosci. 2000;3(6):587–592. [DOI] [PubMed] [Google Scholar]
- 12. Paul J, Yevenes GE, Benke D, et al. Antihyperalgesia by α2-GABAA receptors occurs via a genuine spinal action and does not involve supraspinal sites. Neuropsychopharmacology. 2014;39(2):477–487. [DOI] [PMC free article] [PubMed] [Google Scholar]
- 13. Katsifis A, Kassiou M. Development of radioligands for in vivo imaging of GABAA-benzodiazepine receptors. Mini Rev Med Chem. 2004;4(8):909–921. [DOI] [PubMed] [Google Scholar]
- 14. Sieghart W. Structure and pharmacology of γ-aminobutyric acidA receptor subtypes. Pharmacol Rev. 1995;47(2):181–234. [PubMed] [Google Scholar]
- 15. Salmi E, Aalto S, Hirvonen J, et al. Measurement of GABAA receptor binding in vivo with [11C]flumazenil: a test–retest study in healthy subjects. Neuroimage. 2008;41(2):260–269. [DOI] [PubMed] [Google Scholar]
- 16. Lingford-Hughes A, Hume SP, Feeney A, et al. Imaging the GABA-benzodiazepine receptor subtype containing the α5-subunit in vivo with [11C]Ro15 4513 positron emission tomography. J Cereb Blood Flow Metab. 2002;22(7):878–889. [DOI] [PubMed] [Google Scholar]
- 17. Maeda J, Suhara T, Kawabe K, et al. Visualization of α5 subunit of GABAA/benzodiazepine receptor by 11C Ro15-4513 using positron emission tomography. Synapse. 2003;47(3):200–208. [DOI] [PubMed] [Google Scholar]
- 18. Grunder G, Siessmeier T, Lange-Asschenfeldt C, et al. [18F]Fluoroethylflumazenil: a novel tracer for PET imaging of human benzodiazepine receptors. Eur J Nucl Med. 2001;28(10):1463–1470. [DOI] [PubMed] [Google Scholar]
- 19. Maziere M, Prenant C, Sastre J, et al. 11C-Ro15-1788 and 11C-flunitrazepam, two coordinates for the study by positron emission tomography of benzodiazepine binding sites. C R Seances Acad Sci III. 1983;296(18):871–876. [PubMed] [Google Scholar]
- 20. Ishiwata K, Yanai K, Ido T, Miura-Kanno Y, Kawashima K. Synthesis and biodistribution of [11C]fludiazepam for imaging benzodiazepine receptors. Int J Rad Appl Instrum B. 1988;15(4):365–371. [DOI] [PubMed] [Google Scholar]
- 21. Alhambra C, Becker C, Blake T, et al. Development and SAR of functionally selective allosteric modulators of GABAA receptors. Bioorg Med Chem. 2011;19(9):2927–2938. [DOI] [PubMed] [Google Scholar]
- 22. Christian EP, Snyder DH, Song W, et al. EEG-β/γ spectral power elevation in rat: a translatable biomarker elicited by GABAAα2/3-positive allosteric modulators at nonsedating anxiolytic doses. J Neurophysiol. 2015;113(1):116–131. [DOI] [PubMed] [Google Scholar]
- 23. Moran MD, Wilson AA, Elmore CS, et al. Development of new carbon-11 labelled radiotracers for imaging GABAA- and GABAB-benzodiazepine receptors. Bioorg Med Chem. 2012;20(14):4482–4488. [DOI] [PubMed] [Google Scholar]
- 24. Hillmer AT, Zheng MQ, Li S, et al. PET imaging evaluation of [18F]DBT-10, a novel radioligand specific to α7 nicotinic acetylcholine receptors, in nonhuman primates. Eur J Nucl Med Mol Imaging. 2016;43(3):537–547. [DOI] [PMC free article] [PubMed] [Google Scholar]
- 25. Sandiego CM, Weinzimmer D, Carson RE. Optimization of PET-MR registrations for nonhuman primates using mutual information measures: a Multi-Transform Method (MTM). Neuroimage. 2013;64:571–581. [DOI] [PMC free article] [PubMed] [Google Scholar]
- 26. Innis RB, Cunningham VJ, Delforge J, et al. Consensus nomenclature for in vivo imaging of reversibly binding radioligands. J Cereb Blood Flow Metab. 2007;27(9):1533–1539. [DOI] [PubMed] [Google Scholar]
- 27. Gunn RN, Gunn SR, Cunningham VJ. Positron emission tomography compartmental models. J Cereb Blood Flow Metab. 2001;21(6):635–652. [DOI] [PubMed] [Google Scholar]
- 28. Cunningham VJ, Rabiner EA, Slifstein M, Laruelle M, Gunn RN. Measuring drug occupancy in the absence of a reference region: the Lassen plot re-visited. J Cereb Blood Flow Metab. 2010;30(1):46–50. [DOI] [PMC free article] [PubMed] [Google Scholar]
- 29. Gallezot JD, Weinzimmer D, Nabulsi N, et al. Evaluation of [11C]MRB for assessment of occupancy of norepinephrine transporters: studies with atomoxetine in non-human primates. Neuroimage. 2011;56(1):268–279. [DOI] [PMC free article] [PubMed] [Google Scholar]
- 30. Sandiego CM, Jin X, Mulnix T, et al. Awake nonhuman primate brain PET imaging with minimal head restraint: evaluation of GABAA-benzodiazepine binding with 11C-flumazenil in awake and anesthetized animals. J Nucl Med. 2013;54(11):1962–1968. [DOI] [PMC free article] [PubMed] [Google Scholar]
- 31. Hadingham KL, Wingrove P, Le Bourdelles B, Palmer KJ, Ragan CI, Whiting PJ. Cloning of cDNA sequences encoding human α2 and α3 γ-aminobutyric acidA receptor subunits and characterization of the benzodiazepine pharmacology of recombinant α1-, α2-, α3-, and α5-containing human γ-aminobutyric acidA receptors. Mol Pharmacol. 1993;43(6):970–975. [PubMed] [Google Scholar]
Associated Data
This section collects any data citations, data availability statements, or supplementary materials included in this article.


