Abstract
Tuberculosis (TB) is a serious infectious disease and the only available vaccine M. bovis bacillus Calmette-Guérin (BCG) is safe and effective for protection against children's severe TB meningitis and some forms of disseminated TB, but fails to protect against pulmonary TB, which is the most prevalent form of the disease. Promising strategies to improve BCG currently rely either on its transformation with genes encoding immunodominant M. tuberculosis (Mtb)-specific antigens and/or complementation with genes encoding co-factors that would stimulate antigen presenting cells. Major limitations to these approaches include low efficiency, low stability, and the uncertain level of safety of expression vectors. In this study, we present an alternative approach to vaccine improvement, which consists of BCG complementation with exogenous proteins of interest on the surface of bacteria, rather than transformation with plasmids encoding corresponding genes. First, proteins of interest are expressed in fusion with monomeric avidin in standard E. coli expression systems and then used to decorate the surface of biotinylated BCG. Animal experiments using BCG surface decorated with surrogate ovalbumin antigen demonstrate that the modified bacterium is fully immunogenic and capable of inducing specific T cell responses. Altogether, the data presented here strongly support a novel and efficient method for reshaping the current BCG vaccine that replaces the laborious conventional approach of complementation with exogenous nucleic acids.
Keywords: Immunology, Issue 131, Mycobacterium tuberculosis, macrophages, immune response, recombinant proteins, T cells, antigens, Biotin, avidin-biotin
Introduction
Various strategies have been proposed to replace the current TB vaccine BCG, including protein adjuvant systems, viral vectored technologies, attenuated live M.tb strains, and genetically modified BCG strains, either to introduce genes over-expressing BCG antigens that are not sufficiently expressed during infection1 or Mtb-specific antigens not present in BCG2. Genetic engineering, however, faces many barriers including the uncertain level of safety, the time-consuming process, and the low efficiency of expression vectors4,5. With regards to improving BCG, an alternate approach is needed to improve immunogenicity without the need for uncertain genetic alternations.
In this study, we introduce a novel strategy for display of recombinant proteins of interest on the BCG cell surface that is based on the well-known high-affinity avidin interaction with biotin. This approach allows rapid and reproducible attachment of recombinant avidin fusion proteins on the surface of biotinylated BCG, which facilitates broad manipulations of BCG to achieve maximal improvement of its efficacy while maintaining its excellent safety record, observed over decades of use.
Avidin affinity for biotin is extremely high (Kd = 10−15 M) and once formed, the biotin-avidin complex is very stable and can only be disrupted under denaturing conditions6. However, for this type of interaction to serve as a gene transfer method alternative, long-term but reversible display of recombinant proteins is required. Thus, we introduced here a low affinity monomeric avidin (Kd = 10−7 M) that leads to the reversible release of protein from the surface decorated BCG once ingested inside antigen presenting cells. In order to provide a proof of concept, we tested this method using a monomeric avidin chimeric protein corresponding to a surrogate antigen derived from ovalbumin (OVA)7,8. The results showed that the BCG cell surface can be easily and rapidly decorated with monomeric avidin fusion proteins and that this binding to the BCG surface is stable and reproducible without detectable changes in bacterial growth and survival. Also, we found that BCG decorated with monomeric avidin fused with OVA (AviOVA) can induce an immune response similar to that induced by BCG genetically expressing the same antigen both in vitro and in vivo. This technology of reversible display of proteins of interest on the bacterial surface is therefore an effective replacement of traditional gene transfer approaches and can provide a platform for broad manipulations of BCG and further applications in vaccine development.
Protocol
All animals were maintained in accordance with protocols approved by the Animal Care and Use Committees at the University of British Columbia. Experiments were approved by the Animal Care and Use Committees and performed according to the Canadian Council on Animal Care Guidelines. The animal assurance welfare number is A11-0247.
1. Generation of Monomeric Avidin Fusion Proteins Expressing Plasmids
Sub-clone monomeric avidin sequence12 into pDEST17 plasmid between the "CTC" and "GAA" sites which corresponds to 133-134bp. (i.e., between the 6-histag and the pDEST17 Attr1 recombination site) to obtain p17-Avi. NOTE: The monomeric avidin DNA sequence is shown below. The three mutations introduced in wild-type Avidin to obtain monomeric avidin are shown in bolded characters. gccagaaagtgctcg ctgactggga aatggaccaa cgatctgggc tccATCatga ccatcggggc tgtgaacagc agaggtgaat tcacaggcac ctacatcaca gccgtaacag ccacatcaaa tgagatcaaa gagtcaccac tgcatgggac acaaGCTacc atcaacaaga ggacccagcc cacctttggc ttcaccgtca attggaagtt ttcagagtcc accactgtct tcacgggcca gtgcttcata gacaggaatg ggaaggaggt cctgaagacc atgtggctgc tgcggtcaag tgttaatgac attggtgatg acAAAaaagc taccagggtc ggcatcaaca tcttcactcg cctgcgcaca cagaaggagt ga
- Design primers flanked with AttB1 and AttB2 sites corresponding to OVA polypeptide757-1035 (I-Ab- and H-2Kb-restricted epitopes) DNA sequence. Primer sequences are: Attb1-OVA GGGGACAAGTTTGTACAAAAAAGCAGGCTTCCTTGAGCAGCTTGAGAGTAT and Attb2-OVA GGGGACCACTTTGTACAAGAAAGCTGGGTGTTACCCTACCACCTCTCTGC. (Attb1 and Attb2 sequences are bolded).
- PCR-amplify OVA polypeptide757-1035 DNA sequence with the primers above using the pUC57-OVA plasmid as a template.
- Clone the PCR products into pDONR-221 through a site-specific in vitro recombination reaction (e.g., BP Clonase) to obtain pDONR-OVA.
Transfer the gene of interest into p17-Avi using the LR Clonase reaction to obtain p17-Avi-OVA. NOTE: For details of BP and LR recombination cloning, see the manufacturer's manual.
2. Monomeric Avidin Fusion Protein Expression, Purification, and Refolding
Transform p17-Avi-OVA plasmid into E. coli BL21 and induce 250 mL of E. coli BL21 culture with IPTG (0.1 M) for 3 h at 37 °C.
- Lysis of Bacteria and Inclusion Bodies Solubilization
- Pellet the 250 mL of induced BL21 culture by 30 min of centrifugation at 4,000 x g and at 4 °C.
- Collect pellets in 10 mL of lysis buffer (50 mM Tris-HCL, 150 mM NaCl, 6 M Guanidine-HCL, pH 1.5-2.5) and incubate for 15 min at 95 °C. Incubate overnight at room temperature on a rotator.
- Centrifuge 30 min at 15,000 x g and 4 °C and collect supernatant.
- Purify Avi-OVA from Supernatant (Solubilized Inclusion Bodies Fraction) Using Ni-NTA Columns.
- Dilute inclusion bodies 1:2 with lysis buffer.
- Use 4 mL of Ni-NTA resin per 250 mL of culture-derived inclusion bodies.
- Wash 3x with 10 mL of lysis buffer (pH 7.0).
- Elute with 10 mL of elution buffer (lysis buffer pH 7.0 with 250 mM imidazole).
Refold eluted protein by gradual dilution (1:10) and rapid vortexing in Tris buffer (pH 7.5) containing 1 mM DTT, 200 mM NDSB256 (3-(Benzyldimethylammonio)propanesulfonate), 0.5 mM Tween 80, 500 mM arginine, and 200 mM NaCl for 30 min at room temperature.
De-salt and buffer exchange refolded protein from Tris buffer into PBS with protein concentrators according to the manufacturer's protocols.
Remove aggregates by centrifugation for 30 min at 3,500 x g and at 4 °C, and store aliquots of soluble protein at -20 °C.
3. Biotinylation of BCG Cell Surface
Grow BCG in Middlebrook 7H9 broth with 10% OADC (oleic acid, albumin and dextrose solution) and 0.05% Tween 80 at 37 °C on a shaker platform at 50 rpm until OD = 0.5-1. NOTE: BCG is a biosafety level 2 pathogen and all experiments concerning BCG should be done in a biosafety cabinet with proper personal protective equipment.
Wash 109 BCG 3 times with 500 µL of ice-cold endotoxin free PBS plus 0.1% Tween80 (PBST) (pH 8.0). Suspend BCG pellet in sterile endotoxin free PBS.
- Immediately before use, prepare 1 mL of 10 mM Sulfo-NHS SS biotin in sterile filtered water.
- Incubate bacteria with 1 mL of 0.5 mM of Sulfo-NHS SS biotin at room temperature for 30 min.
- Wash labeled bacteria 3 times with 500 µL of iced cold PBST to remove non-reacted biotinylation reagent.
- Re-suspend pellet in 1 mL of PBST.
- To evaluate biotinylation efficiency, stain 108 biotinylated BCG with Streptavidin-FITC (1:100, 25 µL) at room temperature for 20 min.
- Incubate stained bacteria in 1 mL of 2% PFA for 20 min at room temperature and then examine levels of biotinylation by flow cytometry analysis.
4. Phenotype of Biotinylated Mycobacteria: Growth and Survival
- Grow BCG strains in Middlebrook 7H9 broth with 10% OADC (oleic acid, albumin and dextrose solution) and 0.05% Tween 80 at 37 °C on a shaker platform at 50 rpm.
- Record the optical density (OD600) of the bacterial culture over an 8-day period.
- Use BCG-Luc (previously described9) to detect survival of bacteria in macrophages.
- Infect RAW264.7 cells with biotinylated BCG-Luc (MOI 10:1) or untreated BCG-Luc (control) and incubated at 37 °C over a 48 h time period.
- Wash cell monolayers and then lyse with 0.025% SDS to release ingested bacteria.
- Measure bioluminescence production with Luciferase assay system and luminometer. NOTE: Luminescence signal is indicative of bacterial viability. Please refer to the manufacturer's manual for details of luciferase assay.
5. Binding of Monomeric Avidin-Fusion Protein to Biotinylated BCG Surface
Mix 5 x 10⁸ biotinylated BCG with Avi-protein (10 μg/mL final in PBS-T) for 1 h at room temperature on shaker platform.
Wash bacteria 3 times with 500 µL of iced cold PBST and stain with rabbit anti-avidin antibody (Ab) (1:100 dilution, previously described10) for 20 min at room temperature and then with FITC conjugated goat anti-rabbit IgG Ab in the same conditions.
Wash bacteria 3 times with 500 µL of PBST and analyze by flow cytometry to evaluate the extent of surface decoration.
6. Lyophilization of Mycobacteria
Biotinylate bacteria according to step 3.1-3.4 and coat biotinylated bacteria with Avi-OVA according to step 5.1.
Aliquot biotinylated and coated bacteria (108), wash with PBS and re-suspend in 0.5 mL lyophilization media (25% Sauton medium, 75% H2O, and 1.5% Na-glutamate).
Transfer bacteria to glass vials and freeze in a -80 °C freezer overnight.
Lyophilize filled and frozen glass vials for 24 h using a freeze dryer.
Store dried samples at room temperature and reconstitute in PBS when needed.
Repeat step 3.5 to evaluate biotinylation and surface coating stability.
7. Phagocytosis Assay
Grow RAW 264.7 macrophage cells in 10 cm diameter culture dishes in DMEM medium containing 5% FCS, 1% each of L-glutamine, HEPES, non-essential amino acids, and penicillin and streptomycin until 70-80% confluency.
Seed 2 x 10⁶ RAW 264.7 macrophage cells in a 6-well plate. Allow cells to adhere overnight at 37 °C and 5% CO2.
Generate DsRed BCG (previously described9) decorated with Avi-OVA (DsRed BCG-Avi-OVA) according to steps 3.1-3.4 and 5.1.
Infect RAW cells with DsRed BCG-Avi-OVA or untreated DsRed BCG at MOI 20:1 for 24 h at 37 °C.
Wash cells three times and trypsinize using 1 mL of 0.25% trypsin at 37 °C for 10 min to remove partially detached bacteria.
Fix in 2.5% PFA in PBS for 20 min at room temperature.
Wash 3x with PBS and analyze by flow cytometry.
8. Intracellular Trafficking of OVA Decorated Biotinylated BCG in Macrophages
- Fluorescence microscopy
- Seed 3 x 10⁵ RAW 264.7 macrophage cells on coverslips in a 24-well plate. Allow cells to adhere overnight at 37 °C and 5% CO2.
- Infect macrophage cells with mycobacteria (MOI 10:1) in maintenance media without antibiotics at 37 °C and 5% CO2 for 4 to 24 h.
- Wash cells and trypsinize to remove surface attached, non-ingested bacteria as in step 7.5.
- Fix infected cells in 2.5% PFA in PBS for 20 min at room temperature followed by 3 washes with PBS.
- Permeabilize cells in blocking/permeabilization buffer (0.1% Triton X-100, 3% BSA in PBS) for 20 min at room temperature.
- Use specific antibody of interest (e.g., rabbit anti-avidin Ab) at 10 μg/mL in permeabilization buffer for 20 min at room temperature followed by secondary antibody (e.g., FITC-goat anti-rabbit IgG) for 20 min.
- Wash cells 3x with PBS, once with water, and mount on slides in 10 μL of aqueous mounting medium to minimize fluorescence photobleaching.
- Examine slides by digital confocal microscopy using an epifluorescence microscope equipped with 63x/1.4 Plan-Apochromat objective. Record images using a digital camera coupled to the microscope software.
- Immunogold Staining and Electron Microscopy
- Seed 2 x 10⁶ RAW 264.7 macrophage cells in 6-well plates.
- Fix BCG infected macrophages with 4% PFA for 4 h in room temperature.
- Wash samples twice with PBS.
- Embed samples in 4% low melting point agarose, and dehydrate in 70% ethanol.
- Transfer samples to acrylic resin and polymerize at 50 °C.
- Cut out 60 nm sections with a microtome and collect sections on nickel grids.
- Label samples with 10 μg/mL avidin antibody for 1 h at room temperature or 4 °C overnight in incubation solution (PBS and 0.1% BSA) and then wash with incubation solution gold-conjugated F(ab')2 of ultra-small goat-anti-rabbit IgG (1/20) for 1 h at room temperature in incubation solution.
- Wash sections in distilled water, stain in 2% glutaraldehyde, wash again, air dry, and examine with electron microscope.
9. Animal Immunization and Organ Processing
NOTE: All steps should be done in a biosafety cabinet.
Pass biotinylated and protein coated bacteria through 271/2G needle 10 times to make single cell suspension.
- Take 1 x 10⁶ bacteria in 100 μL of endotoxin-free PBS and immunize a female C57BL/6 mice (I-Ab, H-2Kb, 5-6 week old) subcutaneously in the scruff of the neck.
- Inject control mice with 100 μL of PBS alone.
- Euthanize immunized mice 20 days post-immunization by CO2 inhalation followed by cervical dislocation.
- Isolate the spleen and transfer it into RPMI media.
- Mash spleen through a 70 µm cell strainer with a 5 mL syringe plunger.
- Wash with 5 mL of RPMI. Centrifuge (800 x g, 3 min) to isolate a single cell suspension.
- Deplete RBC with mouse biotin positive selection kit with biotin-Ter119/Erythroid cells Ab.
- Centrifuge and re-suspend cells in 10 mL of complete RPMI (10% FCS, 1% L-glutamine, 1% penicillin, 1% streptomycin, and 50 μM 2-ME).
10. I-Ab tetramer Staining to Determine the Frequencies of Antigen-Specific CD4+ T Cells and Intracellular Cytokine Staining to Determine Frequencies of Antigen-Specific T Cells Releasing Cytokines in Immunized Animals
- Tetramer Staining
- Stain splenocytes from control and immunized mice (~20 x 106 cells) with PE-conjugated I-Ab-OVA323-339 tetramers (1/12.5 dilution) for 1 h at 37 °C in binding buffer (PBS with 2% FCS and 0.1% NaN3).
- Add AF647 CD4 Ab (1:25) and 7-AAD (to detect dead cells) to splenocytes for 20 min at room temperature.
- Analyze samples by flow cytometry.
- Acquire 500,000 events in the CD4 positive region to determine the frequency of tetramer positive events. NOTE: Total splenocytes are defined by the SSC/FSC dot blot, live cells by exclusion of the 7-AAD positive events, and CD4 subsets by gating AF647 positive events.
- Frequency of Antigen Specific Intracellular Cytokine Releasing T Cells
- Transfer approximately 1 × 10⁷ splenocytes into 4 mL of complete RPMI medium in six-well plates with or without recombinant OVA (10 µg/mL) and incubate for 16 h.
- Treat cells with Brefeldin A (1:1,000) for an additional 5 h.
- Wash with PBS and subject to intracellular cytokine staining as follows:
- Stain cell samples with PE-CD8 or PE-Cy7-CD4 Ab (1:50 in binding buffer) in room temperature for 30 min.
- Fix in 4% PFA at room temperature for 20 min.
- Permeabilize using permeabilization solution, according to the manufacturer's instructions.
- Wash cells and label with AF647-conjugated IFN-γ Ab (1:50) for 20 min at room temperature.
- Wash cells and subject to flow cytometry analysis as described above.
Representative Results
With the general procedures described above, the feasibility of BCG surface biotinylation and decoration with surrogate antigen OVA was examined. The immunogenicity of the modified BCG was then tested in vivo. The bacterial surface was easily labeled with biotin for rapid display of avidin chimeric antigens without any detectable changes in bacterial phenotypes. The resulting modified BCG is efficiently ingested by antigen presentation cells and can induce an OVA-specific immune response in mice.
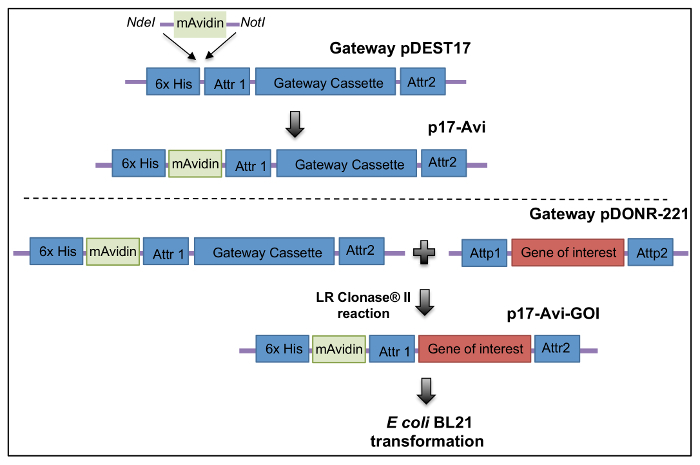
Generation of monomeric avidin fusion plasmids and proteins An expression plasmid p17-Avi was generated to be compatible with Gateway methodology to be used to produce monomeric avidin fusion proteins. OVA was cloned into p17-Avi and expressed in E. coli, then purified and refoldedas described above (Figure 1).
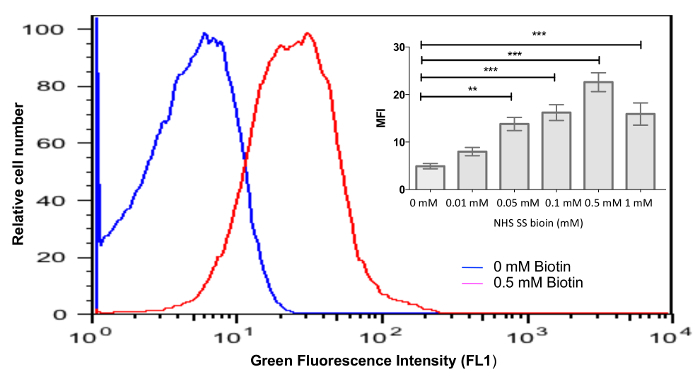
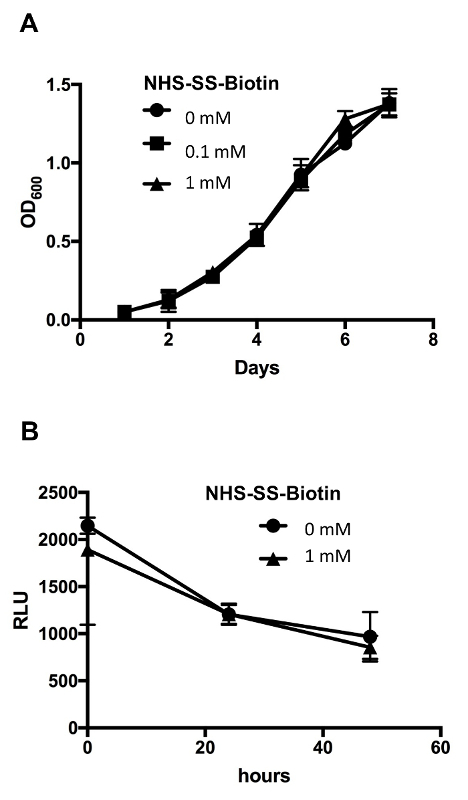
Biotin attaches efficiently to the bacterial surface and does not affect bacterial growth or survival Bacteria were labeled with various concentrations (0-1 mM) of biotin and stained to examine the efficiency of surface biotinylation according to protocols above. Flow cytometry analysis showed a total shift of fluorescence histogram in bacteria labeled with 0.5 mM biotin (Figure 2), and this concentration was used throughout this study to generate biotinylated bacteria. Next, we examined the effect of bacterial surface modification on bacterial phenotype and found that biotinylated and control untreated BCG displayed a similar growth profile over an 8-day period (Figure 3A). BCG expressing luciferase (BCG-Luc)9 was used to examine bacterial survival in macrophages. Luminescence signals indicative of bacterial viability were recorded over 48 h. Results obtained showed similar profiles of gradual viability decrease between biotinylated and control bacteria (Figure 3B). In conclusion, these data clearly indicate that bacterial surface biotinylation does not affect either bacterial growth or survival inside macrophages, which is important since increased survival in macrophages could mean an increase in bacterial virulence.
Efficiency of bacterial surface decoration Biotinylated bacteria were coated with OVA antigen peptide in fusion with monomeric avidin, according to protocols above. Flow cytometry analysis showed minimal levels of OVA binding to non-biotinylated bacteria (MFI= 8.31 ± 0.42, Figure 4A, top panel) and significant levels of OVA binding to biotinylated bacteria (MFI= 54.67 ± 4.98) compared to control bacteria (MFI = 5.92 ± 0.22, Figure 4A, lower panel).
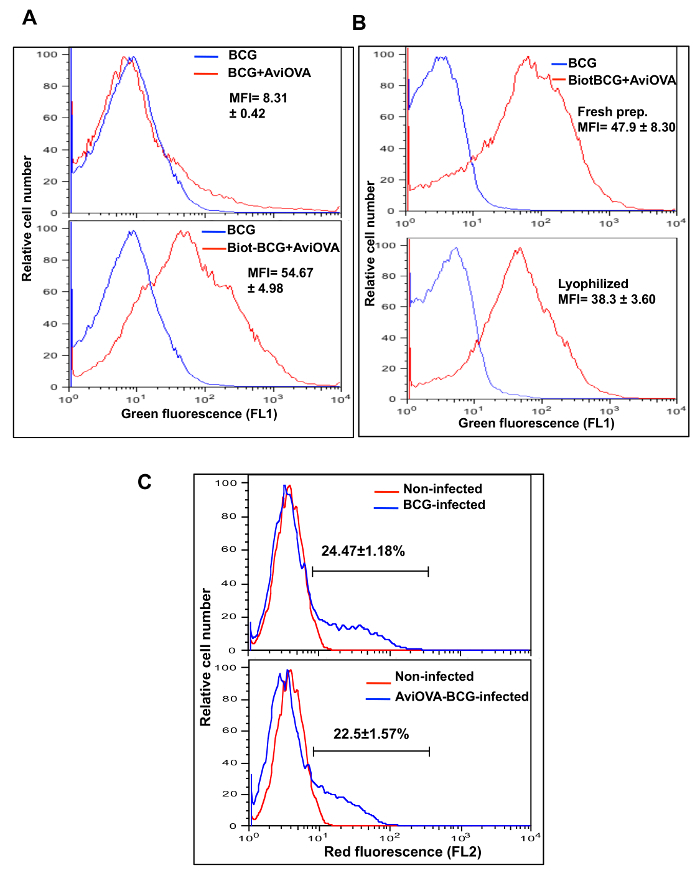
Stability of BCG surface decoration Since conventional live BCG vaccines are formulated as dried powders, an important question that arose during this study was the stability of modified BCG after freeze-drying, reconstitution, and storage at refrigerated or room temperature. Therefore, we examined surface display of Avi-OVA in lyophilized BCG Avi-OVA (surface decorated with Avi-OVA) and in freshly decorated bacterial preparations. The results (Figure 4B) showed that levels of Avi-OVA on the bacterial surface remained stable and detectable one month after lyophilization and storage in room temperature compared to fresh BCG Avi-OVA preparations, which proved that this surface decoration method is suitable for vaccine development.
Macrophage phenotype is not affected by bacterial surface decoration To see whether this surface decoration methodology interferes with bacterial entry into host cells, we used RAW264.7 cells and DsRed bacteria9 to perform a phagocytosis assay described in the protocol above. Figure 4C showed that bacterial surface decorated BCG did not have significant interference with bacterial entry (22.5 ± 1.57%) compared to uncoated wild type BCG (24.47 ± 1.18%) indicating that surface decoration of BCG has no effect on macrophage phenotype.
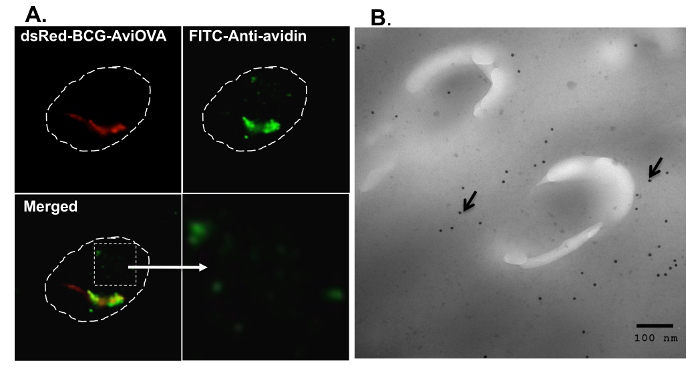
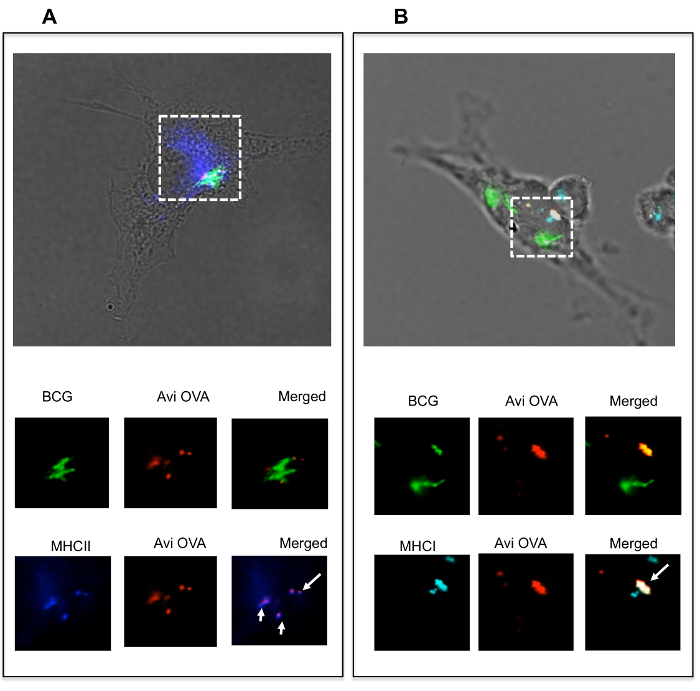
Avidin fusion proteins travel intracellularly and co-localize with MHC molecules To examine Avi-OVA-decorated BCG's fate within macrophages, adherent RAW cells were infected and examined by fluorescence microscopy, as described in the protocol above. Images obtained (Figure 5A) showed that Avi-OVA was not only present on the bacterial surface, but also detached and translocated to the cytoplasm distant to the bacteria. To further verify this result, we performed an immunogold staining experiment and the images obtained clearly showed that Avi-OVA antigens are not only present on the BCG surface, but can also detach from the BCG surface, cross the phagosomal membrane, and travel toward the cytosol (Figure 5B). To further examine whether the Avi-OVA decorated bacteria were capable of delivering their surface protein cargo to the antigen presentation pathway, macrophages were infected with Avi-OVA BCG, as described in the protocol, and subjected to confocal analyses. Results (Figure 6A) showed that there was colocalization of Avi-OVA with I-A molecules, suggesting that avidin fusion protein detached and translocated to antigen presentation compartments where they were loaded on to MHC II molecules. Results also showed that Avi-OVA peptide co-localizes with class I molecules within BCG phagosomes when stained for H-2kb (Figure 6B), which demonstrated that there is potential presentation of Avi-OVA antigen to CD8+ T cells by the macrophage. These data indicate that once surface decorated bacteria enter macrophages, the antigens are able to traffic towards the antigen presentation pathways.
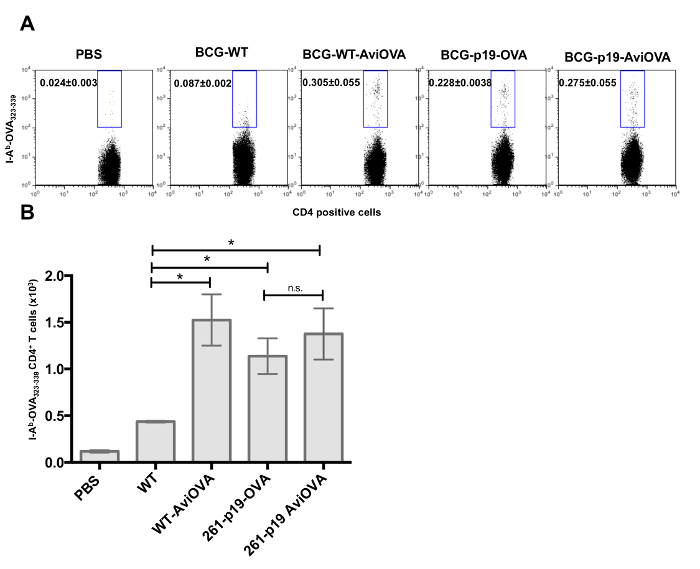
Surface decorated bacteria are fully immunogenic To examine whether surface decorated BCG is capable of inducing a specific immune response in vivo, C57BL/6 mice were immunized with PBS alone (control), wild-type BCG, Avi-OVA decorated BCG, and BCG genetically transformed with a plasmid to express a similar OVA antigen. Immunized mice were sacrificed 20 days later and the frequencies of OVA-specific CD4+ T cells and OVA-specific T cells releasing cytokines were detected, according to the protocol. Results (Figure 7A-B) showed a larger proportion of OVA-specific CD4+T cell response in animals immunized with BCG coated with Avi-OVA compared to BCG WT. BCG genetically modified to express OVA showed a similar immune response to BCG Avi-OVA (Figure 7). These data showed that the bacterial surface decoration method is able to induce a significant expansion of antigen specific CD4+ T cells and the degree of T cell response induction is comparable to BCG genetically engineered to express a similar OVA antigen.
Since intracellular cytokines are also important indicators of antigen specific T cell responses, intracellular cytokines staining (ICS) experiments were conducted to further assess T cell immune responses by determining the expression and frequencies of effector cytokines in animals immunized with OVA-decorated bacteria and bacteria genetically transformed with an OVA expressing plasmid. We examined levels of IFN-γ release, which is a known indicator of protective response against intracellular bacteria11. We demonstrated that we were able to detect similar levels of OVA-specific IFN-γ releasing CD4+ cells in animals immunized with bacteria surface decorated with OVA (BCG-Avi-OVA and BCG-p19-Avi-OVA) compared to animals immunized with bacteria genetically expressing OVA (BCG-p19-OVA) (Figure 8A). Importantly, we were also able to detect significantly higher frequencies of IFN-γ producing CD8+ T cells in animals immunized with BCG-Avi-OVA compared to animals immunized with BCG genetically expressing OVA (Figure 8B-C)which demonstrates that the biotin-avidin mediated surface display of antigen methodology can effectively replace BCG transformation with nucleic acids.
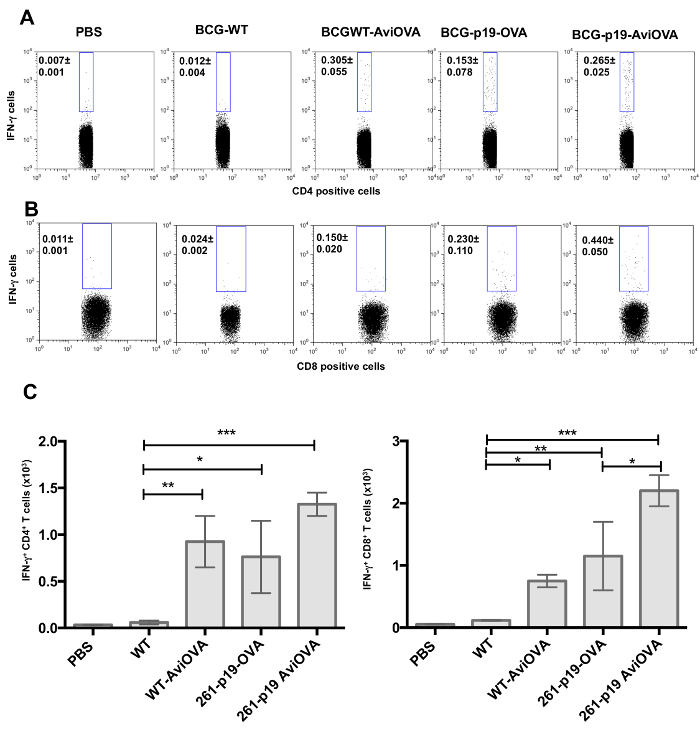
Figure 1: Construction of a recombination cloning plasmid for the production of avidin fusion proteins. (A) A gene segment encoding for monomeric avidin was synthesized with restriction sites NdeI and NotI and subcloned into pDEST17 between the 6x histidine and the gateway cassette to generate p17-Avi plasmid. OVA peptide252-345 DNA sequences terminated with attB sites were cloned into pDONR221. Thereafter, OVA genes were subcloned into p17-Avi. Image edited and reprinted with permission from PLOS ONE12. Please click here to view a larger version of this figure.
Figure 2: Efficiency of BCG biotinylation. BCG was biotinylated with various concentration of NHS-SS-biotin for 30 min at room temperature, then labeled with FITC-streptavidin, and analyzed by flow cytometry. Results are presented as histograms of green fluorescence intensity and the insert graph represents the mean ± SEM of mean fluorescence intensities (MFI) deducted from 3 independent experiments. *P<0.05; **P<0.01; ***P<0.001. Image edited and reprinted with permission from PLOS ONE12. Please click here to view a larger version of this figure.
Figure 3: Biotinylation of BCG surface did not affect its growth or its survival in the macrophage. (A) Biot-BCG and control unlabeled wild-type BCG were grown in complete 7H9 media, and replication was monitored over an 8-day period. The results are expressed as growth curves, i.e., mean absorbance at 600 nm as function of time ± SEM from 3 independent experiments. (B) Macrophages were infected with Biot-BCG-Luc or control unlabeled BCG-Luc for the indicated time periods, and then cell lysates were prepared and assayed for bioluminescence to detect viable bacteria. Results are expressed as mean relative light units (RLU) ± SEM from 3 independent experiments. Image edited and reprinted with permission from PLOS ONE12. Please click here to view a larger version of this figure.
Figure 4: Avi-OVA binding to Biot-BCG and its stability. (A) Biot-dsRed-BCG (bacteria expressing red fluorescence, previously described9) and control non-biotinylated dsRed-BCG were mixed with Avi-OVA at room temperature for 1 h and the extent of OVA binding was evaluated by surface staining with rabbit anti-avidin antibody and FITC- goat anti-rabbit IgG (FL1). Samples were washed and analyzed by flow cytometry. Results are presented as histograms of green fluorescence intensity, and values are mean ± SEM of MFI of Biot-BCG-AviOVA binding obtained from three independent experiments. (B) Lyophilized Biot-BCG coated with Avi-OVA and freshly made Avi-OVA-Biot-BCG were labeled and analyzed by flow cytometry as described in A. Data shown are representative of three independent experiments, and values are mean ± SEM of MFI of Avi-OVA-Biot-BCG binding obtained from three independent experiments. (C) RAW macrophages were infected with DsRed BCG-Avi-OOVA or DsRed-BCG for 24 h at 37 °C. Samples were then washed, treated with trypsin, fixed, and analyzed by FACS. Results are expressed as red fluorescence histograms, which reflect the extent of phagocytosis. Values indicate average percentage ± SEM of cells ingesting BCG obtained from three independent experiments. Image edited and reprinted with permission from PLOS ONE12. Please click here to view a larger version of this figure.
Figure 5: Avi-OVA detached from BCG surface and crossed the phagosomal membrane toward the cytosol. (A) Adherent RAW cells on cover slips were infected with OVA-decorated dsRed-BCG for 24 h at 37 °C and then fixed/permeabilized and stained with rabbit anti-avidin antibody and FITC- goat anti-rabbit IgG. Samples were mounted on microscope slides and analyzed by digital confocal microscopy. Red signals indicate the position of BCG and green signals reflect the localization of Avi-OVA. The dotted line indicates the macrophage cell boundary and the bottom right panel is a 4X magnification of the insert shown in left panel. (B) Thin sections of BCG-AviOVA infected RAW cells were fixed with paraformaldehyde and incubated sequentially with anti-avidin antibody and gold-conjugated goat anti-rabbit IgG to visualize Avi-OVA and examined with an electron microscope. Magnification of 12,000X is shown. The arrowheads indicate Avi-OVA dissociated from BCG surface and exported beyond the phagosome membrane. The images shown are representatives of two independent experiments. Image edited and reprinted with permission from PLOS ONE12. Please click here to view a larger version of this figure.
Figure 6: Avidin-fusion antigen co-localized with MHC class II and class I molecules. Adherent BMA3.1A7 cells, a mouse macrophage cell line, were infected with OVA decorated GFP-BCG (expressing green fluorescent, previously described9) for 4 h and then stimulated with IFN-γ for 24 h. Cells were then fixed/permeabilized and stained with rabbit anti-avidin antibody, Alexa 594 anti-rabbit IgG and either Alexa 647 rat anti-mouse I-A (A) or Alexa 647 rat anti-mouse H-2kb (B). Samples were mounted on microscope slides and analyzed by digital confocal microscopy. Green signals indicate the position of BCG-GFP and red signals reflect the localization of Avi-OVA. Blue signals indicate the position of MHC class II or class I molecules. The dotted line indicates the area of interest. Arrowheads indicate Avi-OVA colocalization with MHC molecules. Images shown are representatives of two independent experiments. Image edited and reprinted with permission from PLOS ONE12. Please click here to view a larger version of this figure.
Figure 7: In vivo CD4+ T cell response to OVA-decorated BCG. C57BL/6 mice were injected subcutaneously with BCG surface decorated with OVA, unmodified BCG wild-type, PBS (control), BCG genetically transformed to express OVA (BCG-p19-OVA), or transformed with control plasmid and surface decorated with Avi-OVA (BCG-p19-AviOVA). After a 20-day period, splenocytes were prepared from the spleens of euthanized animals and stained with PE-conjugated I-Ab-OVA323-339 tetramers (A) followed by AF647-CD4 antibody and 7-AAD. Samples were then analyzed by flow cytometry. Results are expressed as two-parameter dot plots that show the average frequencies ± SEM of tetramer positive events in the CD4+ population from two animals/group. Data shown are representative of three independent experiments (a total of six mice were examined with cell samples from each mouse evaluated in triplicate). The data in graphs (B) are expressed as mean value ± SEM of the absolute number (in a total of 500,000 events) of OVA tetramer specific CD4+ cells in from two animals/group and three independent experiments. *P<0.05; **P<0.01; ***P<0.001. Image edited and reprinted with permission from PLOS ONE12. Please click here to view a larger version of this figure.
Figure 8: Frequencies of T cells releasing cytokines in response to Avi-OVA coated BCG-immunization. Splenocytes from immunized mice with PBS, BCG Wild-type, BCG WT surface decorated with Avi-OVA, BCG-p19-OVA, and BCG-p19-AviOVA were stimulated with recombinant OVA protein for 16 h followed by a 5 h-period treatment with Brefeldin A. Cells were then washed and stained first with PE-Cy7 anti-CD4 (A) or PE anti- CD8 antibody (B) then AF647 anti-IFN-γ antibody. Cells were then washed and analyzed by flow cytometry. Results are expressed as two-parameter dot plots to show the average frequencies ± SEM of IFN-γ producing cell subsets in CD4+ and CD8+ populations from two animals/group. Data shown are representative of three independent experiments (a total of six mice were examined with cell samples from each mouse evaluated in triplicate). The data in graphs (C) are expressed as the mean of absolute number ± SEM of IFN-γ releasing CD4+ T cells (left graph) or IFN-γ releasing CD8+ T cells (right graph) from two animals/group and three independent experiments. *P<0.05; **P<0.01; ***P<0.001. Image edited and reprinted with permission from PLOS ONE12. Please click here to view a larger version of this figure.
Discussion
We reported in this study a non-genetic approach for rapid and effective display of exogenous proteins on BCG surface to add either specific antigens or specific functional properties expected to efficiently improve the bacterium's immunogenicity. We demonstrated that the BCG cell surface could be easily biotinylated for instantaneous surface decoration with avidin fusion proteins. The total procedure can be performed within 2 h, while genetic transformation and selection of positive clones requires 2 to 3 months of time lag. Surface modification does not affect bacterial growth and survival. Bacteria decorated with surrogate antigen OVA were able to deliver the antigen into the antigen presentation pathway and induced specific immune response in vivo, which was evaluated by flow-cytometry assays including MHC tetramer staining and intracellular cytokine staining (ICS). More importantly, in vivo studies clearly showed that surface-decorated bacteria were able to induce similar levels of immune response compared to BCG genetically engineered to express similar antigens.
Avidin biotin interaction is the strongest non-covalent interaction known in nature with a Kd of 10−15 M13. It is not only a useful tool commonly used in biological research14, but also recently been shown to be applicable in cancer therapy15,16. In this study, a triple mutation (N54A, W110K and N17I) was applied to wild-type avidin to convert tetrameric avidin into a form of monomeric avidin that has significantly reduced avidin-biotin affinity (Kd= 10−7 M) and binds reversibly to biotin. This monomeric avidin was used to develop a p17-Avi plasmid that is compatible with Gateway recombination cloning (Invitrogen) for a one-step rapid expression of a protein of interest. This new version of monomeric avidin has several advantages including preventing large bacterial clump aggregation and transient/reversible bacterial surface display of proteins of interest. Therefore, once ingested by the host cell, Avi-fusion proteins can detach from the surface of biotinylated bacteria and traffic intracellularly. Finally, the mutations convert avidin into a non-glycosylated form that could be applicable in yeast or transgenic plants17,18 for production of large quantities of avidin fusion proteins in eukaryotic systems. This form of monomeric avidin was chosen instead of a version of monomeric streptavidin (mSA)19, which has both streptavidin and rhizavidin sequences and had a higher binding affinity (Kd of 10−9 M) compared to mAvidin. With preliminary testing, mSA chimera protein had a much lower binding efficiency to biotinylated bacteria compared to mAvidin chimera protein. This study, therefore, was based on mAvidin, but monomeric streptavidin or other forms of streptavidin/avidin would also be a possibility for other applications.
Successful implementation of the described protocols depends on the quality of the generated fusion protein and efficiency of the bacterial surface biotinylation. Eluted Avi-tagged protein should be de-salted and buffer exchanged into PBS using the proper molecular weight protein concentrator. Precipitation may occur at high concentration factors for some proteins, therefore, concentration factor should be tested and determined using small volumes of eluted protein at first, e.g., 0.5 to 1 mL of solubilized inclusion body diluted in 20 mL of PBS and then concentrated. It is also important to maintain the temperature of the protein around 4 °C during the entire process to avoid precipitation.
To improve the efficiency of bacterial surface biotinylation, Sulfo-NHS SS biotin should be stored in its original container in the dark at 4 °C. The reagent is extremely moisture sensitive; therefore, vials containing the reagent should be equilibrated to room temperature before opening. Also, biotin stock solution (10 mM) should be made immediately before use as the NHS-ester moiety hydrolyzes and become non-reactive very quickly. Biotin stock solution cannot be stored and reused; a new biotin vial is needed for every biotinylation experiment. For best results, fresh cultures of BCG, fresh media, as well as fresh buffers are recommended. As mentioned in the protocol, biotinylated and coated BCG could be lyophilized and preserved for at least 30 days without affecting the quality of the surface coating. This is particularly useful when sending or transferring samples from one location to another or when performing long course experiments.
This BCG surface decoration method also offers other exciting possibilities to analyze and evaluate the immunogenicity of newly developed vaccine candidates in a rapid and accurate way. The primary goal of novel TB vaccines is to induce TH1 type cells such as CD4+ and CD8+ T cells that play important roles in protection against TB. The avidin-biotin system developed in this study offers a very useful tool to assess these T cells' responses. This novel technology of rapidly displaying recombinant proteins/antigens on BCG surface represents a great tool to evaluate quickly and accurately the protective efficacy of many immunogenic proteins (e.g., secreted specific M.tb proteins), and thus can be translated into development of efficient vaccines.
By adjusting and varying the concentration of Avi-fusion proteins on bacterial surface, another advantage of this method could be to simultaneously display different antigens of interest on the bacterial surface to maximize the effectiveness of vaccine. Since studies have shown that BCG interferes with important macrophage functions such as phagosome maturation20,21 and antigen presentation21, one possibility to further improve BCG could be decorating BCG surface with a combination of factors known to accelerate phagosome maturation along with antigens of interest.
Some limitations of this technology include the requirement of large-scale production of recombinant proteins, which could be challenging and expensive in low-income areas. Also, producing hard to purify proteins would require troubleshooting and optimization. However, these limitations can be circumvented with the improvement of recombinant protein production technologies. Another limitation includes the possibility that naturally occurring anti-avidin antibodies common in laboratory animals and humans22 might hamper the use of avidin for therapeutic purposes. However, other labs have tested the safety and efficacy of avidin therapy and have shown that avidin's safety and efficacy were not significantly affected by its immunogenicity23. Interestingly, converting the wild-type tetrameric avidin into a monomeric form significantly decreased its immunogenicity24.
To sum up, this novel technology utilizing an avidin-biotin system to improve BCG's immunogenicity via a rapid and reproducible non-genetic bacterial surface modification with proteins of interest can successfully replace traditional transformation of BCG with antigen-encoding plasmids. Furthermore, this novel method can not only facilitate improvement of the current BCG vaccine, but can also provide a novel platform for rapid evaluation of virtually any potential antigen or proteins normally hard to express genetically in BCG, with broad applications in TB vaccine development.
Disclosures
The authors have nothing to disclose.
Acknowledgments
We thank Dr. R Stokes for the BCG Pasteur strain and A. Talal for technical support. We also thank GenScript for help with gene synthesis.
References
- Horwitz MA, Harth G. A new vaccine against tuberculosis affords greater survival after challenge than the current vaccine in the guinea pig model of pulmonary tuberculosis. Infect. Immun. 2003;71(4):1672–1679. doi: 10.1128/IAI.71.4.1672-1679.2003. [DOI] [PMC free article] [PubMed] [Google Scholar]
- Pym AS, et al. Recombinant BCG exporting ESAT-6 confers enhanced protection against tuberculosis. Nat Med. 2003;9(5):548–553. doi: 10.1038/nm859. [DOI] [PubMed] [Google Scholar]
- Grode L, et al. Increased vaccine efficacy against tuberculosis of recombinant Mycobacterium bovis bacille Calmette-Guerin mutants that secrete listeriolysin. The J Clin Invest. 2005;115(9):2472–2479. doi: 10.1172/JCI24617. [DOI] [PMC free article] [PubMed] [Google Scholar]
- Bastos RG, Borsuk S, Seixas FK, Dellagostin OA. Recombinant Mycobacterium bovis BCG. Vaccine. 2009;27(47):6495–6503. doi: 10.1016/j.vaccine.2009.08.044. [DOI] [PubMed] [Google Scholar]
- Mederle I, et al. Plasmidic versus insertional cloning of heterologous genes in Mycobacterium bovis BCG: impact on in vivo antigen persistence and immune responses. Infect Immun. 2002;70(1):303–314. doi: 10.1128/IAI.70.1.303-314.2002. [DOI] [PMC free article] [PubMed] [Google Scholar]
- Singh NP, et al. A Novel Approach to Cancer Immunotherapy Tumor Cells Decorated with CD80 Generate Effective Antitumor Immunity A Novel Approach to Cancer Immunotherapy Tumor Cells Decorated with CD80 Generate Effective Antitumor Immunity. Cancer Res. 2003;63(14):4067–4073. [PubMed] [Google Scholar]
- Oizumi S, Strbo N, Pahwa S, Deyev V, Podack ER. Molecular and cellular requirements for enhanced antigen cross-presentation to CD8 cytotoxic T lymphocytes. J Immunol. 2007;179(4):2310–2317. doi: 10.4049/jimmunol.179.4.2310. [DOI] [PubMed] [Google Scholar]
- Sharif-Paghaleh E, et al. Monitoring the efficacy of dendritic cell vaccination by early detection of (99m) Tc-HMPAO-labelled CD4(+) T cells. Eur J Immunol. 2014;44(7):2188–2191. doi: 10.1002/eji.201344337. [DOI] [PMC free article] [PubMed] [Google Scholar]
- Sun J, et al. A broad-range of recombination cloning vectors in mycobacteria. Plasmid. 2009;62(3):158–165. doi: 10.1016/j.plasmid.2009.07.003. [DOI] [PubMed] [Google Scholar]
- Laitinen OH, et al. Rational design of an active avidin monomer. J. Biol. Chem. 2003;278(6):4010–4014. doi: 10.1074/jbc.M205844200. [DOI] [PubMed] [Google Scholar]
- Flynn JL, Chan J, Triebold KJ, Dalton DK, Stewart TA, Bloom BR. An essential role for interferon gamma in resistance to Mycobacterium tuberculosis infection. J Exp Med. 1993;178(6):2249–2254. doi: 10.1084/jem.178.6.2249. [DOI] [PMC free article] [PubMed] [Google Scholar]
- Liao TYA, Lau A, Joseph S, Hytonen V, Hmama Z. Improving the immunogenicity of the Mycobacterium bovis BCG vaccine by non-genetic bacterial surface decoration using the avidin-biotin system. PLoS ONE. 2015;10(12):e0145833. doi: 10.1371/journal.pone.0145833. [DOI] [PMC free article] [PubMed] [Google Scholar]
- Green NM. Avidin and streptavidin. Methods Enzymol. 1990;184:51–67. doi: 10.1016/0076-6879(90)84259-j. [DOI] [PubMed] [Google Scholar]
- Howarth M, Takao K, Hayashi Y, Ting AY. Targeting quantum dots to surface proteins in living cells with biotin ligase. PNAS. 2005;102(21):7583–7588. doi: 10.1073/pnas.0503125102. [DOI] [PMC free article] [PubMed] [Google Scholar]
- Lesch HP, Kaikkonen MU, Pikkarainen JT, Yla-Herttuala S. Avidin-biotin technology in targeted therapy. Expert Opin Drug Deliv. 2010;7(5):551–564. doi: 10.1517/17425241003677749. [DOI] [PubMed] [Google Scholar]
- Paganelli G, Bartolomei M, Grana C, Ferrari M, Rocca P, Chinol M. Radioimmunotherapy of brain tumor. Neurol Res. 2006;28(5):518–522. doi: 10.1179/016164106X116782. [DOI] [PubMed] [Google Scholar]
- Cummings JF, et al. Safety and immunogenicity of a plant-produced recombinant monomer hemagglutinin-based influenza vaccine derived from influenza A (H1N1)pdm09 virus: a Phase 1 dose-escalation study in healthy adults. Vaccine. 2014;32(19):2251–2259. doi: 10.1016/j.vaccine.2013.10.017. [DOI] [PMC free article] [PubMed] [Google Scholar]
- Kolotilin I, et al. Plant-based solutions for veterinary immunotherapeutics and prophylactics. Vet Res. 2014;45:114–117. doi: 10.1186/s13567-014-0117-4. [DOI] [PMC free article] [PubMed] [Google Scholar]
- Demonte D, Drake EJ, Lim KH, Gulick AM, Park S. Structure-based engineering of streptavidin monomer with a reduced biotin dissociation rate. Proteins. 2013;81(9):1621–1633. doi: 10.1002/prot.24320. [DOI] [PubMed] [Google Scholar]
- Deghmane AE, et al. Lipoamide dehydrogenase mediates retention of coronin-1 on BCG vacuoles, leading to arrest in phagosome maturation. J Cell Sci. 2007;120(19):3489–3489. doi: 10.1242/jcs.006221. [DOI] [PubMed] [Google Scholar]
- Soualhine H, et al. Mycobacterium bovis bacillus Calmette-Guerin secreting active cathepsin S stimulates expression of mature MHC class II molecules and antigen presentation in human macrophages. J Immunol. 2007;179(8):5137–5145. doi: 10.4049/jimmunol.179.8.5137. [DOI] [PubMed] [Google Scholar]
- Bubb MO, Green F, Conradie JD, Tchernyshev B, Bayer EA, Wilchek M. Natural antibodies to avidin in human serum. ImmunolLett. 1993;35(3):277–280. doi: 10.1016/0165-2478(93)90194-7. [DOI] [PubMed] [Google Scholar]
- Petronzelli F, et al. Therapeutic use of avidin is not hampered by antiavidin antibodies in humans. Cancer Biother Radiopharm. 2010;25(5):563–570. doi: 10.1089/cbr.2010.0797. [DOI] [PubMed] [Google Scholar]
- Bigini P, et al. In vivo fate of avidin-nucleic acid nanoassemblies as multifunctional diagnostic tools. ACS Nano. 2014;8(1):175–187. doi: 10.1021/nn402669w. [DOI] [PubMed] [Google Scholar]


