Abstract
Plant biologists often need to observe the growth behavior of their chosen species. To this end, the plants need constant environmental and stable light conditions, which are preferably variable in quantity and quality so that studies under different setups can be conducted. These requirements are met by climatic chambers featuring light emitting diodes (LED) lights, which can – in contrast to fluorescent lights – be set to different wavelengths. LEDs are energy conserving and emit virtually no heat even at light intensities, which often constitutes a problem with other light sources. The presented protocol provides a step-by-step guidance of how to program a climatic chamber equipped with variable LED lights as well as describing several approaches for in depth analysis of growth phenotypes. Depending on the experimental set-up various characteristics of the growing plants can be observed and analyzed. Here we describe how to determine fresh weight, leaf area, photosynthetic activity, and stomatal density. We demonstrate that in order to obtain reliable data and draw valid conclusions it is mandatory to use a sufficient number of individuals for statistical evaluation. Taking too few plants for this kind of analysis results in high statistical errors and consequently in less clear interpretations of the data.
Keywords: Plant Biology, Issue 132, Arabidopsis, LED, light quality, spectrum, growth behavior, statistical evaluation
Introduction
Arabidopsis thaliana has been the model organism for plant researchers of the molecular era for more than two decades. Several characteristics make this small representative of the Brassica family an ideal candidate for genetic and molecular studies: it has a relatively small genome with only five chromosomes (compared to e.g. Nicotiana tabacum with 24 chromosomes) and its genome was completely sequenced in 20001. A. thaliana can be easily genetically modified by Agrobacterium infection2 and is amenable to even the latest genetic tools such as CRISPR/Cas3. Though small, the growth cycle is fast enough to make biochemical experiments feasible where a higher amount of material is needed. The plants grow on agar plates or on soil and can even be cultivated as liquid cultures4. Arabidopsis can be grown in climatically controlled cupboards, e.g. from Percival, in climatic chambers or in greenhouses. To be able to compare growth behavior and analyze phenotypes of mutants it is critical to provide reproducible and at the same time flexible growth conditions5. Depending on the scientific problem that is to be addressed one might need different temperatures and constant light conditions, diverse light intensities or different light qualities at the same temperature. Light is a very critical parameter in plant growth and its influence is often studied in diverse approaches6. To ensure reproducibility and comparability of the obtained data it is crucial to ensure a stable output and apply the same kind of light sources.
The usual light sources in greenhouses and climatic chambers consist of sodium vapor or fluorescent lamps, which promote satisfying plant growth but have several disadvantages. First, they age over time which changes the spectral output not only in intensity but in quality (own observations). However, only the intensity is usually monitored continuously so that a change in light quality might go unnoticed but still have significant effects. Second, both types of lamps generate heat at higher light intensities, which itself has a profound physiological influence on plant growth and might mask any light dependent effect. Third, the spectral output of these light sources is invariable and quite unlike the natural sunlight7. All these drawbacks have been overcome in case of LEDs)8,9,10,11. They have a long lifetime with barely any change in emission, do not produce waste heat even at very high light intensities and they are very flexible concerning their spectral output.
Here we illustrate how to set up a climatic chamber featuring separate LED lights for red, blue, and white light and follow different parameters of plant growth over time. We measure fresh weight, leaf area, stomata density, and photosynthetic performance. At the same time, we demonstrate the importance of properly setting up statistical evaluations.
Protocol
This protocol contains some examples of how to analyze growth behavior of A. thaliana plants.
1. Preparation
Before starting, make a careful plan on how many plants will be needed for doing a reliable statistical analysis of the experiments and then prepare the appropriate amounts of pots. NOTE: Always allow for the possibility that some seeds might not germinate.
Use a climatic chamber with different individually programmable LED levels to compare plant growth under the same general environmental conditions (Materials Table).
2. Plant Growth and Set-up of the LED Lights
Prepare the appropriate number (depending on different conditions and/or mutants to be analyzed) of 6 x 7 cm pots with soil and plant a single seed in each of them. NOTE: In this case, 36 plants per conditions were sown.
Vernalize for two days at 4 °C.
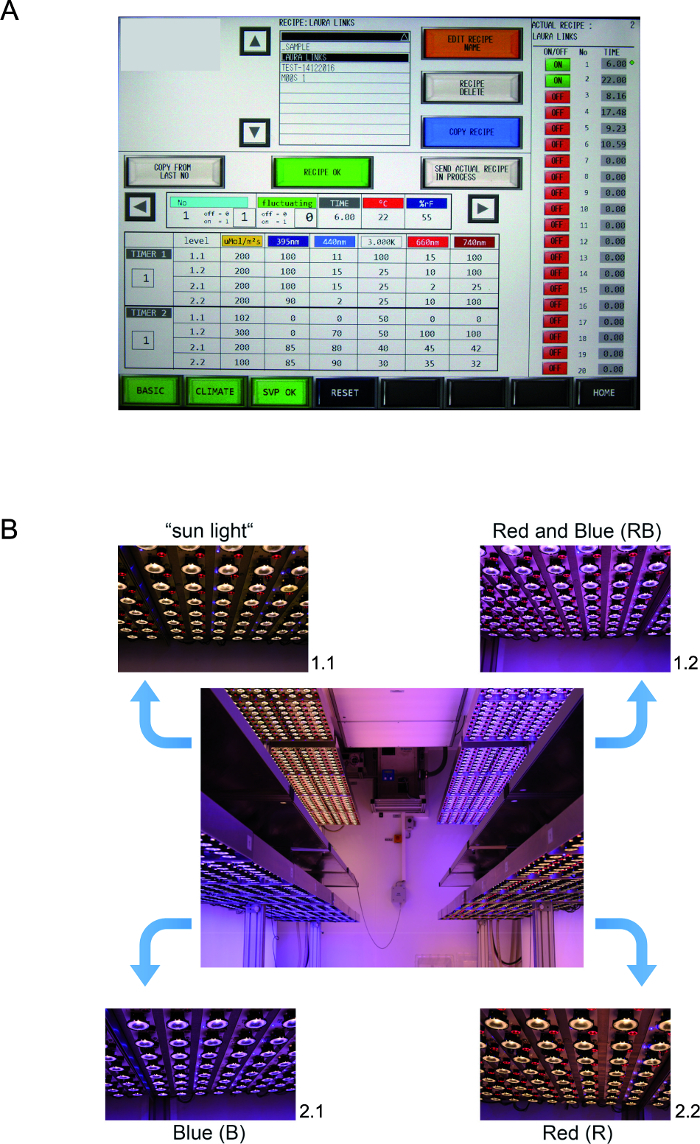
Set the relative air humidity to 65% and the temperature to 22 °C/16 °C for a 16 h day/ 8 h night cycle. Adjust the light of all levels to an intensity of 200 µM/cm2/s1. Do this by entering the respective values into a program via the touch screen at the front of the climatic chamber. To compare four different light qualities set the LEDs to the following parameters as provided in Table 1.
| Identifyier | 395 nm [%] | 440 nm [%] | 3 K [%] | 660 nm [%] | 770 nm [%] |
| "sunlight" | 100 | 11 | 100 | 15 | 100 |
| Red and Blue (RB) | 100 | 15 | 25 | 10 | 100 |
| Blue (B) | 100 | 15 | 25 | 2 | 25 |
| Red (R) | 90 | 2 | 25 | 10 | 100 |
Table 1: Composition of light intensities emitted from LEDs
Monitor the spectral output continuously, e.g. by using a built-in calibrated spectrometer.
Place the plants in the climatic chamber on the different levels and keep them covered with a transparent top until well-developed cotyledons are visible. Make sure the plants are sufficiently watered.
Monitor and document plants by eye and photographically as often as appropriate, depending on how fast the plants grow under the chosen conditions, e.g. every two days. Make sure to use a tripod for the camera to ensure the equal distance between camera and objects for all pictures and thereby enable comparisons. Use a scale bar when appropriate. NOTE: The term DAS (days after sowing) refers to the actual planting of the seeds including vernalization.
3. Determination of PSII Yield
Use a pulse-modulated fluorimeter. Set up the camera head at an appropriate distance from the plant so that the complete rosette can be seen on the live window.
Upon starting the software a "select unit" window appears. Tick "MINI" and then "ok." Choose color "blue" in the next pop-up window. Click "ok." NOTE: The pulse-modulated fluorescence measuring light is automatically switched on. On the monitor, the Image window appears showing the fluorescence parameter Ft. A plant placed under the camera can now be seen as an orange image.
To focus the image and/or choose specific regions of the plant, switch to Live Video by ticking the "live video" box and turn the adjustment ring of the objective lens. Quit the LIVE Video window by clicking the exit box in the upper right corner.
To measure photosynthetic parameters, define an area of interest (AOI). Use the default setting for this, which is a circle which automatically appears in the middle of the screen. The red box beside it represents the averaged Ft value of all pixels within the AOI. Define the appropriate AOI by choosing from the AOI box at the right panel, where different forms are available. Click “add” in the AOI tab and place the circle within the leaf area. Repeat five times per leaf.
Maintain the settings (tab at the right) at the default values provided by the manufacturer (Table 2).
| Meas. Light | Int. | Frequency | |
| 1 | 1 | ||
| Act. Light | Int. | Width | |
| 8 | 0 | ||
| Image Corrections | MINI | ||
| Image Transformation | Battery | ||
| 16.7V | |||
| Gain | 5 | ||
| Damping | 1 | ||
| Sat Pulse | Int. | No | Interval s |
| 8 | 1 | 30 | |
| Slow Induction | Delay s | Clock s | Duration s |
| 40 | 20 | 315 | |
| Absortivity | Red Gain | Red Intensity | NIR Intensity |
| 340 | 25 | 13 | |
| Display | Color | ||
| PS Limit | 50 | ||
| Inh. Ref. AOI | 1 | ||
| Fm Factor (tick) | 1,030 |
Table 2: Default Settings for the PAM measurements as provided by the manufacturer.
Apply a saturating light flash to perform a measurement of photosynthetic parameters by fluorescent quenching analysis (Saturation Pulse). Before that, determine the quenching coefficients by measuring the minimal and maximal fluorescence yield of a dark-adapted plant. To this end, place the plant in the dark (e.g. in a drawer or dark box) for a few min. Then place the plant under the camera head, check the boxes Measure and ML (measuring light), in the row below the image choose "Fv/Fm" by clocking into the circle, and click Fo,Fm at the bottom of the screen. NOTE: Fo/Fm represents the PSII yield of a dark-adapted plant. Thus, it is the value to which the measurement after applying light is normalized. The current Fo/Fm measurement will remain until New Record is activated. All F and Fm' values determined by Saturation Pulses are related to Fo/Fm and quenching parameters are calculated accordingly.
Find these results in the report tab and check all the boxes on the right hand side that are relevant to the experiment (e.g. Y(II), qP, qN, etc.).
Export the results to an analysis software e.g. Excel by clicking on export button in the upper left corner and save under appropriate file name. Generate at least five AOIs per leaf and measure several leaves of the same plant (do not forget to shortly dark adapt the plant again after each measurement), as well as several plants from one condition, which can then be statistically evaluated.
For statistical analysis generate mean values and standard deviations from all AOIs and at least three independent plants for all time points/conditions and perform a student's t-test to evaluate if the data are significant12. Data are evaluated as significantly different when the p-values are below 0.05.
4. Determination of Stomata Density
Collect three fully-expanded rosette leaves from three individual plants per condition into 70% ethanol in a glass petri dish and to extract chlorophyll. Incubate in this solvent overnight at room temperature or store at 4 °C.
For full clearance from pigments, incubate in chloral hydrate solution (chloral hydrate: water: glycerol = 8: 2: 1 w/v/w) until leaves appear completely white.
Take differential interference microscopy (DIC) images of the abaxial surface at 40X magnification. Count stomata in the field of vision and extrapolate with the help of the scale bar to stomata per mm². Repeat this procedure for at least 4 leaves per conditions. Perform statistical analysis by calculating the mean value for all leaves of one condition and from this calculate the mean error.
5. Determination of Fresh Weight
Remove all leaves including petioles from rosettes from six plants per condition with a razor blade. Weigh all leaves immediately and subject the data to statistical analyses as described above.
6. Determination of Rosette Leaf Area
Use pictures from eight plants per condition to analyze the leaf area graphically. Combine the pictures for one condition in a single image and save as *.jpeg or *.tiff.
Download the appropriate software (Materials Table). NOTE: It is, of course, possible to apply any other program capable of performing this task.
Open an image file. Choose the tool "free hand selection." Encircle leaves including petioles of one rosette. Click on "Analyze - set measurements" and check "Area," "Min & Max Gray value," "Integrated density," and "Mean Gray value." Choose appropriate decimal places, best is two or three and click "ok."
To obtain mm2 instead of pixels use the "set scale" command. Apply the straight-line selection tool to make a line selection that corresponds to a known distance, e.g. the leave diameter that is easy to calculate from the scale bar of the images, then open the Set Scale dialog and enter this defined distance and unit of measurement. Then go back to "analyze" and click "measure."
A new window appears entitled "results" which contains the relevant data for the current rosette. Repeat this procedure with all plants in the image and initialize area measurements for every new plant with Ctrl + M. NOTE: For smaller plants with non-overlapping leaves the "wand tool" can be used to make the process easier and faster. As soon as leaves start covering each other, this tool does not give reliable results.
Alternatively, cut off all leaves and position them in a way that an overview picture can be taken and then use the wand tool. Take into consideration that when using this method, more plants are needed.
Choose "File" -"Save as" in the results window and generate an appropriate file name and a location in the computer directory. The file will be automatically saved in Excel format.
7. Preparation of RNA
Harvest three samples from ten individual plants for every condition. Extract total RNA using a plant RNA extraction kit according to the manufacturer's instructions. Determine RNA concentration, purity, and integrity by using a bioanalyzer. RNA can then be used for downstream applications such as qRT-PCR or gene expression analysis by e.g. RNASeq13.
Representative Results
Observation and analysis of plant growth and especially phenotypes from mutant plants rely on stable and reproducible environmental conditions. These can be provided in climatic chambers. Light quantity and especially quality critically depends on the employed light source, which in this study was provided by LED lights.
Figure 1 shows an example of a climatic chamber equipped with LED panels. Figure 1A shows a screenshot of the control panel where all climatic and light conditions can be adjusted. Within 24 h twenty different time frames can be set. In this example, long day conditions with 16 light/8 h dark have been programmed. This chamber features four levels which can be separately programmed so that plant growth at four different light settings can be studied under exactly the same environmental conditions. The upper left level is set to a spectral output mimicking the sunlight as much as technically possible, the upper right level represents elevated red (660 nm) and blue light (440 nm) with reduced white light (3K). The left lower level was set to elevated blue light and the lower right level to predominantly red light. Figure 1B illustrates the LEDs at the different settings as an overview (middle panel) and the respective zoom-ins (outer small panels). The difference in light qualities can be easily seen by the eye.
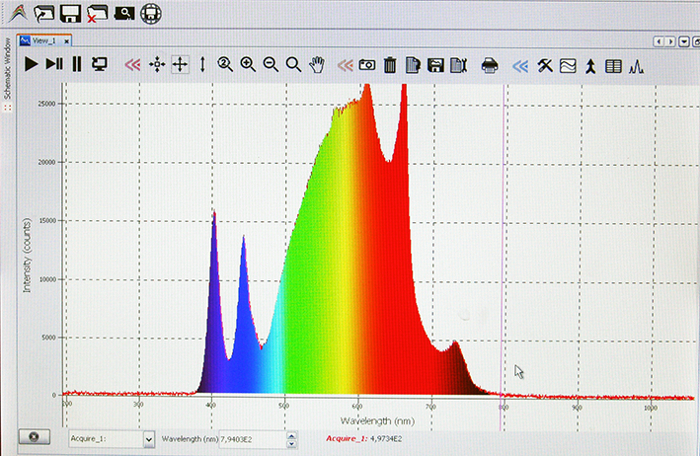
An inbuilt spectrometer constantly measures, monitors, and adjusts the spectral output. Figure 2 shows the spectrum from the upper left level 1.1, which was set to mimic sun light. Compared to a standard fluorescent light bulb the portion of UV and blue light is much higher7.
In Figure 3 an example of A. thaliana plants from all four conditions 10, 13, and 17 days, respectively, after sowing is depicted. All plants were photographed from the same distance by mounting the camera on a tripod. The scale bar represents 1 cm. After 10 days, not much difference in size or color can be discerned, but after 17 days a faster growth under red light is obvious. In addition to this visual analysis, several physiological analyses were performed.
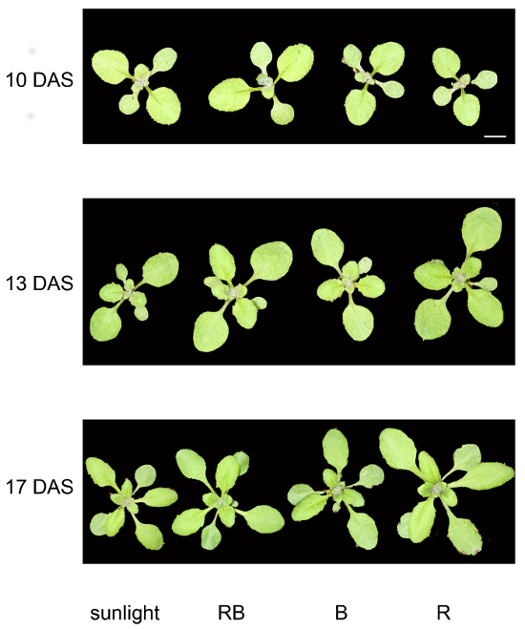
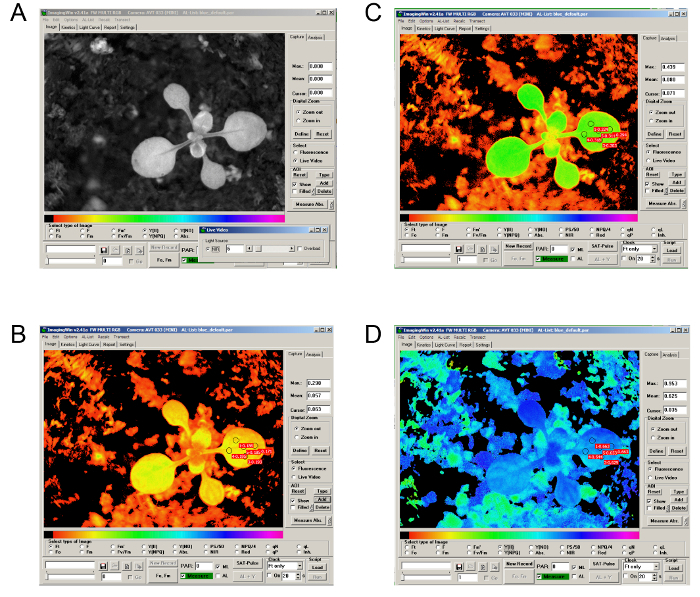
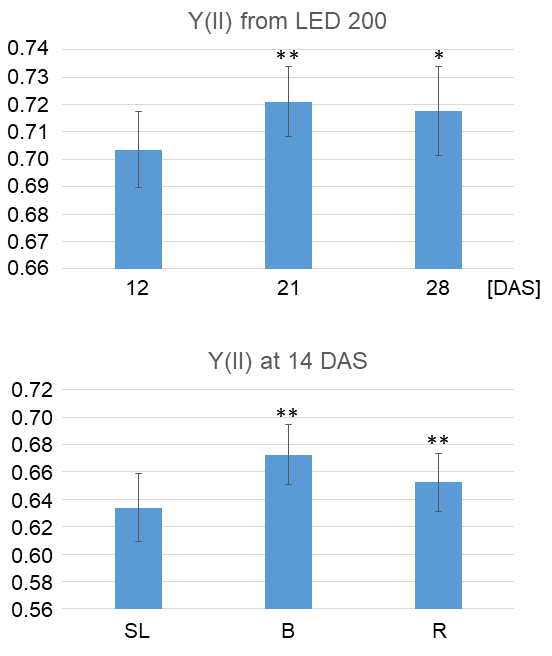
Figure 4 follows the different steps of PAM measurements, which analyses e.g. photosynthetic capacity. In Figure 4A a screenshot of the live video is shown, which is the setting for bringing the plant into focus to ensure optimal quality of the measurements. Instead of focusing on the whole plant, one can also choose a single leaf to analyze. Figure 4B demonstrates the current fluorescent yield Ft of a dark-adapted plant before the actual measurement was started. In this case, five circular areas of interest (AOIs) were chosen. The numbers in the red boxes beside each AOI directly gives the numerical result, which can also be saved in the form of a table. To initiate a measurement of photosynthetic parameters Fo,Fm needs to set. A screenshot of Ft after doing this is depicted in Figure 4C. Note that now the button "Fo,Fm" is not active anymore. To start a new measurement, "New Record" needs to be clicked to erase the previous normalization. Finally, Figure 4D shows the effective PSII quantum yield Y(II) after giving a saturating light pulse ("SAT-Pulse"). Quantification of exemplary data is shown in Figure 5. Plants grown under sunlight at 200 µM/cm2/s1 (Figure 5A) were analyzed 12, 21, and 28 days after sowing, respectively. Our data demonstrate that PSII yield is significantly higher in leaves from plants grown for three weeks than for 12 days. The difference between 28 and 12 days is still significant, but the p-value is higher. In Figure 4B, PSII yields from plants grown for two weeks from different light qualities were compared. Interestingly, permanent growth under light containing a high portion of blue light leads to a significantly greater yield of PSII. A similar effect was observed for plants cultivated under enriched red light, but the increase was a little lower.
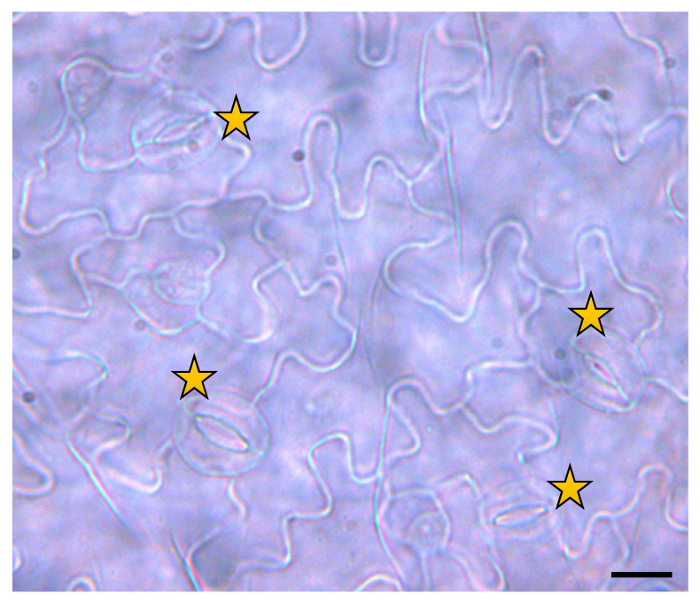
Different light qualities were shown to effect stomata development14. Therefore, the stomatal density was investigated. Figure 6 demonstrates how a leaf after pigment extraction looks. Single epidermal cells can be well distinguished, and stoma can be easily counted. In the figure, individual stomata are indicated by an asterisk. Detailed data about the stomatal density of plants from the different light settings can be found elsewhere9.
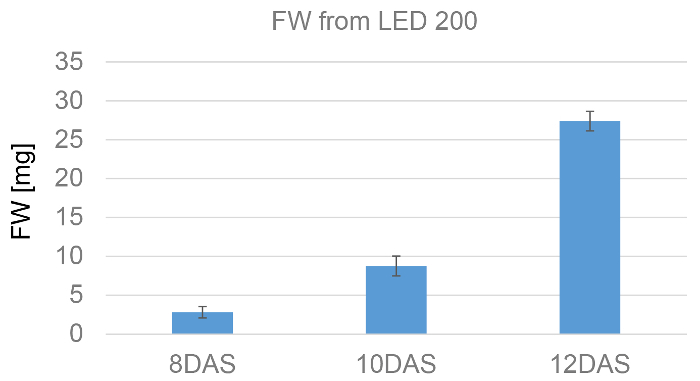
In addition to visual inspection (Figure 3) the fresh weight provides a good measure of the growth progress. In this example leaves from plants grown under "sunlight" after 8, 10, and 12 days after sowing, respectively, were weighed. Statistical evaluation of these data can be seen in Figure 7. As expected, the fresh weight increases with time.
Besides fresh weight, the leaf area is a good measure for growth. Here, plant development was followed from 10, 13, and 17 days after sowing (Figure 8A). At least six individual plants were routinely evaluated to obtain reliable statistical data. To demonstrate the importance of a high sample size, the percentage error of the mean value, from analyzing two and six plants, respectively, was calculated (Figure 8B). That means the percentage of the standard deviation with regard to the mean value was determined. It is very clear that in case of a small sample size the error is 5 - 10% higher than in the case of a higher sample size. By increasing the number of plants that are evaluated, the error can be minimized, which makes the interpretation of data much clearer.
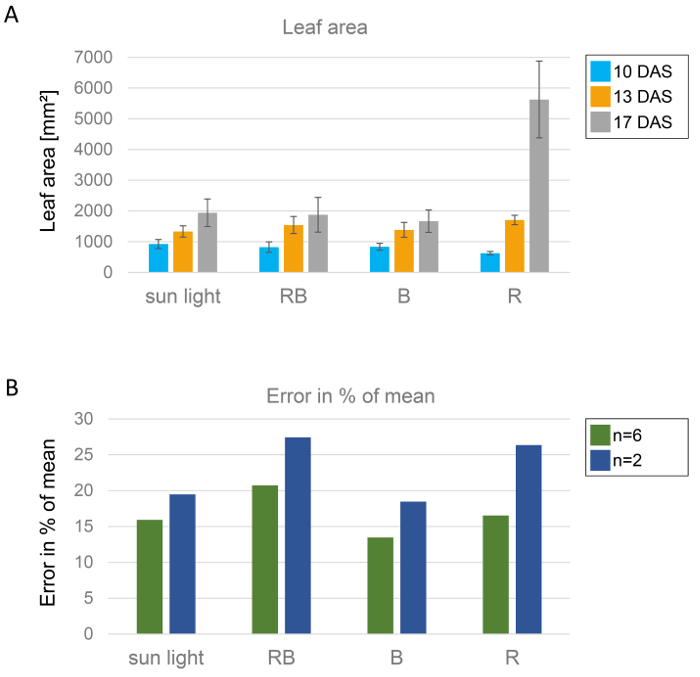
Figure 1: Different light qualities are provided by LEDs. A) Screenshot from the control panel of the LED chamber. Day length is set to 16 h (upper right corner) and the light intensity is set to 200 µmol cm-2 s-1. The light quality is different on all four levels: 1.1 represents a spectrum as similar to the sunlight as technically possible, 1.2 represents a high percentage of red and blue wavelengths (RB) light, 2.1 is predominantly set to Blue (B), 2.2 represents mainly red light (R). B) The middle panel shows an overview of all levels; the outer panels show the individual levels in a higher zoom. Please click here to view a larger version of this figure.
Figure 2: Wavelength spectrum from simulated sunlight settings. A screenshot from the inbuilt spectrometer in the LED chamber is shown, which was positioned at level 1.1. Please click here to view a larger version of this figure.
Figure 3: Plant development over a week. Representative A. thaliana plants from all four light conditions from 10, 13, and 17 DAS. Plants were photographed with a digital reflex camera on a tripod. Scale bar represents 1 cm for all images. Please click here to view a larger version of this figure.
Figure 4: Screenshots from representative steps of PAM measurements of A. thaliana plants.A) Screenshot from the "Live video" view where the image focus can be adjusted. B) Current fluorescence yield Ft before application of any light pulses. C) Current fluorescence yield Ft after setting of Fo/Fm. D) Effecting PSII quantum yield after setting a saturating light pulse. Please click here to view a larger version of this figure.
Figure 5: Graphical representation of Effecting PSII quantum yield (YII).A) Data from plants 12, 21, and 28 days after sowing and grown under 200 µmol/cm2/s1 under simulated sun light ("sunlight") subjected to PAM analysis were statistically evaluated. Shown are the mean values of five plants and five AOIs per day. One asterisk indicates a significant difference with a p-value <0.05 when compared to day 12, and two asterisks indicate very significant differences with a p-value <0.02 according to students' t-test. B) Data from plants grown at 200 µmol/cm2 /s1 under simulated sunlight (SL), enriched blue (B) or red (R) light, respectively, were statistically evaluated. Shown are the mean values of five plants and five AOIs per day. Significant differences were calculated in comparison to "sunlight."
Figure 6: Representative image of stomata at the abaxial side of an A. thaliana leaf. Leaves prepared as described above and were visually analyzed under a light microscope with DIC settings at 40X magnification. Stomata are counted in the visible area of at least 4 leaves per condition. The picture was taken with a digital camera connected to the microscope tubus. The number of stomata per mm² is calculated with help of the scale bar. Stars indicate a single stoma. The scale bar represents 200 µm. Please click here to view a larger version of this figure.
Figure 7: Graphical representation of fresh weight from A. thaliana plants grown at simulated sunlight/200 µmol/cm2/s1. Rosette leaves were cut from plants eight, ten, and twelve days after sowing. Mean values in mg from six plants per day are depicted. Please click here to view a larger version of this figure.
Figure 8: Statistical evaluation of A. thaliana leaf area from plants grown under different light conditions.A) Leaf area from A. thaliana grown for 10, 13, and 17 days was graphically determined with ImageJ and data from n = 6 plants were statistically evaluated. The leaf area from all six rosettes from each condition was summed up and divided by six to obtain the mean value. With this value, the standard deviation was calculated, and this is represented by the error bars. B) Leaf area was graphically determined with ImageJ and data from either n = 2 or n = 6 plants, respectively, were statistically analyzed as described for panel A. Then the error in percent of the mean value was calculated and depicted graphically. Green bars show the percent error from analysis of n = 6, blue bars from n = 2 plants. Please click here to view a larger version of this figure.
Discussion
The first step in studying plant growth is setting up the climatic chamber according to the desired conditions. This is easily done by typing all variables into the program mask of the respective software (Figure 1A). At this step, many modifications can be implemented by changing the light regime and/or temperature. Make sure to constantly monitor temperature, humidity, and light conditions (Figure 2) to prevent technical failure from ruining the experiment. This is a critical point for obtaining reproducible results. Though this set-up offers many variables and can be flexibly adjusted, it has its limitations. The currently available LED lights cannot mimic the sunlight a hundred percent and the climatic conditions inside a climatic chamber can never completely reflect what is going on outside15.
Compared to the widely used fluorescent bulbs LED lights are more versatile, need less energy, and show virtually no heat radiation. These advantages have led the large industry of indoor farming to equip climatic chambers and greenhouses with LEDs16. Considering the huge successes reported in this field, the LED technique will surely find many more applications.
When observing the phenotype and especially for determination of the leaf area it is important to take into account that in older plants leaves overlap (Figure 3). Thus, graphical evaluation of whole rosettes tends to be imprecise. In that case, it is much more accurate to cut off all leaves and go from there.
The evaluation of growth behavior and especially differences of growth and development under different conditions depends on a sufficient sample size. In this study, at least six plants were used for determination of e.g. photosynthetic yield (Figure 5), fresh weight (Figure 7), and leaf area (Figure 8A) but 30 individual seeds were planted at the start of the study to ensure that first, sufficient seeds germinate, and second, a choice of "typical" plants can be made. Even within the same population, i.e. plants in single pots in the same tray under the exact same conditions, showed varying phenotypes. This is then of course reflected in the standard deviation during statistical analysis, but the interpretation of data is generally more reliable when small statistical errors are observed (Figure 8B).
Measurement of photosynthetic performance by PAM (Figure 4, Figure 5) can be done for several parameters. In this case, the focus was on PSII yield Y(II) as an example but it is possible to also determine e.g. non-photochemical quenching, the quantum yield of regulated and non-regulated energy dissipation or light remission. Important here is to choose at least five AOIs per leaf evenly distributed across the leaf surface and then measure at least six leaves from different plants. The drawback of this method is that any effects on PSI cannot be detected; for that purpose, different equipment is needed.
Disclosures
The authors have nothing to disclose.
Acknowledgments
F.S. acknowledges support from Rhenac Green Tec AG through parts of this study. J.S. and B.B. received funding from the DFG (SFB TR175).
References
- Arabidopsis Genome Initiative. Analysis of the genome sequence of the flowering plant Arabidopsis thaliana. Nature. 2000;408(6814):796–815. doi: 10.1038/35048692. [DOI] [PubMed] [Google Scholar]
- An G, Watson BD, Chiang CC. Transformation of Tobacco, Tomato, Potato, and Arabidopsis thaliana Using a Binary Ti Vector System. Plant Physiology. 1986;81(1):301–305. doi: 10.1104/pp.81.1.301. [DOI] [PMC free article] [PubMed] [Google Scholar]
- Schiml S, Fauser F, Puchta H. In: Chromosome and Genomic Engineering in Plants: Methods and Protocols. Murata M, editor. New York, NY: Springer New York; 2016. pp. 111–122. [Google Scholar]
- Rivero L, et al. In: Arabidopsis Protocols. Sanchez-Serrano JJ, Salinas J, editors. Totowa, NJ: Humana Press; 2014. pp. 3–25. [Google Scholar]
- Ubbens JR, Stavness I. Deep Plant Phenomics: A Deep Learning Platform for Complex Plant Phenotyping Tasks. Frontiers in Plant Science. 2017;8(1190) doi: 10.3389/fpls.2017.01190. [DOI] [PMC free article] [PubMed] [Google Scholar]
- Cosgrove DJ. Rapid Suppression of Growth by Blue Light: OCCURRENCE, TIME COURSE, AND GENERAL CHARACTERISTICS. Plant Physiology. 1981;67(3):584–590. doi: 10.1104/pp.67.3.584. [DOI] [PMC free article] [PubMed] [Google Scholar]
- Seiler F, Soll J, Bölter B. Comparative Phenotypical and Molecular Analyses of Arabidopsis Grown under Fluorescent and LED Light. Plants. 2017;6(2):24. doi: 10.3390/plants6020024. [DOI] [PMC free article] [PubMed] [Google Scholar]
- Janda M, et al. Growth and stress response in Arabidopsis thaliana, Nicotiana benthamiana, Glycine max, Solanum tuberosum and Brassica napus cultivated under polychromatic LEDs. Plant Methods. 2015;11(1):31. doi: 10.1186/s13007-015-0076-4. [DOI] [PMC free article] [PubMed] [Google Scholar]
- Olle M, Viršile A. The effects of light-emitting diode lighting on greenhouse plant growth and quality. Agricultural and food science. 2013;22(2):12. [Google Scholar]
- Lin K-H, et al. The effects of red, blue, and white light-emitting diodes on the growth, development, and edible quality of hydroponically grown lettuce (Lactuca sativa L. var. capitata) Scientia Horticulturae. 2013;150:86–91. [Google Scholar]
- Castronuovo D, et al. Light spectrum affects growth and gas exchange of common dandelion and purple coneflower seedlings. International Journal of Plant Biology. 2016.
- Student THE PROBABLE ERROR OF A MEAN. Biometrika. 1908;6(1):1–25. [Google Scholar]
- Database JSE. Essentials of Genetics. RNA-Seq. JoVE. 2017.
- Klermund C, et al. LLM-Domain B-GATA Transcription Factors Promote Stomatal Development Downstream of Light Signaling Pathways in Arabidopsis thaliana Hypocotyls. The Plant Cell. 2016;28(3):646–660. doi: 10.1105/tpc.15.00783. [DOI] [PMC free article] [PubMed] [Google Scholar]
- Annunziata MG, et al. Getting back to nature: a reality check for experiments in controlled environments. J Exp Bot. 2017;68(16):4463–4477. doi: 10.1093/jxb/erx220. [DOI] [PMC free article] [PubMed] [Google Scholar]
- Palus S. Japan's Massive Indoor Farm Produces 10,000 Heads of Fresh Lettuce Every Day. Smithonian.com. 2014.


