

Abstract
Exosomes constitute an emerging biomarker for cancer diagnosis since they carry multiple proteins reflecting the origins of parent cells. Assessing exosome surface proteins provides a powerful means of identifying a combination of biomarkers for cancer diagnosis. We report a sensor platform that profiles exosome surface proteins in minutes by the naked eye. The sensor consists of a gold nanoparticle (AuNP) complexed with a panel of aptamers. The complexation of aptamers with AuNPs protects the nanoparticles from aggregating in a high salt solution. In the presence of exosomes, the non-specific and weaker binding between aptamers and the AuNP is broken, and the specific and stronger binding between exosome surface protein and the aptamer displaces aptamers from the AuNP surface and results in AuNP aggregation. This aggregation results in a color change of AuNP, and generate patterns for identification of multiple proteins on the exosome surface.
Keywords: aptamer, exosome biomarker, gold nanoparticle, molecular recognition, profiling
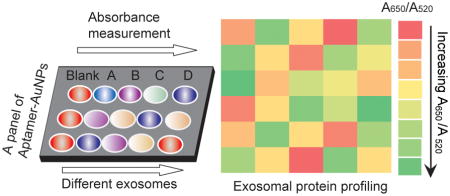
Graphical abstract
Exosomes are membrane-enclosed vesicles (30–100 nm in diameter) secreted by most cell types.[1] They carry molecular information of their parent cells, and they are enriched in membrane proteins and genetic materials for cell-cell communication.[2] For example, the protein patterns of response to metabolic or oxidative stress were shown to be identical between parent cancer cells and the exosomes they produced.[3] Notably, the exosome surface presents a quilt-like tapestry of protein markers, and a combination of such markers could best predict the origin of parent tumors.[4] Therefore, exosomes are emerging as noninvasive diagnostic biomarkers of cancer based on the profiling of their surface protein patterns.[5] However, analyzing exosome phenotype information, in particular, the subtle variations in protein patterns among different cell types, poses a formidable challenge by the lack of feasible and accurate profiling methods. Currently, mass spectrometry and immunoassays,[6] such as western blot and enzyme-linked immunosorbent assays (ELISA), can identify the most abundant exosomal proteins, but these approaches require laborious sample pretreatment, thus limiting their adoption for rapid exosome biomarker screening. Nanoplasmonic sensing provides a powerful tool for exosomal protein analyses; however, it requires specialized equipment and complicated analysis procedures.[7] In this context, a convenient and reliable method for exosome surface protein profiling is highly desired for cancer diagnosis.
Aptamers are short nucleic acids oligomers selected by a process termed systematic evolution of ligands by exponential enrichment (SELEX).[8] They are appealing alternatives to antibodies for targeted molecular recognition. In particular, these “chemical antibodies” exhibit excellent binding affinity and specificity toward cell-surface proteins.[9] This characteristic of specific recognition has been harnessed as a versatile platform to develop biosensing and molecular imaging tools in the physiological environment.[10] Inspired by these achievements, we hypothesized the generation of a predictive signature-based strategy based on the binding between aptamer and exosome surface protein, which constitutes the basis for profiling the subtle variations in exosome protein patterns among different cell types to collect phenotype information of cancers.
Herein we report a novel multiplexed sensor platform created through the assembly of a gold nanoparticle with a panel of aptamers targeting ubiquitous or putative exosome surface proteins. We demonstrate that complexation of aptamers with AuNPs protects them from aggregation in a high salt solution. However, in the presence of exosomes, the non-specific and weaker binding equilibrium between aptamers and the AuNP is broken, and the specific and stronger binding between exosome surface protein and the aptamer takes place, resulting in a rapid displacement of aptamers from the particle surface and consequent aggregation of AuNPs. Under these circumstances, the aggregation of AuNPs results in a color change from red to blue, which can be monitored by absorption spectroscopy. Depending on specific aptamer-exosome surface protein interaction, the aptamer/AuNPs can be detected both visually and quantitatively, in turn, generating patterns that allow identification of multiple proteins on different cancer cell exosomes (Figure 1).
Figure 1.
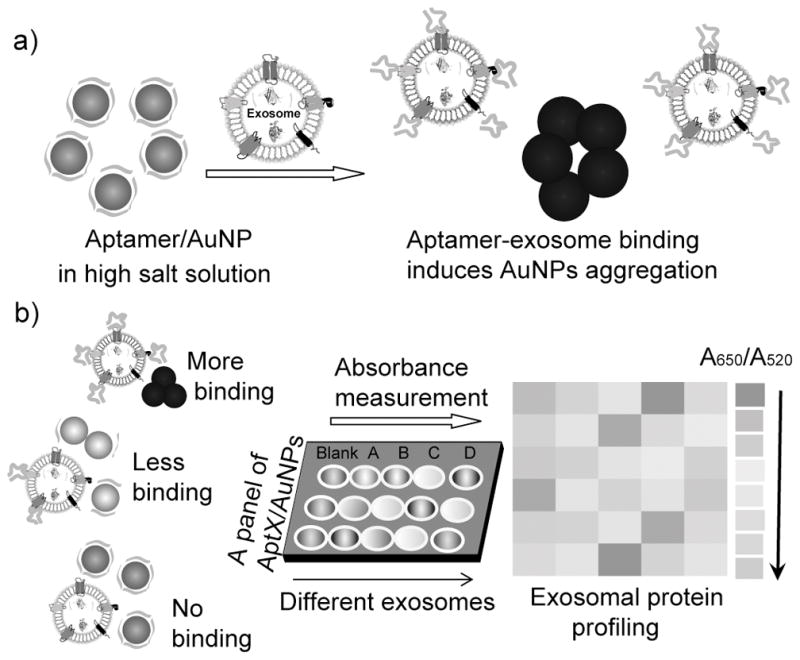
Working principle of the Aptamer/AuNP complex for molecular profiling of exosomal proteins. a) Schematic illustrating the displacement of aptamers from gold nanoparticles by binding with exosome surface protein and the concomitant aggregation of gold nanoparticles. b) Profiling of different exosome surface proteins with the Aptamer/AuNP complex.
The sensor was designed by the noncovalent conjugation of 13-nm AuNPs with a panel of five aptamers previously demonstrated to target cell-surface proteins with high specificity and affinity (Figure 1).[11] The aptamers can bind exosome surface proteins and induce the aggregation of AuNPs for exosomal protein profiling. It is well known that AuNPs show a red-to-blue color change in response to a dispersion-to-aggregation state change,[12] while single-strand DNA (ssDNA) can prevent AuNPs from salt-induced aggregation by noncovalent AuNP-DNA complexation.[13] Controllable ssDNA (aptamer)/AuNP interaction has previously been explored for protein detection[14] and cancer cell discrimination.[15] In this study, the competitive binding between aptamers and exosomes displaces aptamers from AuNPs, resulting in nanoparticle aggregation. The red-to-blue color change of AuNPs indicates the corresponding binding events between aptamers and exosomal proteins, while the intensity of AuNPs aggregation (A650/A520) reflects the relative abundance of target proteins present on the exosome surfaces (Figure 1). Therefore, by strategically selecting aptamers that interact with exosomal proteins, and comparing the binding of aptamers with AuNPs in the presence of different exosomes, we are able to generate predictive signature-based exosomal protein patterns for potential cancer diagnosis.
We initially demonstrated the ability of the Aptamer/AuNP platform to detect well-characterized exosome-enriched proteins. As a proof-of-concept, CD63, which is ubiquitously present on most cellular exosomes,[16] was selected as our model target. To accomplish this, 13-nm citrate-coated AuNPs were first synthesized and characterized by transmission electron microscopy (TEM) (Figure S1). An aptamer targeting CD63 (hereinafter termed as AptCD63) was modified with hexaethylene glycol (Table S1) to increase the biocompatibility of the aptamer and to avoid its potential nonspecific binding with biomacromolecules at high concentration. Exosomes derived from human cervical carcinoma (HeLa) cells were isolated by ultracentrifugation methods according to previous reports and further characterized by TEM (Figure S2) before use.[17] TEM analysis of the HeLa exosomes showed an average diameter of 80 nm, which is consistent with previous reports (Figure S2).
As shown in Figure 2a, AptCD63 (79 nM) or DNA with a random sequence (Library DNA or Lib, 79 nM) protects AuNPs (7.9 nM) from aggregation in the presence of 38 mM NaCl, as evidenced by the minimal color change of AuNPs (the 3rd and 6th tubes, respectively). However, the simultaneous addition of AptCD63 and HeLa exosomes (7 μg/mL) to AuNPs suspension led to the aggregation of AuNPs and the change of color from red to blue in the presence of NaCl (5th tube). The aggregation of AuNPs was also confirmed by UV-Vis spectra of the AuNP solution (purple triangles, Figure 2b), which showed an increased absorption at 650 nm. Meanwhile, the addition of exosomes alone to AuNPs had minimal effect on the dispersal of AuNPs (1st tube). Moreover, the replacement of AptCD63 with Lib DNA did not induce significant aggregation or color change of AuNPs (4th tube). These observations confirmed the presence of CD63 on the HeLa cell exosome surface and revealed that the specific interaction between AptCD63 and exosomal CD63 was sufficient to reduce the absorption of aptamer by AuNPs, resulting in the aggregation of AuNPs for exosome surface protein detection.
Figure 2.
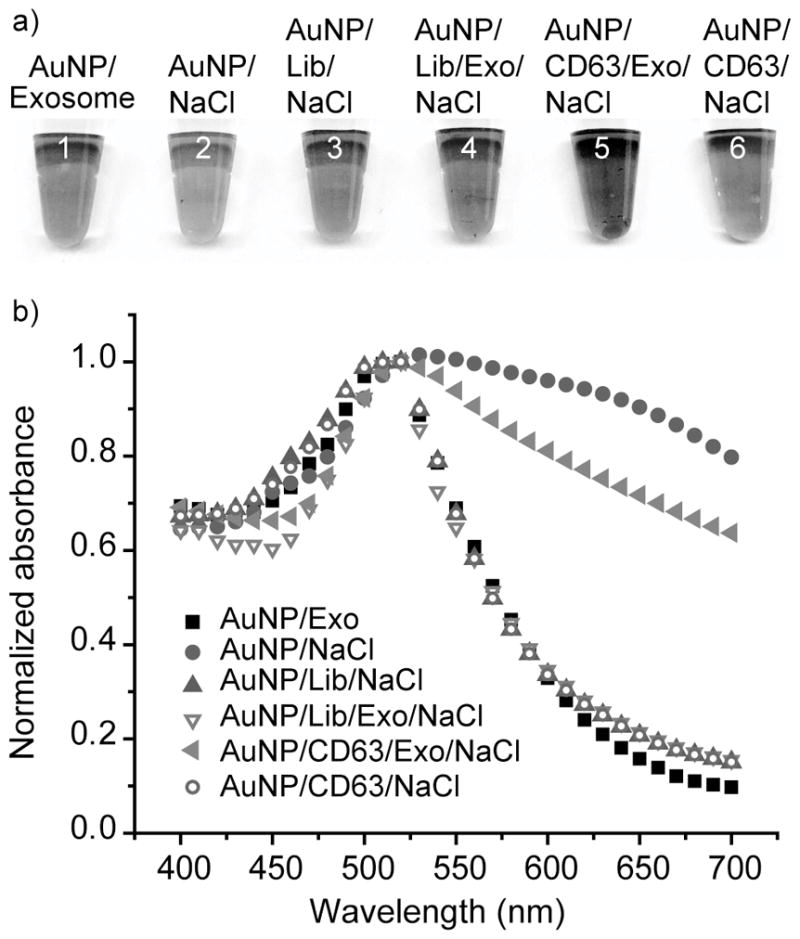
Aptamer-exosome interaction induces the aggregation of gold nanoparticles. a) Direct observation of the color change of AuNP and b) The absorbance change of AuNP (7.9 nM) with the addition of HeLa exosome (1st tube, black squares), NaCl (2nd tube, red circles), Lib/NaCl (3rd tube, blue triangles), Lib/Exo/NaCl (4th tube, pink triangles), CD63/Exo/NaCl (5th tube, purple triangles), and CD63/NaCl (6th tube, violet circles). For all studies, AuNP was mixed with Lib, CD63, and Exo for 20 min before recording its absorbance intensity. AuNP absorption at 520 nm was normalized to 1. Exo, HeLa exosomes. Lib, Library DNA. CD63, aptamer targeting CD63.
Having demonstrated the ability of the AptCD63/AuNP conjugate to detect exosomal CD63 by colorimetric assay, we next studied whether the AptCD63/AuNP conjugate could distinguish the subtle changes of CD63 level on different cancer cell exosomes. As shown in previous studies,[16] CD63 is present on different exosomes. These exosomes may show binding toward the same aptamer, but with different affinities, depending on their level of CD63 production. A reliable method able to analyze various cancer exosomes can lead to the development of an exosomal protein profiling and thus a better understanding of the exosomes’ origin. To this end, three additional exosomes secreted from PC-3 (human prostate cancer), Ramos (human acute lymphoblastic leukemia), and CEM (human acute lymphoblastic leukemia) cells were collected and characterized (Figure S2), and the presence of CD63 on these exosomes was verified and compared using AptCD63/AuNP. As shown in Figure 3a to 3d, the addition of HeLa and PC-3 exosomes to the AptCD63/AuNP suspension resulted in a similar trend of AuNP aggregation at all concentration ranges tested (ranging from 0 to 12.8 μg/mL). CEM and Ramos exosomes, however, induced less aggregation of AuNPs. In particular, Ramos exosomes displayed the weakest ability to induce AuNPs aggregation. These observations suggest the most abundant presence of CD63 on HeLa and PC-3 exosomes, with a medium level of CD63 on CEM exosomes, and the smallest level of CD63 on Ramos exosomes. As exosomes usually carry the molecular information of their parent cells, the observed exosomal CD63 level may reflect the different protein pattern of their parent cells, allowing non-invasive classification and identification of cancer cells at the molecular level.
Figure 3.

Aptamer/AuNP sensor verifies the ubiquitous exosomal presence of CD63 protein and confirms the specific exosomal production of PTK7 on CEM exosomes but not Ramos exosomes. Analyses of CD63 presence on a) HeLa exosomes, b) PC-3 exosomes, c) CEM exosomes, and d) Ramos exosomes using AuNP/AptCD63. Analyses of PTK7 presence on e) CEM exosomes, and f) Ramos exosomes using AuNP/AptPTK7. All measurements were performed in triplicate, and the data are displayed as mean values.
Having compared the presence of the aforementioned ubiquitous exosomal marker in exosomes, we next explored whether the Aptamer/AuNP conjugate could identify exosomal proteins that are restricted to a certain cell line. For example, protein tyrosine kinase-7 (PTK7) is overproduced in CEM cells but not Ramos cells, while its association with their respective exosomes remains unclear.[18] To examine whether PTK7 is specifically enriched on CEM cell exosomes, we first incubated AptPTK7 with AuNPs, followed by separately adding CEM and Ramos exosomes in the presence of NaCl (38 mM). As shown in Figure S3, the addition of CEM exosomes but not Ramos exosomes, resulted in an obvious aggregation of AuNPs. With increasing concentration of CEM exosomes, the absorbance ratio (A650/A520) of AuNP (Figure 3e) showed a linear increase. In contrast, no significant change of A650/A520 was observed for AuNP/AptPTK7 complex added with Ramos exosomes (Figure 3f), suggesting PTK7 was present on CEM exosomes, but negligibly present on Ramos exosomes. These findings are consistent with the PTK7 production profile in parent cells,[11,19] highlighting the substantial ability of the Aptamer/AuNP conjugate to profile specific exosome surface proteins and relate them to the parent tumors.
Since a single type of the aptamer/AuNP complex can differentiate the subtle variation of a specific exosomal protein, we envisioned that using a panel of aptamer/protein interactions, would allow us to create a pattern of exosomal proteins, serving as a comprehensive reference for predicting exosome origin and increasing the accuracy of using exosomes for cancer diagnosis. To test this hypothesis, we studied and compared the interaction of AuNPs with AptCD63, AptEpCAM, AptPDGF, AptPSMA, and AptPTK7 in the presence of different exosomes. A Lib DNA with a random sequence was used to replace the aptamer and served as a negative control. This set of aptamers was selected to target (i) ubiquitous markers present on exosomes (e.g., CD63) and (ii) markers either absent or present on exosomes of specific cancer cell types (e.g., Prostate-Specific Membrane Antigen or PSMA, PTK7).[20] We also selected aptamer target proteins that had not been fully verified on cancer exosomes, e.g., Platelet-derived growth factor (PDGF) and Epithelial cell adhesion molecule (EpCAM).[21] In this study, four different cancer exosomes with the same concentration (6.4 ug/mL) were added into each Aptamer/AuNP suspension (7.9 nM / 79 nM). The change of AuNP absorption (Figure 4a to 4d) and the ratio of A650/A520 for each aptamer/exosome combination were summarized and presented as a heat map, as shown in Figure 4e. It is obvious that CD63 is present at high levels on HeLa, PC-3, and CEM exosomes, as indicated by the high intensity of AptCD63/AuNP aggregation in the presence of these exosomes.
Figure 4.

Molecular profiling of exosomal proteins using Aptamer/AuNP sensor. Levels of 5 cancer protein markers, including CD63 (red circles), EpCAM (blue triangles), PDGF (blue green triangles), PSMA (magenta triangles), and PTK7 (green yellow triangles) were profiled on a) HeLa, b) PC-3, c) CEM, and d) Ramos exosomes. AuNPs complexed with Lib DNA (black squares) were used as control. Gold nanoparticle absorption at 520 nm was normalized to 1. e) Levels of 5 protein markers were determined using A650/A520 and the data are represented as a heat map highlighting the profiling and comparison of exosomal proteins on each exosome.
Substitution of AptCD63 with the panel of aptamers resulted in noticeable AuNP aggregation patterns for exosome protein profiling. For example, AptPSMA/AuNP showed negligible response after the addition of PC-3 exosomes, indicating the low presence and, hence, low production of PSMA in PC-3 cells.[22] In addition, most cancer exosomes showed moderate EpCAM level with Ramos cells as an exception. Furthermore, CEM exosomes showed a much higher level of PTK7 than that of Ramos exosomes, which is consistent with the above finding (Figure 2e and 2f). Surprisingly, none of the four cancer exosomes showed sufficient binding with AptPDGF, indicating the lack, or very low presence, of PDGF on cancer cell exosome surfaces. The as-generated distinct pattern of responses from a set of AptX/AuNPs in the presence of various cancer cell exosomes enables the profiling and comparison of exosomal proteins associated with a particular cancer type and its parent tumor.
Compared to traditional screening methods that use genomic,[23] transcriptional,[24] and proteomic signatures[25] to characterize exosomal proteins and require specialized equipment and extensive sample purification, the AptX/AuNPs colorimetric sensor platform, as herein demonstrated, can differentiate various exosomal proteins in minutes. In particular, the utilization of the array of AptX/AuNPs allows detection visually as well as quantitatively (by A650/A520 ratio) for enhanced accuracy. Moreover, these information-rich results allow the generation of a distinct pattern for multiple types of cancer exosomes from a single measurement, making it widely and economically accessible for clinical use. The simplicity and effectiveness of the system underscores its potential to accelerate cancer biomarker discovery and ultimately to allow non-invasive early diagnosis of cancers.
In summary, we have demonstrated a colorimetric tool to capture and profile exosomal protein information in a simple manner. This sensor takes advantage of the dual nature of aptamers as recognition moieties and protectors of AuNPs from aggregation. We showed that AptX/AuNPs could differentiate and profile subtle exosome surface protein differences in minutes, making this strategy applicable to massive high-throughput screening, especially in the analysis of clinical specimens for point-of-care detection. In addition, with the ability to precisely identify the exosome protein pattern, the AptX/AuNPs platform opens the door to better understanding of cancer development, offering the possibility for early detection of cancer and help in designing potential curative options.
Supplementary Material
Acknowledgments
The authors are grateful to Dr. K. R. Williams for useful discussion. This work is supported by grants awarded by the National Institutes of Health (GM079359 and CA133086). It is also supported by the National Key Scientific Program of China (2011CB911000), NSFC grants (NSFC 21221003 and NSFC 21327009).
Footnotes
Supporting information for this article is given via a link at the end of the document.
References
- 1.a) Gyorgy B, Szabo TG, Pasztoi M, Pal Z, Misjak P, Aradi B, Laszlo V, Pallinger E, Pap E, Kittel A, Nagy G, Falus A, Buzas EI. Cell Mol Life Sci. 2011;68:2667–2688. doi: 10.1007/s00018-011-0689-3. [DOI] [PMC free article] [PubMed] [Google Scholar]; b) Théry C, Ostrowski M, Segura E. Nat Rev Immunol. 2009;9:581–593. doi: 10.1038/nri2567. [DOI] [PubMed] [Google Scholar]
- 2.a) Kooijmans SAA, Vader P, van Dommelen SM, van Solinge WW, Schiffelers RM. Int J Nanomedicine. 2012;7:1525–1541. doi: 10.2147/IJN.S29661. [DOI] [PMC free article] [PubMed] [Google Scholar]; b) Pisitkun T, Shen RF, Knepper MA. Proc Natl Acad Sci U S A. 2004;101:13368–13374. doi: 10.1073/pnas.0403453101. [DOI] [PMC free article] [PubMed] [Google Scholar]
- 3.a) Park JE, Tan HS, Datta A, Lai RC, Zhang H, Meng W, Lim SK, Sze SK. Mol Cell Proteomics. 2010;9:1085–1099. doi: 10.1074/mcp.M900381-MCP200. [DOI] [PMC free article] [PubMed] [Google Scholar]; b) Khan S, Jutzy JM, Aspe JR, McGregor DW, Neidigh JW, Wall NR. Apoptosis. 2011;16:1–12. doi: 10.1007/s10495-010-0534-4. [DOI] [PMC free article] [PubMed] [Google Scholar]
- 4.a) Vlassov AV, Magdaleno S, Setterquist R, Conrad R. Biochim Biophys Acta. 2012;1820:940–948. doi: 10.1016/j.bbagen.2012.03.017. [DOI] [PubMed] [Google Scholar]; b) Raimondo F, Morosi L, Chinello C, Magni F, Pitto M. Proteomics. 2011;11:709–720. doi: 10.1002/pmic.201000422. [DOI] [PubMed] [Google Scholar]
- 5.a) Melo SA, Luecke LB, Kahlert C, Fernandez AF, Gammon ST, Kaye J, LeBleu VS, Mittendorf EA, Weitz J, Rahbari N, Reissfelder C, Pilarsky C, Fraga MF, Piwnica-Worms D, Kalluri R. Nature. 2015;523:177–182. doi: 10.1038/nature14581. [DOI] [PMC free article] [PubMed] [Google Scholar]; b) Yoshioka Y, Kosaka N, Konishi Y, Ohta H, Okamoto H, Sonoda H, Nonaka R, Yamamoto H, Ishii H, Mori M, Furuta K, Nakajima T, Hayashi H, Sugisaki H, Higashimoto H, Kato T, Takeshita F, Ochiya T. Nat Commun. 2014;5:3591. doi: 10.1038/ncomms4591. [DOI] [PMC free article] [PubMed] [Google Scholar]; c) Shao H, Chung J, Balaj L, Charest A, Bigner DD, Carter BS, Hochberg FH, Breakefield XO, Weissleder R, Lee H. Nat Med. 2012;18:1835–1840. doi: 10.1038/nm.2994. [DOI] [PMC free article] [PubMed] [Google Scholar]
- 6.a) Hosseini-Beheshti E, Pham S, Adomat H, Li N, Tomlinson ES. Guns, Mol Cell Proteomics. 2012;11:863–885. doi: 10.1074/mcp.M111.014845. [DOI] [PMC free article] [PubMed] [Google Scholar]; b) Graner MW, Alzate O, Dechkovskaia AM, Keene JD, Sampson JH, Mitchell DA, Bigner DD. FASEB J. 2009;23:1541–1557. doi: 10.1096/fj.08-122184. [DOI] [PMC free article] [PubMed] [Google Scholar]
- 7.Im H, Shao H, Park YI, Peterson VM, Castro CM, Weissleder R, Lee H. Nat Biotechnol. 2014;32:490–495. doi: 10.1038/nbt.2886. [DOI] [PMC free article] [PubMed] [Google Scholar]
- 8.a) Zhou J, Rossi J. Nat Rev Drug Discov. 2016 doi: 10.1038/nrd.2016.199. [DOI] [Google Scholar]; b) Liang H, Zhang XB, Lv Y, Gong L, Wang R, Zhu X, Yang R, Tan W. Acc Chem Res. 2014;47:1891–1901. doi: 10.1021/ar500078f. [DOI] [PMC free article] [PubMed] [Google Scholar]; c) Tuerk C, Gold L. Science. 1990;249:505–510. doi: 10.1126/science.2200121. [DOI] [PubMed] [Google Scholar]
- 9.a) Zhang L, Yang Z, Le Trinh T, Teng IT, Wang S, Bradley KM, Hoshika S, Wu Q, Cansiz S, Rowold DJ, McLendon C, Kim MS, Wu Y, Cui C, Liu Y, Hou W, Stewart K, Wan S, Liu C, Benner SA, Tan W. Angew Chem Int Ed. 2016;5:12372–12375. doi: 10.1002/anie.201605058. [DOI] [PMC free article] [PubMed] [Google Scholar]; Angew Chem. 2016;128:12560–12563. [Google Scholar]; b) Xiao Z, Shangguan D, Cao Z, Fang X, Tan W. Chemistry. 2008;14:1769–1775. doi: 10.1002/chem.200701330. [DOI] [PubMed] [Google Scholar]
- 10.a) Wu C, Chen T, Han D, You M, Peng L, Cansiz S, Zhu G, Li C, Xiong X, Jimenez E, Yang CJ, Tan W. ACS Nano. 2013;7:5724–5731. doi: 10.1021/nn402517v. [DOI] [PMC free article] [PubMed] [Google Scholar]; b) Meng HM, Fu T, Zhang XB, Tan W. Natl Sci Rev. 2015;2:71. [Google Scholar]; c) Wang S, Zhang L, Wan S, Cansiz S, Cui C, Liu Y, Cai R, Hong C, Teng IT, Shi M, Wu Y, Dong Y, Tan W. ACS Nano. 2017;11:3943–3949. doi: 10.1021/acsnano.7b00373. [DOI] [PMC free article] [PubMed] [Google Scholar]; d) Wan S, Zhang L, Wang S, Liu Y, Wu C, Cui C, Sun H, Shi M, Jiang Y, Li L, Qiu L, Tan W. J Am Chem Soc. 2017;139:5289–5292. doi: 10.1021/jacs.7b00319. [DOI] [PMC free article] [PubMed] [Google Scholar]
- 11.a) Shangguan D, Cao Z, Meng L, Mallikaratchy P, Sefah K, Wang H, Li Y, Tan W. J Proteome Res. 2008;7:2133–2139. doi: 10.1021/pr700894d. [DOI] [PMC free article] [PubMed] [Google Scholar]; b) Zhou J, Rossi JJ. Oligonucleotides. 2011;21:1–10. doi: 10.1089/oli.2010.0264. [DOI] [PMC free article] [PubMed] [Google Scholar]; c) Fang X, Sen A, Vicens M, Tan W. ChemBioChem. 2003;4:829–834. doi: 10.1002/cbic.200300615. [DOI] [PubMed] [Google Scholar]; d) Zhou Q, Rahimian A, Son K, Shin DS, Patel T, Revzin A. Methods. 2016;97:88–93. doi: 10.1016/j.ymeth.2015.10.012. [DOI] [PubMed] [Google Scholar]; (e) Song Y, Zhu Z, An Y, Zhang W, Zhang H, Liu D, Yu C, Duan W, Yang CJ. Anal Chem. 2013;85:4141–4149. doi: 10.1021/ac400366b. [DOI] [PubMed] [Google Scholar]
- 12.a) Jiang Y, Zhao H, Zhu N, Lin Y, Yu P, Mao L. Angew Chem Int Ed. 2008;47:8601–8604. doi: 10.1002/anie.200804066. [DOI] [PubMed] [Google Scholar]; Angew Chem. 2008;120:8729–8732. [Google Scholar]; b) Rosi NL, Mirkin CA. Chem Rev. 2005;105:1547–1562. doi: 10.1021/cr030067f. [DOI] [PubMed] [Google Scholar]; c) Daniel MC, Astruc D. Chem Rev. 2004;104:293–346. doi: 10.1021/cr030698+. [DOI] [PubMed] [Google Scholar]
- 13.a) Jiang Y, Zhao H, Lin Y, Zhu N, Ma Y, Mao L. Angew Chem Int Ed. 2010;49:4800–4804. doi: 10.1002/anie.201001057. [DOI] [PubMed] [Google Scholar]; Angew Chem. 2010;122:4910–4914. [Google Scholar]; b) Li H, Rothberg L. Proc Natl Acad Sci USA. 2004;101:14036–14039. doi: 10.1073/pnas.0406115101. [DOI] [PMC free article] [PubMed] [Google Scholar]
- 14.Wei H, Li B, Li J, Wang E, Dong S. Chem Commun. 2007;36:3735–3713. doi: 10.1039/b707642h. [DOI] [PubMed] [Google Scholar]
- 15.a) Medley CD, Bamrungsap S, Tan W, Smith JE. Anal Chem. 2011;83:727–734. doi: 10.1021/ac102263v. [DOI] [PMC free article] [PubMed] [Google Scholar]; b) Medley CD, Smith JE, Tang Z, Wu Y, Bamrungsap S, Tan W. Anal Chem. 2008;80:1067–1072. doi: 10.1021/ac702037y. [DOI] [PubMed] [Google Scholar]; c) Lu Y, Liu Y, Zhang S, Wang S, Zhang S, Zhang X. Anal Chem. 2013;85:6571–6574. doi: 10.1021/ac4014594. [DOI] [PubMed] [Google Scholar]
- 16.Raposo G, Stoorvogel W. J Cell Biol. 2013;200:373–383. doi: 10.1083/jcb.201211138. [DOI] [PMC free article] [PubMed] [Google Scholar]; b) Thery C, Zitvogel L, Amigorena S. Nat Rev Immunol. 2002;2:569–579. doi: 10.1038/nri855. [DOI] [PubMed] [Google Scholar]
- 17.a) Simpson RJ, Jensen SS, Lim JW. Proteomics. 2008;11:4083–4087. doi: 10.1002/pmic.200800109. [DOI] [PubMed] [Google Scholar]; b) Shtam TA, Kovalev RA, Varfolomeeva EY, Makarov EM, Kil YV, Filatov MV. Cell Commun Signal. 2013;11:88. doi: 10.1186/1478-811X-11-88. [DOI] [PMC free article] [PubMed] [Google Scholar]
- 18.Zhao W, Cui CH, Bose S, Guo D, Shen C, Wong WP, Halvorsen K, Farokhzad OC, Teo GS, Phillips JA, Dorfman DM, Karnik R, Karp JM. Proc Natl Acad Sci U S A. 2012;109:19626–19631. doi: 10.1073/pnas.1211234109. [DOI] [PMC free article] [PubMed] [Google Scholar]
- 19.Chen Y, Munteanu AC, Huang YF, Phillips J, Zhu Z, Mavros M, Tan W. Chemistry. 2009;15:5327–5336. doi: 10.1002/chem.200802305. [DOI] [PMC free article] [PubMed] [Google Scholar]
- 20.Wang Y, Luo Y, Bing T, Chen Z, Lu M, Zhang N, Shangguan D, Gao X. PLoS One. 2014;9:e100243. doi: 10.1371/journal.pone.0100243. [DOI] [PMC free article] [PubMed] [Google Scholar]
- 21.a) Zhao W, Schafer S, Choi J, Yamanaka YJ, Lombardi ML, Bose S, Carlson AL, Phillips JA, Teo W, Droujinine IA, Cui CH, Jain RK, Lammerding J, Love JC, Lin CP, Sarkar D, Karnik R, Karp JM. Nat Nanotechnol. 2011;6:524–531. doi: 10.1038/nnano.2011.101. [DOI] [PMC free article] [PubMed] [Google Scholar]; b) Runz S, Keller S, Rupp C, Stoeck A, Issa Y, Koensgen D, Mustea A, Sehouli J, Kristiansen G, Altevogt P. Gynecol Oncol. 2007;107:563–571. doi: 10.1016/j.ygyno.2007.08.064. [DOI] [PubMed] [Google Scholar]
- 22.Ghosh A, Wang X, Klein E, Heston WD. Cancer Res. 2005;65:727–731. [PubMed] [Google Scholar]
- 23.a) Greenberg SA. Curr Opin Rheumatol. 2007;19:536–541. doi: 10.1097/BOR.0b013e3282efe261. [DOI] [PubMed] [Google Scholar]; (b) Tian L, Greenberg SA, Kong SW, Altschuler J, Kohane IS, Park PJ. Proc Natl Acad Sci USA. 2005;102:13544–13549. doi: 10.1073/pnas.0506577102. [DOI] [PMC free article] [PubMed] [Google Scholar]
- 24.a) Levy H, Wang X, Kaldunski M, Jia S, Kramer J, Pavletich SJ, Reske M, Gessel T, Yassai M, Quasney MW, Dahmer MK, Gorski J, Hessner MJ. Genes Immun. 2012;13:593–604. doi: 10.1038/gene.2012.41. [DOI] [PMC free article] [PubMed] [Google Scholar]; b) Thomas MC, Chiang CM. Crit Rev Biochem Mol Biol. 2006;41:105–178. doi: 10.1080/10409230600648736. [DOI] [PubMed] [Google Scholar]
- 25.a) Webber J, Stone TC, Katilius E, Smith BC, Gordon B, Mason MD, Tabi Z, Brewis IA, Clayton A. Mol Cell Proteomics. 2014;13:1050–1064. doi: 10.1074/mcp.M113.032136. [DOI] [PMC free article] [PubMed] [Google Scholar]; b) Sandvig K, Llorente A. Mol Cell Proteomics. 2012;11:M111.012914. doi: 10.1074/mcp.M111.012914. [DOI] [PMC free article] [PubMed] [Google Scholar]; c) Rifai N, Gillette MA, Carr SA. Nat Biotechnol. 2006;24:971–983. doi: 10.1038/nbt1235. [DOI] [PubMed] [Google Scholar]
Associated Data
This section collects any data citations, data availability statements, or supplementary materials included in this article.