

Summary
Tremendous progress has been made since Neuron published our primer on genetic dissection of neural circuits ten years ago. Since then, cell type-specific anatomical, neurophysiological, and perturbation studies have been carried out in a multitude of invertebrate and vertebrate organisms, linking neurons and circuits to behavioral functions. New methods allow systematic classification of cell types, and provide genetic access to diverse neuronal types for studies of connectivity and neural coding during behavior. Here we evaluate key advances over the past decade and discuss future directions.
1. Introduction
Genetic analysis has been instrumental in deciphering the logic of gene networks that underlie complex biological processes ranging from cell division cycles to development of multicellular organisms. In genetic analysis, individual genes are the unit of operation for expression studies and for loss- or gain-of-function manipulations. A conceptually similar strategy has been adopted for understanding neural circuits (Luo et al., 2008). Targeting individual neuron types as the unit of operation, it is possible to study their anatomical connections, electrical signals, and silence or activate neuron types, all with the goal to reveal the neural circuit basis of behavior.
Compared with traditional anatomical, neurophysiological, and perturbation studies, this genetic strategy has key advantages. Since experiments are performed on defined cell types, they are readily integrated and compared across paradigms and different laboratories, and even between different species with analogous cell types. In part due to rapid technical advances that facilitate cell type-specific analysis, thousands of studies in the past decade have linked neurons, neural circuit function, and organismal behavior in many animal species. Here we provide a critical evaluation of key advances in the past decade and discuss future directions. Because of the large scope of the subject, we refer readers to recent reviews on specific topics and draw examples close to our areas of expertise, but the concepts and techniques are generally applicable to neural circuit analysis.
2. Genetic Targeting of Cell Types
2a: What is a neuronal cell type?
Neuronal cell types reflect a collection of parameters including cell body location, dendritic morphology, axonal projection, physiological characteristics, developmental history, gene expression pattern, and function. Ideally these interdependent parameters should define a unique entity. Although a unanimous and categorical definition of cell type is still lacking in many parts of the nervous system, great strides have recently been made.
An important advance is the development of single-cell RNA sequencing techniques (Tang et al., 2009; Islam et al., 2011; reviewed in Grun and van Oudenaarden, 2015), where messenger RNAs expressed by individual cells can be quantified at the scale of the entire transcriptome (collection of all expressed mRNAs). Single cells—either hand-picked or sorted from a dissociated cell suspension using fluorescence-activated cell sorting or microfluidic devices—are placed into individual wells for parallel cell lysis, cDNA library preparation and barcoding, followed by high-throughput sequencing. The end result is the identity and numbers of mRNA species that are expressed in each cell (Islam et al., 2011; Picelli et al., 2013). In droplet-based approaches, dissociated cells are mixed with barcode-containing droplets in a one-to-one manner, so that subsequent steps can be performed in bulk, reducing the cost and boosting throughput, but at the expense of sequencing depth (Klein et al., 2015; Macosko et al., 2015). Single-cell RNA-seq technology is still rapidly evolving. It has been applied to many regions of the mammalian nervous system (reviewed in Johnson and Walsh, 2017; Zeng and Sanes, 2017), and more recently to smaller neurons (hence smaller mRNA content per cell) of invertebrate model organisms such as C. elegans and Drosophila (Cao et al., 2017; Li et al., 2017a; see also Crocker et al., 2016). Statistical methods then cluster neurons based on their transcriptome data, and, importantly for the purpose of circuit analysis, identify cell type-specific markers for genetic targeting of neuronal types (Section 2b).
How has single-cell RNA-seq data informed us about neuronal cell types? In neural circuits where cell types have been analyzed using anatomical, neurophysiological, and perturbation methods, the correspondence of these measurements to transcriptome clusters has been generally excellent. In the mammalian retina, for example, anatomical and histochemical studies have defined up to 13 distinct bipolar cell types. Single-cell RNA-seq identified 15 transcriptome clusters, including all previously described 13 types and two putative new types (Shekhar et al., 2016). In the fly antennal lobe, where each class of olfactory receptor neurons or 2nd order projection neurons (PNs) sends their axons or dendrites to a single, discrete glomerulus, PN transcriptome clusters match previously described glomerular classes (Li et al., 2017a). In brain regions where neuronal cell types are less stereotyped, such as the mammalian cerebral cortex, single-cell RNA-seq has not only successfully classified known neuronal groups, including excitatory neurons from different cortical layers and major classes of inhibitory neurons, but has also identified numerous transcriptome clusters that likely correspond to additional distinct cell types (Zeisel et al., 2015; Tasic et al., 2016; Paul et al., 2017). The number of cell types per cortical area, and how these cell types vary across different cortical areas, are questions being tackled by combining single-cell RNA-seq with mapping axonal projections and physiological characterization (Tasic et al., 2017). For example, in the mouse motor cortex, transcriptome clusters in layer 5 correspond to distinct descending neuron types with specific roles in planning and executing movements (Economo et al., 2017).
Because single-cell RNA-seq produces high-dimensional data and can be applied in a standardized manner across brain regions and animal species, it provides the most comprehensive set of parameters for defining a neuronal cell type. However, the simple one-to-one correspondence between cell types and transcriptome clusters does not apply for all situations. We highlight a few exceptions below, some of which are relevant for targeting cell types for circuit analysis. First, cell types are traditionally defined based on discrete gene expression level differences, but in some cases groups of cells exhibit continuous gradients of gene expression. For example, retinal ganglion cells with otherwise identical properties express genes at a level based on their spatial position in the retina (e.g., Eph receptors for retinotopic axon targeting; Cheng et al., 1995). This may be an example in which gene expression differs within the same neuronal type. Other cases are less clear. Dorsal and ventral striatal neurons of the same discrete type (e.g., projection neurons expressing the D1 dopamine receptor) have different input and output connections, and likely distinct functions even though their gene expression differences are along continuous gradients (Gokce et al., 2016).
Second, gene expression can be influenced by physiological states, including neural activity (e.g., Hrvatin et al., 2018) and circadian cycles (e.g., McDonald and Rosbash, 2001). Thus, the same cell types may produce different transcriptomic clusters depending on whether the neurons were active or not, and from which phase of the circadian cycle transcriptome data were collected.
Third, transcriptional diversity may peak during circuit assembly. For instance, transcriptomes between closely related Drosophila PN types are distinct during development but become indistinguishable in adults, as genes related to wiring specificity are down-regulated after development (Li et al., 2017a). This means that different neuronal types may no longer be distinguishable by adult gene expression alone; one needs to use methods that tap into their developmental history or differential connectivity (Section 2d), or the spatial locations of neurons (Lein et al., 2017), to gain genetic access to each subtype.
Fourth, individual transcriptomic clusters—used to represent neuronal cell types—are rarely defined by expression of single genes; instead, they are defined by expression levels of combinations of genes (e.g., Zeisel et al., 2015; Foldy et al., 2016; Tasic et al., 2016; Li et al., 2017a; Paul et al., 2017). Thus, intersectional approaches based on expression of more than one gene (Section 2c), or based on gene expression and axonal projection (Section 2d), will be increasingly important as we refine the resolution of genetic dissection.
2b: Genetic access to cell types by mimicking endogenous gene expression using binary strategies
Ten years ago, we stated in the context of cell type definition: “For the purpose of dissecting neural circuits at present, useful operational definitions correspond to our abilities to use genetic tools to study neurons. These include, foremost, gene expression patterns, which yield enhancer/promoter elements to access specific cell types.” Indeed, genetic dissection of neural circuits using “cell type” specific drivers in the past decade (e.g., Gong et al., 2007; Jenett et al., 2012) have enriched our knowledge of the anatomical, physiological, and functional properties of the neurons targeted by these drivers. In addition, methods for capturing endogenous gene expression are undergoing a revolution.
The most widely used method for genetic targeting of cell type is to use the regulatory sequence in the DNA of an endogenous gene expressed in that cell type to drive the expression of a transgene. The simplest means involves a single transgene in which the regulatory sequence directly drives the expression of an “effector” protein (defined as a protein used to label, record, or manipulate target neuronal cell types). This has increasingly been replaced by more flexible binary strategies. In binary strategies, the regulatory sequence of an endogenous gene is used to express a “driver” transgene that encodes a transcription factor such as GAL4 or tTA (tetracycline-repressible transcriptional activator), or a DNA recombinase such as Cre or FLP. The second, “responder” transgene, contains the coding sequence of an effector whose expression is regulated by either transcription factor binding sites such as UAS (upstream activation sequence) or TRE (tetracycline response element), or recombinase target sites such as loxP or FRT (Figure 1A–D). The modular nature of these binary systems allows the same driver to express different responder transgenes, and the same responder transgene to be expressed in different patterns from multiple drivers. In addition, binary expression systems can achieve higher levels of expression compared to single transgenes (Luo et al., 2008).
Figure 1. Binary Expression and Intersectional Strategies.

(A–B) Transcription-based binary expression systems. In the driver transgenes, coding sequences for the transcription factor GAL4 (A) and tTA (B) are driven from a cell type-specific promoter (S). In the responder transgenes, the coding sequence of the effector (E) is driven by promoters that contain binding sites of the transcription factors in the driver transgenes, UAS (A) and TRE (B). Note that tTA/TRE system can be further regulated by the drug Dox.
(C–D) Recombinase-based binary expression systems. In the driver transgenes, coding sequences for the recombinase Cre (C) and Flp (D) are driven from a cell type-specific promoter (S). In the responder transgenes, the effector is only expressed after Cre or Flp acts on the loxP or FRT sites to invert the intervening sequence (C), or to remove the transcription stop between the ubiquitous promoter (U) and the coding sequence of the effector (D). Note that both strategies can be applied to Flp/FRT- and Cre/loxP- mediated activation. The inversion strategy (C, where the recombinase recognition sites are in opposite direction as indicated by the triangles) utilizes two variants of recombinase recognition sites (here loxP and loxP*) that can only support recombination between the same variant. This strategy is termed FLEx (Schnutgen et al., 2003).
(E) Overlapping expression driven from promoter A (orange) and B (blue) creates three patterns, X, Y, and Z, which can be accessed by intersectional strategies in F and G.
(F) Intersectional strategies based on two recombinases driven from promoters A and B.
In the “A AND B” strategy, the effector is only expressed after Flp- and Cre-mediated recombination both occur, removing the two intervening transcriptional stops.
In the “A NOT B” strategy, the action of Flp removes the stop and thus activates the effector, whereas the action of Cre deletes the coding sequence of the effector, thus inactivates it.
The “B NOT A” strategy is similar to the “A NOT B” strategy except that the FRT and loxP sites are switched.
(G) AND gate can also be achieved by combining a recombinase and a transcription system.
There are many ways to create the driver transgene (Luo et al., 2008). The most faithful mimicry of endogenous gene expression results from insertion of the coding sequence of the driver into the endogenous locus of the gene whose expression is to be mimicked. Brain-wide maps of gene expression patterns are available for the mouse (Lein et al., 2007), providing a rich resource for this endeavor. The coding sequence of the driver can either replace the coding sequence of the endogenous locus (creating a “knockout” of the endogenous gene), or can be inserted after the endogenous coding sequence via a self-cleaving short viral 2A peptide or an internal ribosome entry site (IRES) such that the same mRNA produces both the endogenous and driver proteins. The classic way of doing this in mice, termed “knockin,” uses homologous recombination in embryonic stem cells (Capecchi, 1989) (Figure 2A). These classic methods are being supplemented by the use of the CRISPR/Cas9-based gene editing system (Jinek et al., 2012; Cong et al., 2013; Mali et al., 2013), which has transformed many branches of biomedical science (for recent reviews, see Komor et al., 2017; Pyzocha and Chen, 2017). CRISPR/Cas9 can be used to perform the knockin procedure directly in a single-cell mouse embryo (Yang et al., 2013; Chen et al., 2016; Quadros et al., 2017), bypassing the use of embryonic stem cells (Figure 2B). Analogous procedures have been applied successfully to other species such as Drosophila and zebrafish (Gratz et al., 2015; Albadri et al., 2017), and can in principle be extended to any species where methods for creating transgenic animals via microinjection of DNA into embryos have been developed. CRISPR/Cas9-mediated gene editing can also be performed in neuronal progenitors and postmitotic cells via in utero electroporation or viral transduction (Mikuni et al., 2016; Nishiyama et al., 2017). However, the efficiency of CRISPR/Cas9-mediated knockin (using homology-directed repair) is considerably lower than that of knockout (using non-homologous end joining repair). Improvement of the knockin efficiency (Komor et al., 2017) will facilitate the spread of genetic approaches to traditionally non-genetic model organisms.
Figure 2. Targeting Neurons based on Patterns of Endogenous Gene Expression.

(A) In the classic knockin strategy, the targeting construct (containing the “2A-Cre” insertion right before the stop codon in this example) is introduced into the embryonic stem (ES) cells. Targeted ES cells (usually selected by a drug resistant gene not shown) are injected into blastocysts, which produce chimera mice for screening of germline transmission in a subsequent generation.
(B) In CRISPR/Cas9-mediated gene editing, a mixture of 1) guide RNA (gRNA), 2) Cas9 protein, and 3) donor DNA is injected into the pronuclei of fertilized eggs (zygotes). 1) and 2) create double-strand breaks in regions of DNA specified by gRNA sequence, and homology-directed repair utilizes the donor DNA sequence to repair the breaks, creating transgenic animals with desired knockin allele as (A). Cas9 protein can also be replaced by Cas9 mRNA, or by the use of a transgenic animal where Cas9 is expressed in germ cells.
Traditionally, binary systems require the production of two transgenic animals, which can then be crossed to each other to produce progeny that contain both the driver and the responder transgenes. In mammals, however, the responder transgene is now often introduced by viral transduction. The most commonly used viruses include adeno-associated virus (AAV) and lentivirus (see Luo et al., 2008 for a summary of their key features). Compared to transgenic animals, viral transduction has the following advantages: 1) It is much easier and faster to produce viruses than transgenic animals; this is particularly the case when co-expression of multiple transgenes is required. 2) When introduced acutely in adults, viral methods avoid potential side effects of expressing the transgenes throughout development. 3) Viruses can be injected into specific brain areas, providing spatial control of transgene expression. 4) AAVs can also be delivered systemically via the bloodstream using coat protein variants that efficiently pass through the blood-brain barriers (Deverman et al., 2016), which can achieve cell type specificity in combination with specific drivers (Allen et al., 2017b).
Viral transduction methods have significant limitations: 1) Viral vector packaging imposes limits on transgene size. For instance, AAVs can rarely carry more than 5 kb exogenous sequences, making it difficult to express transgenes with long coding sequences or carry long regulatory sequences that are often required to faithfully mimic cell type-specific expression; this is one reason why most cell type-specific drivers are based on transgenic animals rather than viruses (however, see Lee et al., 2014; Dimidschstein et al., 2016). 2) The tandem repeats of AAVs and random genomic integration of lentivirus make viral expression levels less easily controlled than in transgenic animals, where the transgene can be expressed as a single copy from a predefined locus (e.g., Tasic et al., 2011; Madisen et al., 2015). This is a significant problem for effectors that are sensitive to expression levels. For instance, for GCaMP6-based Ca2+ imaging (see Section 4 below), low-level expression does not provide sufficient sensitivity, whereas too high expression levels cause toxicity. For AAV-based expression where the expression level increases monotonically with time, there is a limited optimal window ideal for GCaMP6 imaging (Chen et al., 2013). This problem may be mitigated by the use of inducible expression systems, such as the tTA/TRE system (Sadakane et al., 2015).
Transgenes with specific expression patterns can also be identified by screening through expression patterns of large collections of randomly integrated transgenes, known as enhancer traps (Bellen et al., 1989; Bier et al., 1989; Brand and Perrimon, 1993; Shima et al., 2016). Transgenes can also be driven using portions of putative regulatory sequences of neural genes with complex expression patterns; the premise is that complex regulatory sequences are composed of individual regulatory elements, each of which contributes to a part of the observed expression pattern. The latter strategy has been successfully applied to Drosophila, resulting in the creation of many thousands of GAL4 driver lines with specific expression patterns (Jenett et al., 2012).
2c: Intersectional approaches to refine genetic access
The expression pattern of a single driver is often insufficient to limit transgene expression to the targeted neuronal type (see Section 2a). Intersectional systems allow transgene expression to be limited to the cross-section of two expression patterns (boolean AND), or excluded from an expression pattern (boolean NOT) (Figure 1E–G). For example, the AND gate can be achieved by separately expressing two halves of a transcription factor (such as GAL4) in two different patterns. Only in cells where these patterns overlap will a functional transcription factor be reconstituted (Luan et al., 2006; Pfeiffer et al., 2010). This split GAL4 system has been systematically applied in Drosophila, creating a library of highly specific spatial patterns allowing access to specific cell types (e.g., Aso et al., 2014). The AND gate can also be achieved by using two recombinase systems (Figure 1F) (Kim et al., 2009; Madisen et al., 2015) or a combination of a recombinase and a transcription factor (Figure 1G) (Stockinger et al., 2005). The NOT gate can be achieved by introducing a repressor of a transcription factor (such as GAL80 for GAL4; Lee and Luo, 1999), or specific arrangements of recombinase recognition sites for two recombinases (Figure 1F). Reporter transgenes used for intersectional approaches can be from transgenic animals (Kim et al., 2009; Madisen et al., 2015) or introduced via viral transduction (Fenno et al., 2014). The pros and cons of transgenes introduced via viral transduction and via transgenic animals discussed above similarly apply to intersectional strategies.
Whereas intersectional approaches have mostly been applied to two spatial patterns of expression, a similar concept can be applied to spatial and temporal patterns. Multiple ways to temporally regulate transgene expression have been employed, including the use of CreER (activated by tamoxifen-induced nuclear translocation), tTA/TRE (repressed by the presence of tetracycline analog Dox; Figure 2B), heat shock promoter to drive transgene expression (activated by high temperature), or GAL80ts (inhibits GAL4/UAS-mediated transgene expression in a temperature-dependent manner; McGuire et al., 2003). As an example of intersection between a spatial and a temporal pattern, chandelier cells in mice can be specifically accessed by using a CreER driver that is transiently expressed in all inhibitory neuron progenitors and administering tamoxifen at a time when CreER is highly expressed only in chandelier cell progenitors (Taniguchi et al., 2013). In flies, using a heat-shock promoter controlling FLP expression, in combination with a mosaic PN-specific GAL4 line, allowed genetic access to PNs born at a specific time (Jefferis et al., 2001).
2d: Targeting neurons based on their projection patterns and activity
So far, we have discussed methods of accessing neurons based on their gene expression patterns. Given that axonal projection and physiological response properties are also characteristics of neuronal cell types, methods that use these properties to access specific neuronal populations have been developed. Furthermore, these methods can also be intersected with gene expression discussed above to refine targeting of cell types.
Certain viruses are efficiently taken up by axons and axon terminals and are transported retrogradely to cell bodies. These viruses can therefore be used to transduce neurons based on axonal projections (Figure 3A). Canine adenovirus 2 (CAV2), rabies virus, pseudorabies virus (PRV), and herpes simplex virus (HSV) have this property naturally and have been used to label neurons (Ugolini et al., 1987; Wickersham et al., 2007a; Oyibo et al., 2014; Junyent and Kremer, 2015). Lentiviruses can be endowed with the property of retrograde uptake by pseudotyping with rabies glycoprotein (Mazarakis et al., 2001). Certain AAV serotypes can also transduce axon terminals, albeit not as efficiently. However, directed evolution of coat proteins has yielded a mutant AAV (AAVretro) that can efficiently transduce the axon terminals of many neuronal types (Tervo et al., 2016). One caveat for retrograde viral transduction is that retrograde viruses may infect axons-of-passage in addition to axon terminals (e.g., see Schwarz et al., 2015). Another important caveat in retrograde viral transduction (and to some extent all viral transduction) is viral tropism—viruses can have vastly different transduction efficiencies for different cell types because different cell types express different levels and/or types of receptors that mediate viral entry. For example, AAVretro efficiently infects most cortical projection neurons, but not corticothalamic neurons (Tervo et al., 2016).
Figure 3. Targeting Neurons based on Projection and Activity.

(A) Schematic for targeting neurons based on their projection. In this example, an AAV that expresses a Cre-dependent effector is injected into the region of interest, and a Cre-expressing virus that transduces axon terminals is injected into one of the target fields. Only neurons that project to that target field will express the effector (red).
(B) In the Fos-tTA strategy, tTA is driven from the Fos promoter such that it will be expressed in activated neurons (lightening bulb). When Dox is removed from water/food, the effector is expressed in these activated neurons. When the animal is returned to Dox-containing water/food, no new activated neurons will express the effector, but the effectors expressed during the Dox off period persists for a few days.
(C) In the Fos-2A-CreER strategy (TRAP2; see Allen et al., 2017), neurons activated during the 4-hydroxytamoxifen (4-OHT) period have the potential to undergo Cre/loxP-mediated recombination, resulting in permanent reporter expression.
An important advance in the past 10 years is the development and application of methods that target neurons based on recent neural activity. Most of these methods in mice take advantage of immediate early genes (IEG), such as Fos and Arc, whose transcription is rapidly and transiently turned on by neuronal activity (Greenberg et al., 1986; Morgan and Curran, 1986; Lyford et al., 1995). The Fos promoter has been used to drive the expression of beta-galactosidase, which converts the prodrug Daun02 into Daunorubicin that inactivates neurons through apoptosis or blockade of voltage-gated Ca2+ channels; in this way one can inactivate specifically recently activated neurons during the prodrug application period (Koya et al., 2009). The Fos promoter has also been used to drive tTA expression. TRE-driven effectors are expressed only when neurons are activated in the absence of Dox. However, the effector expression can persist for a few days after Dox application, allowing neurons activated by recent experience (during the no-Dox period) to be manipulated during subsequent behavior (Reijmers et al., 2007; Liu et al., 2012) (Figure 3B). The Fos and Arc promoters have also been used to drive expression of CreER through knockin to capture neurons activated during the tamoxifen-active period, enabling permanent expression of Cre-dependent effectors (Guenthner et al., 2013) (Figure 3C); neurons captured in this manner has been shown by in vivo recordings to respond preferentially to natural stimuli experienced during the tamoxifen-active period (Tasaka et al., 2018). More variants of these activity-dependent methods utilizing immediate early genes have been reported, including virus-based approaches where natural or synthetic promoters have been used to drive effector expression in an activity-dependent manner (reviewed in DeNardo and Luo, 2017).
These IEG-based methods have two major limitations. First, the physiological stimulus causing IEG expression is not well understood and likely differs for different IEGs, cell types, and across behavioral conditions. For example, the behavioral history modifies the rules of Arc induction, independent of spiking activity (Guzowski et al., 2006). Second, the temporal precision with which activated neurons are captured is slow (many hours) compared to the time scales of discrete behaviors (seconds). Dox application/withdrawal takes a day or more, and administration of 4-hydroxytamoxifen (the active metabolite of tamoxifen) limits the capture of active neurons to a time window of ~6 hrs. In addition to “signals” (neurons of interest activated by a particular experience or behavioral episode), “background” neurons activated during the same period are also captured.
Despite such limitations, these tools have been applied to address a wide range of neurobiological questions. For example, Fos-tTA has been used to study the cellular basis of memory encoding (e.g., Reijmers et al., 2007; Liu et al., 2012). A new variant of Fos-CreER has been shown to capture activated neurons with high efficiency and specificity in an investigation of the neural basis of thirst motivation (Allen et al., 2017a). New approaches in which gene expression is gated by light as well as activity limit the temporal window and may enhance the precision of capturing active neurons relevant to specific experiences (Fosque et al., 2015; Lee et al., 2017; Wang et al., 2017).
Successes of targeting neurons based on their projection and neural activity patterns raise an interesting question: to what extent do neuronal projection and activity patterns correspond to cell type? Our view is that neuronal populations in a given region that project to different targets likely belong to distinct cell types with differentially expressed genes; in many cases we simply have not yet uncovered the differentially expressed genes or have not been able to utilize them to access cell types. In addition to the labor and time required to generate cell type-specific drivers after knowing which gene expression pattern is to be mimicked, it is possible that expression of a single gene is insufficient to differentiate cell types, or that cell type-specific gene expression is down-regulated in the adult nervous system (see Section 2a).
The correspondence between activity patterns and cell type is less clear. Different cell types in the same local circuit can exhibit profoundly different activity patterns. However, neurons belonging to one transcriptomic cluster and projection class still show diverse activity patterns (Economo et al., 2017). Furthermore, classic experiments have shown that the activity patterns of individual motor cortical neurons can be conditioned in almost arbitrary ways with operant conditioning (Fetz, 1969). Learning-related effects are more commonly seen in higher order neurons compared to the periphery. Targeting neurons based on their activity offers an orthogonal (to gene expression-based and projection-based) approach to access functionally related sets of neurons for analysis. Such an approach is critical to link functional ensembles, such as the sparse subset of hippocampal neurons that are active at a particular location in space, to behavior.
2e: Summary and future directions
Many of the techniques for targeting cell types that we summarized ten years ago, including binary expression and intersectional expression strategies, as well as creating driver lines that mimic endogenous gene expression, are still widely used today. These techniques have been aided by the generation of many more cell type-specific drivers in the past decade, whose applications have enriched our understanding of the anatomy, physiology, and function of these cell types. Methods based on neuronal projection and activity patterns have further enhanced our ability to target neuronal cell types by harnessing properties beyond gene expression patterns. Two transformative technologies, single-cell RNA-seq and CRISPR-based genome editing, were not available ten years ago. The former has vastly enriched our knowledge of transcriptomes of individual neurons and has the potential to unify the concept of neuronal cell type while at the same time providing a rich list of genes for targeting specific cell types. The latter has the potential to greatly speed up the creation of transgenic animals with cell type-specific drivers.
We envision that further improvement of single-cell RNA-seq technology (enhanced sensitivity, reduced cost) will allow its systematic application in model organisms such as mice and flies, with the eventual goal of having single-cell transcriptomes for neurons in all regions of their nervous systems. With the increased efficiency of CRISPR-based knockin, researchers can routinely produce driver lines that mimic expression patterns of endogenous genes to investigate the anatomy, physiology, and function of specific neuron types using methods discussed in subsequent sections. Developing reliable viral methods that target specific cell types can greatly speed up the cycle from gene expression data to functional manipulation of cell types. Refining these tools in genetic model organisms will eventually lead to their widespread use in traditionally non-genetic model organisms, including non-human primates. Finally, improving the temporal resolution of targeting neurons based on their activity—ideally in the realm of seconds instead of hours to days—will further enhance our ability to capture neurons in action for subsequent manipulation.
3. Cell Type-specific Neuroanatomy
3a. Overview
During the past decade, there have been considerable advances in methods to characterize neuronal shapes and connectivity. These advances have been paralleled by the generation of numerous cell type-specific driver lines, as well as cell type taxonomies defined by single-cell gene expression data (see Section 2). Because the overarching goal of genetic circuit analysis is to link cell types to their connectivity and function, efforts are now underway to bring these developments together. New driver lines are exploited to characterize the morphology, physiology, and connectivity of the targeted neuronal populations. Cell types that were initially defined based on gene expression are being linked to other cellular features, including anatomy and physiology. Accordingly, although our focus here is on genetic neuroanatomy approaches, we also consider approaches that can be used to identify connections of genetically-defined cell types, so long as a correspondence can be made to link a cell type’s genetic profile to some other characteristic feature. For example, electron microscopy (EM) reconstructions can reveal cell types with known morphology and link them to connections observed in the same specimen (Helmstaedter et al., 2013).
3b. Morphologies and projection patterns of genetically-defined cell types
Dendritic morphology and axonal projection patterns are often defining features of a neuron type. Historically, these were the only features available, as Golgi staining revealed dendritic morphologies and limited axonal projections. Cell types first defined by morphology often have proven to also be distinct in their physiology, connectivity, and gene expression. For example, anatomically-defined cortical GABAergic neuron types, including basket cells, chandelier cells, and Martinotti cells, are now accessible using Cre driver lines (Taniguchi et al., 2011).
Axons of projection neurons (those that connect one brain region to another) can travel long distances and often exhibit complex branching (collateralization) patterns, which enable individual neurons to innervate multiple distant targets (Figure 4A). Intracellular or juxtacellular dye filling in vivo followed by single neuron reconstructions can allow the morphologies of both the axonal and dendritic arbors of single neurons to be observed (Gilbert and Wiesel, 1979; Pinault and Deschenes, 1998). But this method is rarely used in large mammalian brains for investigating long-distance projections because the reconstructions are extremely time consuming. Instead, most of our knowledge about long-distance axonal projection patterns is inferred from injection of anterograde and retrograde tracers (Cowan, 1998). These classic methods have now been combined with cell type-specific neuroanatomy. For example, brain-wide long-distance projections from cell types has been mapped by injecting AAVs expressing Cre-dependent fluorescent markers as anterograde tracers into specific locations in defined Cre-driver mice (Figure 4B) (http://connectivity.brain-map.org). Likewise, retrograde tracing in combination with marker staining can reveal cell type-specific axonal projections.
Figure 4. Cell Type-specific Axonal Projection and Collateralization Patterns.

(A) Ground truth of the axonal projection patterns (right) of neuronal populations at a specific brain region (left). T1–T4: target regions 1–4.
(B) Injecting AAV expressing Cre-dependent (FLExloxP) GFP into Cre transgenic mice can determine the axonal projection patterns of all Cre+ neurons at the AAV injection site. In this and all subsequent panels, unlabeled neurons are in grey, and their axons are omitted.
(C) Injecting retrograde transducing canine adenovirus 2 (CAV) expressing Cre-dependent Flp at one of the targets, along with injecting AAV expressing Flp-dependent (FLExFRT) GFP at the cell body region of Cre transgenic mice, can determine the complete axon collateralization patterns of Cre+ neurons that project to a specific target region.
(D) Replacing Flp-dependent GFP in (C) with Flp-dependent TVA and rabies glycoprotein (G), followed by RVdG at the cell body region enables trans-synaptic tracing of inputs (green) to Cre+ neurons that project to a specific output region, a strategy named cell-type-specific tracing the relationship between input and output (cTRIO).
Bulk anterograde tracing does not decipher specific collateralization patterns. For example, consider a population of neurons in a specific region that projects to ten target regions. This projection could be composed of: 1) one neuron type with ten collaterals corresponding to the ten target regions; 2) ten neuron types with each type innervating one of the target regions; or 3) any combination between these two extremes (Figure 4A). Classically, neurons that project axons to multiple distant targets have been identified by double labeling with retrograde tracers injected at two different sites. However, this method requires high efficiency of retrograde tracing from each site (otherwise it creates a high false-negative rate), and knowledge of projections to additional un-injected locations remains unknown. Methods that combine efficient retrograde viral transduction and cell type-specific anterograde tracing enable the determination of the complete collateralization pattern of specific neuron types that project to a specific output site (Figure 4C) (Beier et al., 2015; Schwarz et al., 2015; Ren et al., 2018). However, the collateralization patterns still reflect a neuronal subpopulation rather than individual neurons.
A high-throughput approach, MAPseq, capitalizes on next generation sequencing and barcoding to convert the determination of individual neurons’ collateralization patterns into a sequencing problem. MAPseq allows the locations of the long-distance projections of a population of neurons located at a viral injection site to be quickly assayed at single neuron resolution (Kebschull et al., 2016). The approach is based on engineered Sindbis virus libraries in which each viral particle expresses a unique barcode that gets trafficked into the distant axons of infected neurons. By injecting a high-diversity viral library into a particular brain region at a titer that assures that no two neurons share the same bar code, followed by sample dissection and sequencing, it is possible to identify which neurons’ barcodes are in each dissected sample and therefore must have made a projection to the corresponding location. Spatial resolution is limited by tissue dissection. The correspondence between projection targets, genetic identity, and precise location of the parent neurons will require further developments such as imaging of the viral injection site and in situ sequencing.
The ultimate means of revealing neuronal morphology is to visualize individual neurons, including their complete dendritic processes and axonal projections. Light microscopy lacks the resolution to separate individual neuronal processes in densely labeled tissue, requiring methods for sparse labeling and/or expression of differently colored markers (reviewed in Jefferis and Livet, 2012). For example, recombinase-mediated stochastic activation of multi-color reporters has enabled resolution of many individual neurons and their projections in the same brain (Livet et al., 2007; Nern et al., 2015). Alternatively, neurons can be sparsely labeled and their axonal projections traced using either recombinase-based methods (Marin et al., 2002; Wong et al., 2002; Economo et al., 2016) or photoactivation of individual neurons expressing photo-activatable GFP (Datta et al., 2008). Images of individually labeled neurons can then be computationally registered to a common reference brain (Chiang et al., 2011; Costa et al., 2016). These procedures have been widely used in small brains such as Drosophila because smaller neurons are more easily labeled completely with genetic markers and axonal tracings are typically performed in whole-mount preparations.
Anatomical analyses in larger brains have traditionally been carried out in histological sections. Sectioning facilitates penetration of staining reagents throughout the tissue and provides access to high-resolution microscopy. However, tracking long-range anatomical organization, such as axonal projections across brain regions that can be millimeters apart, requires the reconstruction of three-dimensional volumes from serial sections. This process is labor intensive and inaccurate due to loss or distortion of individual sections. By contrast, whole-mount preparations enable researchers to examine the nervous system in 3D without reconstruction in an intact brain or within an intact organism. In the past, the use of whole-mount preparations has been applied to tissues less than a few hundred micrometers thick—such as an intact C. elegans or a dissected Drosophila brain—because of limitations in the penetration of staining reagents and the opacity of tissues due to lateral light scattering in fluorescence microscopy. In recent years, the development of a number of imaging and tissue-clearing methods has enabled high-resolution fluorescence imaging of large tissue volumes, up to many millimeters in each dimension.
Tissue clearing involves reducing inhomogeneities in refractive index, which produce light scattering in biological samples. A number of tissue clearing methods have been developed for fixed tissue (reviewed in Richardson and Lichtman, 2015, 2017). Generally, these methods 1) remove lipids and 2) match the refractive index of the remaining protein and nucleic acid matrix (sometimes fortified by crosslinked hydrogels) with high refractive index immersion solutions. The end results are samples with largely uniform refractive indices that allow light to penetrate the tissue samples with minimal lateral scattering. Individual methods differ in their ability to preserve native fluorescence, ease of antibody staining, degree of tissue expansion, and tissue rigidity (reviewed in Richardson and Lichtman, 2015). These cleared tissues can then be imaged using standard laser-scanning confocal or two-photon microscopes, or light-sheet microscopes that can image large blocks of tissues more rapidly. Imaged volumes can then be aligned to reference atlases for systematic data analysis (e.g., Renier et al., 2016; Ye et al., 2016).
Whole-mount imaging of cleared tissues has diverse applications, from mapping inputs based on trans-synaptic rabies virus (Lerner et al., 2015; see below) and tracing axons across long distances (Ye et al., 2016) to whole-brain mapping of immediate early gene expression (Renier et al., 2016). These applications can also be achieved by hybrid methods for imaging large volumes, up to the entire mouse brain, at high resolutions. For example, two-photon imaging and tissue sections can be integrated in a block-face mode, where imaged portions from a large volume are sectioned away to expose more tissue for further imaging, and consecutive images are automatically aligned because they are sectioned from the same block (Ragan et al., 2012; Economo et al., 2016). Alternatively, serial thin sections can be imaged on the cutting blade, which can be used to reconstruct volumes as large as the entire mouse brain (Gong et al., 2013). These developments facilitate whole-brain imaging of complete axonal and dendritic arbors of single neurons in sparsely labeled samples (http://ml-neuronbrowser.janelia.org/). By combining imaging with immunohistochemistry and multiplexed in situ hybridization, or with selective labeling of genetically-defined cell types, it will be possible to establish correspondence between cell types and complete morphology and projection pattern.
3c. Genetic methods for trans-synaptic labeling from specific cell types
The above methods provide information about the locations of the axonal and dendritic arbors of neurons, and locations of overlap reveal the possibility of synaptic connections (Binzegger et al., 2004). However, actual connections are only formed between selected subsets of neurons with cell type specificity. It is therefore desirable to have genetic methods that can interrogate circuits at synaptic resolution and with cell type specificity. The first genetic methods for trans-neuronal labeling from specific cell types used either Cre-dependent expression of trans-neuronally spreading gene products such as wheat germ agglutinin and tetanus toxin C fragment (Yoshihara et al., 1999; Braz et al., 2002; Sano et al., 2007), or PRV, engineered to require Cre-recombination for replication in neurons (DeFalco et al., 2001). While these tools were productively used to discover new circuits with cell type specificity, their multi-synaptic spread often confounds interpretation. Multi-synaptic spread also confounds efforts to assess synaptic specificity. Thus, while it is possible that their spread is synapse specific, it is not well established whether trans-neuronal spread requires synaptic connections or simply physical proximity. Rabies virus (RV) spreads selectively from postsynaptic to presynaptic neurons (Ugolini, 1995; Wickersham et al., 2007b; Callaway and Luo, 2015). The advent of monosynaptically-restricted rabies virus for retrograde labeling of inputs to genetically targeted cell types has therefore largely replaced these approaches when multi-synaptic spread is not desired (see below). But there remains no comparable method for monosynaptically-restricted anterograde circuit tracing of the outputs from specific cell types. A Cre-dependent, multisynaptic, anterogradely spreading H129-HSV allows efficient tracing of outputs from specific cell types, and there is evidence that the spread of this virus is selective for synaptically connected neuronal populations (Lo and Anderson, 2011). However, this virus is not compatible with functional studies because it rapidly kills infected neurons (much more rapidly than RV; see below). There is therefore great need for a monosynaptically-restricted anterograde circuit tracing system.
During the last decade, there has been widespread adoption of monosynaptic retrograde circuit tracing with glycoprotein (G)-deleted rabies virus (RVdG) (Wickersham et al., 2007b; Callaway and Luo, 2015). This method allows the direct synaptic inputs (“input cells”) to any genetically accessible cell or group of cells (“starter cells”) to be labeled across the entire brain. An important step has been the generation and validation of reagents for labeling the synaptic inputs to cell classes expressing Cre-recombinase in various driver lines (Wall et al., 2010; Callaway and Luo, 2015). Multiple complementary methods for genetically targeting “starter cells” (see Section 2) have also been employed. For example, using a retrograde virus to express Cre, along with Cre-dependent rabies tracing reagents allows ‘Tracing of the Relationship between Inputs and Outputs’ (TRIO) (Schwarz et al., 2015). In a further refinement called cell-type specific TRIO (cTRIO), starter cells can be established based on the intersection between retrograde infection and Cre expression (Figure 4D).
Any gene of interest can be inserted into the RV genome so that the full genetic toolkit (e.g., monitoring or manipulating activity) can be applied to labeled neurons, allowing direct links to be made between connectivity and function (Osakada et al., 2011). Such functional studies are possible because RV infection is not initially detrimental to cell health. Variants of RVdG that express ChR2 and GCaMP6 have been used most effectively to link connectionally-defined neurons to circuit function and behavior. For example, ChR2-expressing RVdG has been used to optogenetically tag and functionally characterize neurons presynaptic to dopaminergic neurons in mice performing a classical conditioning task (Tian et al., 2016). In a particularly informative experiment, inputs to single starter cells in mouse visual cortex were labeled using RVdG expressing GCaMP6 (Wertz et al., 2015). This allowed measurement of visual responses of up to 700 input cells per starter cell to establish rules for the relationships between inputs and outputs in cortical networks. Nevertheless, when infected with the originally developed SAD-B19 strain of RV, cells show signs of toxicity about 10 days post-infection (Osakada et al., 2011). Another key limitation is the efficiency of trans-synaptic spread. While no direct measurements are available and efficiency can vary widely depending on cell types and experimental conditions, estimates based on ratios of input cells per starter cell suggest that fraction of presynaptic neurons labeled are likely to be in the ~10–50% range (Callaway and Luo, 2015).
Recent studies addressed some of these limitations, including an optimized complementing glycoprotein that improves the efficiency of viral spread (Kim et al., 2016) and use of the CVS-N2C strain of rabies both improves spread and delays toxicity (Reardon et al., 2016). Still more recently, it has been demonstrated that RV infection with the original SAD-B19 strain does not kill nearly as many neurons as originally thought. Although neurons “disappear” due to the termination of expression of marker genes from the RV genome, permanent marking based on transient expression of Cre, combined with longitudinal in vivo imaging, shows that about half of the infected cells remain viable for at least 4 months (Chatterjee et al., 2018). And a new “self-inactivating rabies” (SiR), which also overcomes transient expression by using a Cre expression, appears to allow nearly all labeled input neurons to remain viable indefinitely (Ciabatti et al., 2017).
While cell type-specific monosynaptic rabies tracing has many benefits, it should be applied and interpreted with caution. The benefit of the approach is its ability to quickly reveal, across the whole brain, neurons that are putative direct presynaptic partners to a cell type of interest. But one should not assume that every existing connection was labeled or that the numbers of labeled cells directly correspond to functional strength within the circuit. There is not always a direct correspondence between anatomical and functional measures of connection strength. Furthermore, multiple cell biological factors likely influence the efficiency of rabies spread, such as proximity of synapses to the cell bodies of starter cells or possible differences in the efficiency of uptake by different types of input cells. Results of rabies tracing should therefore be treated as a roadmap for further studies. Ideally, rabies tracing can reveal previously unknown circuits that are then further interrogated by functional studies targeted to selected circuit elements (e.g., Smith et al., 2016; Beier et al., 2017).
Viral based trans-synaptic tracing methods benefit from the ability to amplify signals through replication as the virus spreads between neurons. This increases signal-to-noise ratio despite the small numbers of viral particles likely to spread across the small numbers of synaptic contacts between connected neurons. Unfortunately, viral replication typically triggers a cell death program. It has therefore been a challenge to generate reagents for high signal-to-noise trans-synaptic tracing without toxicity. A new class of trans-synaptic methods that has been successfully applied in Drosophila, comprising trans-TANGO and TRACT, has the potential to provide alternatives for labeling mammalian circuits without toxicity and can theoretically be used for both anterograde and retrograde monosynaptic tracing (Huang et al., 2017; Talay et al., 2017). These approaches build on earlier methods that detected connections by expressing separate components in candidate pre- and postsynaptic neurons to create a unique signal only when these components interact at synaptic contacts. The first iteration, GFP Reconstitution Across Synaptic Partners (GRASP), was based on a split GFP that becomes fluorescent only when one half is present at a postsynaptic site and the other at the presynaptic site (Feinberg et al., 2007). The initial system was designed for C. elegans and a later mammalian system (mGRASP) was adapted for use in mammals (Kim et al., 2011). But this approach has not been widely adopted, largely because of its modest signal-to-noise ratio. Also, signal is confined to synaptic contacts and does not spread to and label the neuronal cell bodies that correspond to the connected cells. In contrast, both trans-TANGO and TRACT incorporate amplification systems in which signals generated at synaptic contacts spread to the cell body to initiate expression of fluorescent reporters in postsynaptic neurons.
Both TRACT and trans-TANGO were developed for anterograde monosynaptic circuit tracing from genetically targeted presynaptic neuron types of interest. Both use a ligand-receptor system, with ligand targeted to presynaptic terminals. Receptor activation in postsynaptic neurons induces a cleavage event that releases a transcriptional activator, driving expression of fluorescent proteins to mark the postsynaptic neurons. The systems differ in their presynaptically-targeted ligands and postsynaptic receptors. TRACT uses a CD19 ligand fused to syndecan or synaptobrevin presynaptically, and a postsynaptic receptor composed of a single chain antibody for CD19 fused to Notch domains, transcriptional activator GAL4, and neuroligin (for targeting to postsynaptic specializations). When activated by ligand, Notch cleavage releases the GAL4 leading to GFP expression from a UAS reporter (Huang et al., 2017). The trans-Tango ligand is glucagon fused to the presynaptic protein neurexin and the receptor is the G-protein coupled glucagon receptor fused to the transcriptional activator QF (Potter et al., 2010) by a linker that can be cleaved by TEV protease. A third component also expressed in postsynaptic neurons is TEV protease fused to human arrestin (hArr::TEV). Arrestin is recruited to activated G-protein coupled receptors, so upon ligand-receptor binding, the hArr::TEV is recruited to induce TEV cleavage and release of QF, which activates tdTomato expression from a reporter (Talay et al., 2017). Both systems were validated on known circuits in Drosophila and shown to be synapse-specific and have good signal-to-noise ratio. Further developments will be required to generate a similar system viable for mammalian circuit tracing, but the potential for non-toxic trans-synaptic tracing with this type of approach is high and it should also be adaptable to retrograde monosynaptic tracing.
3d. Electron microscopy
So far we have considered neural circuits at the level of cell types. In this description cell types define the nodes of a circuit diagram. However, neural circuits are organized at a finer level. Even the connectivity between particular cell types is highly non-random (Song et al., 2005; Yoshimura et al., 2005). Consistently, neurons of the same type can express different activity patterns (Economo et al., 2017), and activity patterns change with learning (Fetz, 1969).
The ultimate wiring diagram would consist of a connection matrix describing the synapses made between individual neurons in single animals. Serial-section electron microscopy (EM) has sufficient contrast and resolution to trace the thinnest neuronal structures, including axons and spine necks (both can have diameters as small as 50 nm), and also to detect synapses. Serial-section EM has been used to reconstruct the entire wiring diagram of C. elegans (White et al., 1986; Chen et al., 2006), and parts of the mammalian (Briggman et al., 2011; Lee et al., 2016) and insect (Takemura et al., 2013) visual systems. EM methods have made huge progress over the last ten years. Automation of data acquisition and analysis now allows imaging of large tissue volumes with low error rates (Xu et al., 2017a). Importantly, rapid advances in machine learning have made automated reconstructions of large parts of neurons from EM data possible (Januszewski et al., 2017). Large projects are currently underway to reconstruct entire fly brains and one cubic millimeter of mouse cortex. Mouse cortex reconstruction projects are not only building dense connection matrices, but they are also linking circuits to the functional properties of the constituent neurons by first performing in vivo functional imaging and then identifying the same neurons at the EM level (Lee et al., 2016).
A major challenge is to link neurons reconstructed in EM to cell types classified using transcriptomics and light microscopy. EM images are rich in information that can likely be used to classify cell types. For example, different cell types are known to have different spine densities, characteristic dendritic branching, and distinct intracellular compartments. These morphological features are being mapped to transcriptomic cell types. A separate set of experiments will likely be required to establish a look-up table linking cells reconstructed in EM to cell types defined using the other methods, such as in vivo light level imaging to detect genetically expressed markers followed by identification of the corresponding cells in EM images.
3e: Summary and future directions
Over the last decade there have been relatively few developments in terms of fundamentally new approaches for genetic neuroanatomy and circuit tracing. For example, single cell labeling, electron microscopy reconstructions, and trans-synaptic circuit tracing with genetically engineered neurotropic viruses, were already developed. Some of the newest and most promising techniques, such as trans-TANGO, TRACT, MAPseq, and sequencing-based methods for connectomics (Zador et al., 2012) are still in their infancy. More typically, we have seen important but incremental advances and the development of ancillary tools that have made genetic neuroanatomy more powerful. Methods for whole-brain automated reconstructions of single neurons are allowing large-scale high-resolution genetic neuroanatomy. Developments in machine learning are beginning to impact the feasibility of large-scale EM reconstructions. And trans-synaptic circuit tracing with RVdG has developed into a mature technology, with many dozens of helper viruses, mouse lines, and RV variants expressing genetic tools being readily available. Nevertheless, the market for genetic circuit tracing tools is far from saturated. There are important unfilled niches, including the need for a mammalian anterograde monosynaptic method and less toxic trans-synaptic tracers.
4. Cell Type-specific Neurophysiology
4a. Overview
Cell types define the nodes of a circuit diagram (Section 1). So far we have focused on targeting neuronal cell types (Section 2) and mapping connections between them (Section 3). Neural circuits process information represented by patterns of action potentials. The major goals in systems neuroscience are thus to determine 1) how these neural representations arise in defined cell types and 2) how neural representations in specific cell types relate to behavior. Addressing these challenges requires cell type-specific recordings and manipulation of neural activity. In this section we discuss cell type-specific neurophysiology. Section 5 is focused on methods for manipulating neural activity.
The last decade has seen an explosion of new imaging and electrophysiology methods. It is now possible to use fluorescence measurements to infer a variety of state variables in neurons, including cytoplasmic calcium, membrane potential, neurotransmitter concentration in the extracellular space and others. A key enabling technology is protein-based fluorescent sensors that change their properties in response to changes in one of these state variables (Lin and Schnitzer, 2016). New high-density electrodes based on state-of-the-art silicon technology provide orders of magnitude higher yield for extracellular recordings of neural activity compared to previous electrodes (Jun et al., 2017b). Below we discuss recent developments in cell type-specific neurophysiology and highlight the niche occupied by each method.
4b. Cell type-specific calcium imaging
Fluorescence-based imaging of cytoplasmic free calcium ions (‘Ca2+ imaging’) is revolutionizing neuroscience (Grienberger and Konnerth, 2012). In most cell types, action potentials are tightly coupled to the opening of voltage-gated Ca2+ channels and large (ten-fold) and rapid (rise time, < 1 millisecond) increases in Ca2+ concentration (Svoboda et al., 1997). Ca2+ signals in the cell body thus reflect patterns of action potentials. Excitatory synaptic transmission opens synaptic NMDA receptors, which admit Ca2+ into dendritic spines. Ca2+ in postsynaptic compartments thus reflects excitatory synaptic transmission. In invertebrate systems, Ca2+ is used to track electrical signals, often graded, in neurites (Elyada et al., 2013).
Ca2+ imaging is now routinely used to measure activity of large populations of neurons in behaving flies (Wang et al., 2004), fish (Ahrens et al., 2013), and rodents (Ziv et al., 2013; Peron et al., 2015b), and has been demonstrated in non-human primates (Li et al., 2017b). Classically, neural tissue was bulk-loaded with membrane permeable Ca2+ indicators (Stosiek et al., 2003; Komiyama et al., 2010). This approach has been almost entirely superseded by genetically encoded Ca2+ indicators (GECIs), which are based on fusions of fluorescent proteins and Ca2+-binding proteins that undergo large conformational changes in response to Ca2+ binding, such as calmodulin. Recent advances in Ca2+ imaging have been largely driven by the development of increasingly sensitive GECIs (Lin and Schnitzer, 2016), in particular the green fluorescent protein-based sensor GCaMP6 (Chen et al., 2013). Under favorable imaging conditions, GCaMP6 can detect single action potentials in pyramidal neurons. The mApple-based red sensor R-GECO has similar performance (Inoue et al., 2015; Dana et al., 2016). Higher sensitivity indicators allow detection of neural activity in larger populations of neurons. GCaMP sensors have been used to probe neural activity across thousands of neurons in the mouse brain and even the entire larval zebrafish brain (Ahrens et al., 2013).
Cellular Ca2+ imaging is most often performed with two-photon excitation laser scanning microscopy (TPM), which provides fluorescence imaging with high contrast and resolution deep in scattering tissue (Helmchen and Denk, 2005). The high resolution and image contrast provided by TPM allows relatively clean extraction of fluorescent signals corresponding to single neurons, separate from signals in the surrounding neurites and other neurons (Peron et al., 2015a). The new GECIs have inspired recent developments in microscopy. For example, new TPMs probe very large fields of view while maintaining high resolution (Sofroniew et al., 2016; Stirman et al., 2016). These ‘mesoscale’ microscopes can track activity of groups of neurons across multiple brain regions, millimeters apart. However, large-volume TPM is relatively slow, limited by the speed of laser scanning in three dimensions (> 10 ns per voxel).
The large fluorescence changes produced by new GCaMPs, together with fast and sensitive sCMOS cameras, have allowed standard (one-photon) wide-field microscopy of Ca2+-dependent fluorescence dynamics in intact tissues (Flusberg et al., 2005). Signals are collected with cameras across the entire focal plane simultaneously, enabling faster imaging compared to TPM. In addition, wide-field microscopes are simple, can be miniaturized, and can be easily deployed in freely moving animals. Neuronal dynamics are extracted based on localized fluorescence changes using computational methods. Because of out-of-focus fluorescence and light scattering, this method provides much less contrast compared to TPM. It is currently unclear to what extent the extracted signals correspond to single neurons without pollution from nearby neurons or active neuropil. Labeling sparse subsets of neurons and localizing GECIs to subcellular compartments, such as the nucleus, helps to alleviate this problem.
New optical methods bridge the gap between wide-field imaging and TPM. Light-sheet (Keller and Ahrens, 2015) and light-field microscopy (Grosenick et al., 2017) are one-photon methods that provide optical sectioning. These methods are particularly useful for imaging optically clear specimens such as larval zebrafish. TPM can be performed with an axially elongated Bessel focus; when scanning in 2D the image is projected along the Bessel focus and the frame rate turns into volume rate (Lu et al., 2017). The length of the Bessel focus defines a depth of field, which can be tuned to match the fluorescence distribution of the specimen: more sparsely labeled specimens tolerate more elongated Bessel foci.
For tracking activity in neural populations, Ca2+ imaging has some unique advantages compared to extracellular electrophysiology. Ca2+ imaging can sample activity from all labeled neurons in an imaging volume, revealing the spatial relationships between neurons with distinct activity patterns (Ohki et al., 2006). Moreover, activity in the same neuronal populations can be imaged across days and weeks, which is critical to study the neural basis of learning (Komiyama et al., 2010; Huber et al., 2012; Grewe et al., 2017).
Ca2+ imaging is routinely performed in a cell type-specific manner. GECIs can be targeted to specific cell types using the gene targeting methods described in Section 2 (Figure 5A). GECIs can also be expressed broadly, with cell type information extracted using separate measurements. For example, a spectrally separate fluorescent marker can be expressed in specific cell types (Peron et al., 2015b) (Figure 5B). In this situation imaging simultaneously tracks activity in the cell type of interest and neighboring neurons.
Figure 5. Cell Type-specific Imaging.
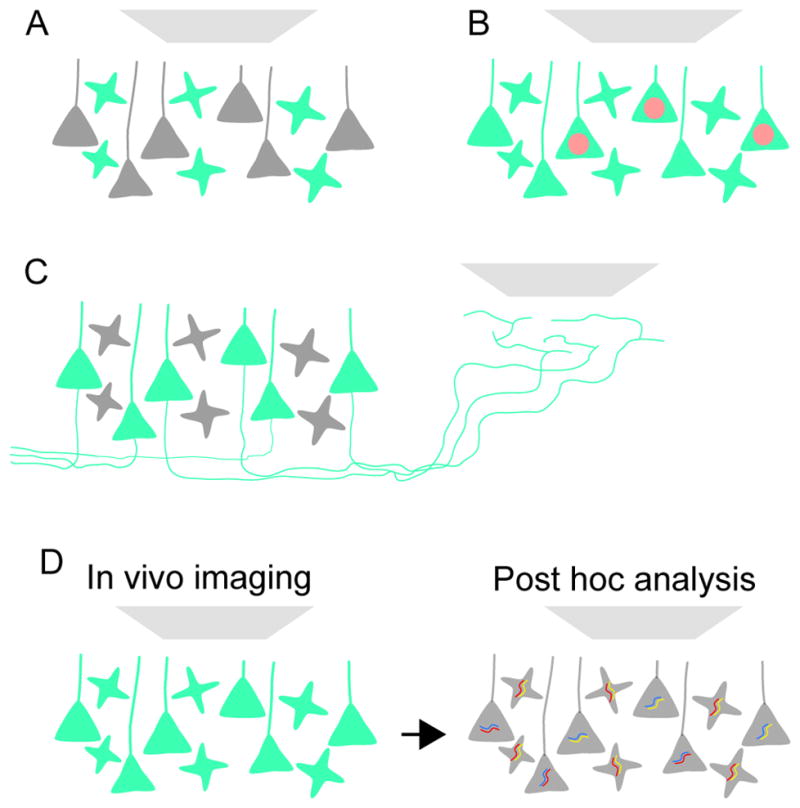
(A) Genetically encoded indicator of neural function is targeted to specific cell types (e.g. a local interneuron) for imaging.
(B) The indicator is expressed in all neurons for imaging. One cell type (e.g. a subtype of pyramidal neuron) in addition is identified with a fluorescent marker (in this example a red fluorescent protein targeted to the nucleus).
(C) The indicator is expressed in all projection neurons, but imaging is performed in the projection zone of one of the projection neuron types.
(D) The indicator is expressed in all neurons for imaging. Cell types are identified post hoc using molecular analysis (e.g. multiplexed fluorescent in situ hybridization).
Multiple schemes exist that link Ca2+ imaging and defined cell types without the need for genetically modified animals. These methods can thus be readily applied to rats and non-human primates, or allow cell type-specific drivers to be used for other modalities, such as optogenetics. Axonal Ca2+ imaging can track activity in neurons with defined projections (Figure 5C). Action potentials invade axonal arbors reliably and produce detectable Ca2+ accumulations in axons and boutons (Cox et al., 2000). Labeling axons in area A, for example by viral transduction, and imaging axons in area B, isolates signals from cell types that project from A to B (Petreanu et al., 2012).
A more general approach relies on in vivo imaging of densely labeled neural tissue, followed by post hoc molecular analysis of imaged neurons (Figure 5D). After the imaging experiment, the tissue is processed for multiplexed immunofluorescence or fluorescent in situ hybridization (FISH) (Kerlin et al., 2010). FISH promises to be especially powerful. Large-scale projects are currently assembling the transcriptomes of all cell types in multiple brain regions (see Section 2). These transcriptomes in turn provide sets of FISH probes that define cell type. New methods for highly multiplexed FISH and RNA profiling (Lubeck et al., 2014; Chen et al., 2015) should make it possible to identify many, if not all imaged cell types in parallel.
Ca2+ imaging has limited spatial reach because of light scattering. TPM can image through the larval zebrafish brain and the fly brain. However, in the mammalian brain, TPM penetrates only about one millimeter, corresponding to a few percent of the mouse brain (Helmchen and Denk, 2005). Fiber-based methods help overcome this problem. Fiber photometry is a popular technique that relies on targeted expression of GECIs (Cui et al., 2013; Gunaydin et al., 2014). A fluorescent measurement is performed through a single optical fiber that is implanted in the vicinity of neurons expressing a fluorescent indicator. Fiber photometry measures activity in populations of neurons or neuronal processes expressing the GECI. Activity can be detected in deep brain structures and groups of axons during behavior. However, fiber photometry averages across neurons, and therefore is more suitable for imaging activity of neuronal populations with homogeneous response properties. Imaging systems based on GRIN lenses allow Ca2+ measurements deep in the brain with cellular resolution, at the cost of larger, more invasive implants (Flusberg et al., 2005; Ziv et al., 2013; Jennings et al., 2015).
Different applications benefit from GECIs with distinct properties. For imaging large population of neurons, sensitivity for detecting neural activity above background is critical. Higher sensitivity directly translates into imaging larger neuronal populations, and into more reliable detection of sparse activity. In some experiments, it is critical to assign activity to specific, rapid phases of behavior. These experiments require indicators with faster kinetics. Wide-field fluorescence microscopy benefits from indicators with low baseline fluorescence, which results in reduced background from the large numbers of inactive neurons in out-of-focus locations. For imaging neuronal dendrites and axons (such as in Drosophila, where cell bodies frequently show little activity), robust baseline fluorescence is necessary so that these structures can be visualized in the absence of neural activity. For these reasons, the latest GFP-based sensors (jGCaMP7) are optimized for specific use cases, including jGCaMP7s (“sensitive”) and jGCaMP7f (“fast”), as well as jGCaMP7b (“high baseline”, for neuropil imaging) and jGCaMP7c (“contrast”; this sensor has very low baseline, appropriate for use in wide field imaging; see https://www.janelia.org/jgcamp7-calcium-indicators).
4c. Cell type-specific voltage imaging
The dynamics of the neuronal membrane potential is a key variable in neural computation. In addition, direct measurement of voltage changes promises to have faster kinetics than measurement of downstream Ca2+ changes (Yang et al., 2016). Until recently, imaging the membrane potential of individual neurons in the intact brain has remained out of reach. This is beginning to change with new genetically encoded voltage indicators (GEVIs) (Xu et al., 2017b). Below we focus our discussion on the most promising classes of GEVIs and discuss their limitations.
GEVIs come in three major flavors. First, ASAP (Chamberland et al., 2017) and ArcLight (Jin et al., 2012) are based on the membrane domain of the voltage-dependent phosphatase, fused to variants of green fluorescent protein. Voltage-dependent structural changes are transduced to changes of fluorescence intensity. These GEVIs have relatively bright fluorescence and are compatible with TPM. ASAP is sufficiently fast to track action potentials. ArcLight is slower than ASAP, but has higher sensitivity and better photostability. These sensors have been used to track neuronal membrane potential in Drosophila (Cao et al., 2013; Yang et al., 2016).
Second, microbial rhodopsins were found to be fluorescent voltage reporters (Kralj et al., 2011). The endogenous retinal chromophore is weakly fluorescent. Some rhodopsins show large and rapid fluorescence responses to voltage changes. But their brightness is low, requiring high illumination intensities. Moreover, current sensors are not compatible with TPM.
Third, electrochromic FRET sensors combine rhodopsin for voltage sensing with fluorescent proteins (Gong et al., 2015). The fluorophore brightness is modulated by the voltage-dependent state of the retinal by electrochromic FRET. In one example, the rhodopsin Ace was combined with the fluorescent protein mNeon (Ace-mNeon) (Gong et al., 2015). In selected cells Ace-mNeon reports spikes and membrane potential changes in single neurons in the visual cortex. Similar to the rhodopsin indicators, electrochromic FRET sensors do not show signal changes in TPM. With these GEVIs, voltage imaging now allows imaging of spikes and membrane potential dynamics in sparsely labeled neurons in vitro and in vivo.
Despite these recent improvements, voltage imaging still has substantial limitations. Understanding these challenges delineates the niche where voltage imaging will have high impact for studying neural circuits. Consider a comparison with Ca2+ imaging. The best-of-class Ca2+ indicators show up to 10-fold fluorescence changes, whereas voltage sensors change less than 2-fold for typical voltage changes. Ca2+ is sensed by GECIs distributed throughout the cytoplasm, whereas voltage has to be sensed in the membrane. It is typical to image Ca2+ with 107 fluorescent molecules in the cell body (corresponding to 50 μM of GECI concentration). In contrast, voltage is sensed with 105 GEVI molecules in the cell body membrane (assuming 100 molecules/μm2). This corresponds to a 100-fold advantage in brightness for Ca2+ imaging. The fast kinetics of voltage responses implies that fewer signal photons are collected per event; this corresponds to a further 100-fold advantage for Ca2+ imaging. Moreover, intracellular fluorescence contributed by GEVIs that are stuck in the endoplasmic reticulum produces non-productive background, reducing fluorescence changes related to membrane potential dynamics. Orders of magnitude improvements will thus be required to make voltage sensors competitive with GECIs or extracellular electrophysiology for imaging of neuronal populations at cellular resolution.
Nevertheless, we predict that voltage imaging will play important roles in niches that are difficult to cover by Ca2+ imaging or electrophysiology. For example, imaging of spikes and membrane potential dynamics simultaneously in a handful of sparsely labeled neurons is possible with current GEVIs. Measurements of correlations in membrane potential across multiple neurons are critical to distinguish between network models of neural circuit function (Singer, 1999). Voltage imaging can also track the fast time-scale dynamics of rare cell types, which may be difficult to sample with extracellular electrodes. Finally, voltage imaging might provide unique insights into the mechanisms of dendritic integration (Stuart and Spruston, 2015).
4d. Other types of functional imaging
Other genetically encoded indicators couple primarily to synaptic activity. Synapto-pHluorin, a pH-sensitive protein that reports synaptic vesicle fusion, can be used to report the release of synaptic vesicles. Synapto-pHluorin has been used to map the activity of olfactory neurons in the fly antennal lobe (Ng et al., 2002) and the mouse olfactory bulb (Bozza et al., 2004).
GluSNFR reports changes in extracellular glutamate concentration by changing fluorescence intensity with glutamate binding (Marvin et al., 2013). Sensitive new versions of GluSNFR can detect changes in cleft glutamate corresponding to the release of single vesicles (Helassa et al., 2017; Marvin et al., 2017). These sensors are very useful to image synaptic transmission, especially at large synapses, such as the retinal bipolar synapse (Franke et al., 2017). However, at typical central synapses, glutamate interacts with tiny patches of synaptic membranes (< 1 μm2) in the synaptic cleft. The resulting small signal is therefore expected to be swamped by background from fluorescent GluSNFR that is not interacting with glutamate. Genetically encoded sensors for other neurotransmitters, including GABA, acetylcholine, serotonin, and norepinephrine are on the horizon, In addition, genetically encoded indicators have been developed for intracellular signaling pathways, many of which are downstream of neural activity and synaptic signaling (Miyawaki and Niino, 2015).
4e. Cell type specific electrophysiology
Much of what we know about behavior-related activity in the mammalian brain is derived from extracellular recordings of action potentials corresponding to single neurons (single units). Electrodes can be inserted anywhere in the brain and thus have unlimited reach. Moreover, they detect action potentials with high signal-to-noise ratios and time resolution. New types of silicon-based probes can record hundreds of neurons simultaneously (Jun et al., 2017).
However, extracellular recordings by themselves provide relatively little intrinsic information about the cell types producing the spikes. Some cell types can be distinguished by their characteristic spike shapes. For example, parvalbumin-expressing, fast-spiking interneurons have unusually brief action potentials that can be recognized with extracellular methods (Cohen et al., 2012). Other cell types have characteristic firing patterns. For example, cerebellar Purkinje cells fire simple spikes at high rates, interspersed with so-called complex spikes (Granit and Phillips, 1956). But documented cell type-specific features of the extracellular waveform or firing pattern are rare.
The advent of optogenetics (Section 5c) has made cell type-specific extracellular electrophysiology more routine. Neurons expressing fast light-gated channels, such as channelrhodopsin-2 (ChR2), can be identified by their short-latency spikes in response to brief flashes of light (phototagging) (Lima et al., 2009; Cohen et al., 2012). For example, this approach has been used successfully to record from identified GABAergic and dopaminergic neurons (Cohen et al., 2012) (Figure 6A). However, phototagging is more difficult for excitatory neurons in circuits with local recurrent connections, such as cortical projection neurons. Here photostimulation causes short-latency spikes not only in the ChR2-positive neurons, but also in downstream neurons, with overlapping latency distributions (O’Connor et al., 2013), which makes unambiguous identification of ChR2-positive neurons difficult.
Figure 6. Cell Type-specific Electrophysiology.

(A) Phototagging. GABAergic neurons express channelrhodopsin-2 (ChR2). Activating the ChR2-expressing neurons silences surrounding neurons. Right, extracellular recordings in the mouse motor cortex. Parvalbumin-positive, fast-spiking interneurons express ChR2, are thus activated by photostimulation. Photoactivating these neurons (IN) inhibits nearby pyramidal neurons (Pyr).
(B) Identifying specific types of projection neurons by antidromic photostimulation. Recordings are performed from pyramidal neurons while photostimulating axons expressing ChR2 in a specific projection zone. Because of recurrent excitatory connections, both neurons with photoexcited axons and downstream neurons in the recorded area can show spikes that are time-locked to the photostimulus with short latencies. Identifying neurons with axons photoexcited in the projection zone requires the collision test, bottom left. Axonal photostimulation (vertical blue line) evokes an action potential with 5 ms latency (arrow head). The antidromic action potential fails to invade the soma if an orthodromic action potential precedes the photostimulus within 5 ms of the photostimulus (bottom four traces); under these conditions the orthodromic and antidromic action potentials collide (Economo et al., 2017). The absence of the antidromic action potential after an orthodromic action potential implies that the recorded neurons projects to the photostimulated brain region. Bottom right, raster plot for the neuron corresponding to the collision test on the left. Rows, behavioral trials; dots, action potentials; vertical lines, different trial epochs.
(C) Targeted whole-cell recordings based on high-resolution microscopy. Right, recording from the Drosophila ellipsoid body during orienting behavior (Turner-Evans et al., 2017). Top trace, accumulated orientation. Bottom trace, membrane potential.
Since the earliest days of systems neurobiology, subtypes of excitatory projection neurons have been identified by antidromic activation of axons: recorded neurons that project to area A can be identified by electrical activation of axons in area A. This approach has provided insights into neural coding in the context of the organization of multi-regional neural circuits (Tanji and Evarts, 1976; Hahnloser et al., 2002). Optogenetic tagging can be achieved by photostimulation of axons in area A (Petreanu et al., 2007). Similar to the case of electrical stimulation, to exclude indirectly activated neurons, it is necessary to test for collisions between antidromic action potentials and orthodromic action potentials (Figure 6B), making this method technically challenging (Li et al., 2015). More general methods for identifying cell types in extracellular recordings are needed.
Cell type-specific electrophysiology has also been achieved with visually guided whole-cell or loose-seal recordings (Figure 6C). Transgenic animals expressing fluorescent proteins in defined neurons are becoming widely available. These fluorescent neurons can be targeted for recording under high-resolution microscopy. Visually guided recordings are routine in animals with small brains such as the fly (Bhandawat et al., 2007). They have also been used to record from superficial parts of the mouse brain (Gentet et al., 2012), but the need for high-resolution microscopy and access for electrodes makes this method impractical for deep brain structures. Cell type-specific whole cell or loose-seal recordings can still be achieved by blind recording with labeling of the recorded cell, followed by retrospective analysis of cell type-specific morphology or molecular markers (Lagler et al., 2016).
4f. Data analysis and interpretation
Perhaps the outstanding current challenge in neurophysiology is data handling and analysis (Harris et al., 2016). This challenge is amplified by the incredible throughput of new methods for Ca2+ imaging and electrophysiology. New microscopes and electrodes acquire data at rapidly increasing rates (up to 100 GB/hour), corresponding to recordings from hundreds to thousands of neurons simultaneously. In Ca2+ imaging, fluorescence dynamics is only an indirect read-out of the activity of neurons (http://im-phys.org/). Multiple computational steps are required to extract signals related to neural activity. Limitations in signal-to-noise ratio and imaging speed, non-linearities of Ca2+ and GECIs, and variations in biophysical parameters across cells, make the extraction of physiological signals, such as spike times, challenging. Several algorithms and software packages are available to extract ‘events’ from Ca2+ imaging data (Pnevmatikakis et al., 2016; Theis et al., 2016; Berens et al., 2018). However, different algorithms are optimized for different imaging conditions and different applications. Ideally, analysis methods are benchmarked in a consistent manner against ground truth data (i.e., simultaneous recordings of electrophysiology and fluorescence imaging). But currently this data is only available in small quantities and for few use-cases. Simultaneous recordings are simply not feasible with all types of instrumentation. As a result, existing algorithms are not deeply characterized. The mapping between Ca2+-dependent fluorescence and neural activity remains imprecise and biased. More principled methods for analyzing functional imaging data are an urgent need.
Similar challenges hold for extracellular electrophysiology. A single electrode detects signals from multiple neurons. These neurons are isolated using the process of ‘spike sorting’, a set of computational methods interspersed with manual curation. Spike sorting involves the detection of spikes, followed by waveform analysis to distinguish spikes belonging to different neurons (Lewicki, 1998). Recent algorithms have made use of the parallelization provided by GPU computing to overcome computational bottlenecks in large-scale spike sorting (Pachitariu et al., 2016; Jun et al., 2017a). However, spike sorting remains time-consuming and error-prone. Similar to the situation with Ca2+ imaging, little ground truth data exists. Better and automated methods for spike sorting and principled metrics of spike sorting quality are necessary (Chung et al., 2017).
4g. Summary and future directions
Each neurophysiological method has a defined niche. Ca2+ imaging is widely used to measure activity in populations of neurons, but it has some notable disadvantages. In particular, the dynamics of Ca2+ imaging with GECIs (> 100 ms) are too slow to track the signal flow in neural circuits during behavior (Chen et al., 2013). Ca2+ imaging is a nonlinear and biased readout of neural activity (Peron et al., 2015a) (http://im-phys.org/). Furthermore, in larger mammalian brains, imaging has limited spatial reach. Extracellular electrophysiology measures neural activity with millisecond precision and can be used to record activity across the entire brain. In contrast to imaging, extracellular electrophysiology is more challenging to perform in a cell type-specific manner and has trouble detecting activity in rare cell types. Understanding these properties of the different neurophysiological methods is critical for their effective deployment.
Simultaneous recordings from hundreds to thousands of neurons are now routine. The dynamics of neuronal populations are fundamentally more informative than single neurons. After all, an organism uses the collective activity of large populations of neurons for computation and behavior. Many so-called dimensionality reduction methods have been proposed that extract features of population dynamics that are critical to behavior (Cunningham and Yu, 2014). Relating these computational methods to cell types and neural circuits remains a challenge for the future.
5. Cell Type-specific Manipulation
5a. Overview
Recording neuronal activity during behavior (Section 4) generates hypotheses about the meaning of patterns of neural activity. These hypotheses can be tested by manipulating activity in defined neuronal populations. Classical methods, such as surgical lesions and pharmacological manipulations, are invasive and lack specificity for particular cell types. In the case of lesions, adaptive rewiring after the surgery complicates the interpretation of the functional effects (Otchy et al., 2015). Experiments involving electrical microstimulation during behavior have led to major discoveries about the neural basis of perception (Salzman et al., 1990). However, microstimulation excites excitatory and inhibitory neurons, as well as axons of passage, complicating the interpretation of these experiments in terms of neural circuits. Below we discuss cell type-specific methods of activation and inactivation. We focus on inducible and reversible methods based on expressed receptors and channels, activated either by small molecules or light.
5b. Chemogenetics
Technologies are now available to manipulate genetically identified neurons using small molecule ligands (Sternson and Roth, 2014). These systems are based on engineered receptors and channels that interact with these ligands (chemogenetics). Small molecule-activated systems generally have different properties than light-activated systems (discussed in Section 5c below), which make them useful for distinct applications, especially in larger mammalian brains. For example, small molecules can be delivered systemically, allowing manipulation of cells distributed over large brain volumes. Manipulations lasting hours and even days are possible, without tethers or head-mounted apparatus. Small molecule-activated systems could also have clinical applications for treating brain disorders. On the other hand, the delivery (> minutes) and clearance (hours) of small molecule drugs is too slow to make them useful to interfere with specific phases of behavior.
The ideal chemogenetic system has several key properties. First, the expressed proteins should minimally affect endogenous signaling and show no activity in the absence of ligand. Second, the ligand needs to specifically activate the recombinant receptor with high affinity, and have no biological activity in the absence of the engineered receptor. Third, the ligand should have favorable pharmacokinetic properties. For example, the ligand must be sufficiently inert to spread across the brain before clearance. Since direct infusion of small molecules into the brain is invasive, the ligand ideally should cross the blood-brain barrier.
Proof-of-principle systems for neuronal inactivation include modified synaptic molecules that inhibit synaptic transmission with addition of small molecule crosslinkers (Karpova et al., 2005), or non-native G-protein receptors and channels and their ligands (Lima and Miesenbock, 2005; Tan et al., 2006). These systems were not widely adopted, in part because their ligands do not cross the blood-brain barrier and thus have to be directly injected into neural tissue.
An important advance was the development of DREADDs (Designer Receptors Exclusively Activated by Designer Drug), which are now widely used (Armbruster et al., 2007). DREADDs are based on muscarinic receptors that can be activated by clozapine N-oxide (CNO), a derivative of the atypical antipsychotic clozapine. Different DREADD variants activate different G-protein coupled pathways with distinct cellular effects. hM4Di-DREADD has been used for neuronal silencing via Gαi-mediated activation of inwardly rectifying K+ channels. hM4Di-DREADD also suppresses synaptic release probability via presynaptic inhibition (Stachniak et al., 2014). hM3Dq-DREADD activates neurons via Gαq signaling. DREADDs have been used in dozens of studies to activate and inactivate neurons in vitro and in vivo in the context of behavior. However, it was recently shown that upon administration, CNO efficiently turns into clozapine, which enters the brain to activate DREADDs (Gomez et al., 2017). The effects of clozapine on neural circuits are thus a major concern with DREADD-mediated modulation of neural activity. In addition, G-protein coupled receptors may activate intracellular signaling involved in synaptic plasticity and other cellular functions.
Ligand gated ion channels (LGIC) have also been exploited for manipulation of neural activity. LGICs directly control the excitability of cells. Local activation of glutamate and GABA receptors has long been used in systems neuroscience to activate and inactivate brain regions, respectively (Hikosaka and Wurtz, 1985). Engineered chemogenetic LGICs provide for cell type-specific manipulation. One strategy relies on expression of the ivermectin (IVM)-gated Cl− channel (GluCl). Ivermectin increases the Cl− conductance of the membrane, shunting action potential generation (Lerchner et al., 2007). The GluCl/IVM system has problems as a silencing strategy. First, ivermectin is a glutamate receptor agonist. The effective ivermectin concentrations may produce non-specific effects and toxicity. Second, ivermectin-dependent silencing is only slowly reversible (~ days), opening up the possibility of compensatory circuit plasticity.
An elegant technology is based on engineered LGICs and ligands (Magnus et al., 2011). The ligand-binding domain of the α7 nicotinic acetylcholine receptor is a modular actuator of the large Cys-loop ionotropic receptor family, which includes both activating cation channels and inhibiting chloride channels. The ligand-binding domain was mutated to bind non-natural ligands (PSEMs) and to abolish sensitivity to acetylcholine. Cation channels were generated by fusing ligand-binding domains to the 5HT3 receptor ion pore domain. Neurons expressing these channels depolarized and fired action potentials after PSEM application. Inhibiting chloride channels were engineered by fusing the ligand binding domains to Gly or GABA receptor ion pore domains. Activating these channels with PSEM application causes strong shunting inhibition and silencing. Even strongly driven neurons can be silenced (Lovett-Barron et al., 2012). However, at effective concentrations, current versions of PSEMs have sedative effects on behavior, with unknown mechanisms (Kato et al., 2013).
In conclusion, although great strides have been made in the development of chemogenetic methods, the ideal tools are yet to be invented. Existing tools suffer from limitations related to non-specific effects of the small molecule ligands. Advances in engineering ligand-receptor pairs, with a focus on ligands with high specificity, are expected to address this issue in the future.
5c. Optogenetics
Manipulation of genetically modified neurons with light, dubbed ‘optogenetics,’ has had a stunning impact on brain research (Fenno et al., 2011). Optogenetics is widely used to activate and inactivate genetically defined neurons with light, using a large and growing list of microbial opsins. Channelrhodopsins (ChRs) are typically nonspecific cation channels that depolarize neurons in response to blue light (but see below). Halorhodopsins hyperpolarize neurons in response to yellow light by pumping Cl− ions into the cell. Bacteriorhodopsins hyperpolarize neurons in response to green light, by pumping protons out of the cell.
Depolarizing ChRs can be used to manipulate neurons with millisecond timescale precision. Action potentials are elicited by illuminating the cell bodies, dendrites, or axons of ChR-expressing neurons. Fast ChR versions (Cheta, Chronos) can transduce light pulses into action potentials at rates up to 100 Hz (Gunaydin et al., 2010; Klapoetke et al., 2014). Slow ChRs can depolarize neurons over times of seconds or longer (step opsins) with transient light stimuli (Berndt et al., 2009). Engineered and natural ChR variants have distinct absorption spectra. The classic ChR2 has peak absorption around 470 nm (Nagel et al., 2003). Blue light is strongly absorbed by tissue (especially blood) (Svoboda and Block, 1994). As a consequence the spread of blue light is limited (200 μm mean free path in mammalian tissue). ReaChR (Lin et al., 2013), Chrimson (Klapoetke et al., 2014), and other ChRs have peak absorption at 600 nm and beyond, where absorption by blood drops off precipitously. Red-shifted ChRs are thus more easily excited across larger tissue volumes and are also compatible with imaging green fluorescent molecules, such as GCaMP. Importantly, ChRs are relatively efficient, admitting 1000’s of cations per absorbed photon (Nagel et al., 2003). It is thus possible to express ChRs at modest levels, and achieve efficient photostimulation of neurons with innocuous light intensities (1 mW/mm2).
Hyperpolarizing opsin pumps, including the Cl− pump halorhodopsin (Han and Boyden, 2007; Zhang et al., 2007) and the proton pump Arch (Chow et al., 2010), are useful for cell type-specific silencing. Opsin pumps typically have slower effects on neuronal membrane potential and spike rates (100’s of milliseconds) than ChRs. This is in part due slower kinetics, but also because of the neuronal membrane time constant. Opsin pumps are less efficient than ChRs, since they move at most one elementary charge across the membrane per photon. For this reason opsin pumps need to be expressed at very high levels and require intense light (> 1 mW/mm2) for efficient silencing. Heating and toxicity are a concern. In addition, the efficacy of opsin-mediated silencing runs down over time.
A powerful new tool for optogenetic silencing is based on anion-conducting ChRs (Berndt et al., 2014; Wietek et al., 2014). The most powerful reagent is based on the naturally occurring light-gated Cl− channels GtACR1 and GtACR2, cloned from the alga Guillardia theta (Govorunova et al., 2015). GtACR1 and GtACR2 have relatively large chloride-selective conductances and silence neurons in vitro and in vivo with high efficacy (Mahn et al., 2017).
Optogenetics is most often performed with one-photon excitation, which can be achieved with cheap, low-power lasers. One-photon photostimulation is roughly uniform over tissue volumes on the order of one cubic millimeter per light source. For targeted stimulation, opsins can be excited by two-photon excitation (Rickgauer et al., 2014). The localization of excitation provided by two-photon excitation allows photostimulation of single neurons in intact tissue. Two-photon excitation requires expensive lasers and other specialized equipment. However, when combined with cellular imaging of neural activity, two-photon excitation allows manipulation of neurons based on their activity patterns recorded in separate imaging experiments. This approach may allow tests of long-held hypotheses about activity in ensembles of neurons and behavior.
5d. Other methods
Thermogenetics refers to a set of tools in which neurons are manipulated using changes in temperature (Bernstein et al., 2012). These methods have mostly been applied in flies. Reversible inactivation of synaptic transmission has been achieved using shibirets, a dominant temperature-sensitive mutation of Drosophila dynamin. Inactivation is triggered by raising the temperature from room temperature to ~30°C. At elevated temperatures endocytosis of synaptic vesicles ceases, leading to rundown of synaptic transmission. Induction and reversal occurs within a few minutes after the temperature shift (Koenig et al., 1983; Kitamoto, 2001). In Drosophila, shibirets has been used to dissect the circuits underlying memory formation, courtship behavior, and olfactory processing, among many other applications. Thermogenetic activation has been achieved with temperature-sensitive Transient Receptor Potential (TRP) channels (thermoTRPs) (Hamada et al., 2008). ThermoTRPs are cation channels that open in response to temperature shifts as small as 2°C (Bernstein et al., 2012).
In some experiments it is preferable to remove neurons from a circuit over long time scales. For example, the effects of acute lesions could be larger than chronic lesions, revealing adaptive changes in neural circuits (Otchy et al., 2015). A useful method for cell type-specific ablation in mice is to target the diphtheria toxin receptor to specific cell types (Luquet et al., 2005). These cells can then be ablated to by application of the diphtheria toxin. Specific cell types can also be silenced by inducible expression of tetanus neurotoxin light chain (Yamamoto et al., 2003), which cleaves snare proteins that are critical for synaptic transmission. These manipulations of neural circuits lack temporal specificity, but the size of the perturbation can be rigorously quantified by counting the affected neurons.
5e. Calibrating and interpreting manipulation experiments
Thirty years ago Francis Crick proposed a list of tools that would be important to understanding brain function, including methods for activation and inactivation of specific cell types, while leaving other cells more or less unaltered (Crick, 1988). These tools are now widely available. Their use has laid bare experimental and conceptual challenges in interpreting these perturbation experiments (Otchy et al., 2015; Jazayeri and Afraz, 2017).
Modulation of neural activity in genetically targeted neurons has provided insights into the roles of specific cell types in controlling brain processes and behavior. The clearest results have come from brain regions in which cell types act as labeled lines that control specific behaviors (Betley et al., 2013; Peng et al., 2015) or from manipulation of neuromodulatory systems (Steinberg et al., 2013).
More generally, in highly connected neural circuits in the middle of the brain, neurons and neural circuits often respond to manipulations in complex, multi-phasic, and non-monotonic ways (Phillips and Hasenstaub, 2016). The responses depend on the strength, duration, and spatial extent of the photostimulus as well as the spatial distribution of the optogenetic reagent. (These important variables are rarely documented in publications.) Deriving biological insight from optogenetic experiments requires careful characterization of the dynamics of the stimulated neurons and downstream neurons and brain areas using neurophysiology and benefit from models of neural circuits (Li et al., 2016; Phillips and Hasenstaub, 2016). Below we highlight a few examples of surprising effects of optogenetic manipulation.
The brain is intrinsically active. Optogenetically silencing excitatory neurons causes recovery from synaptic depression caused by ongoing activity and reduces activity in downstream inhibitory neurons; offset of the photostimulus then produces a burst of excitation, the so-called rebound response (Guo et al., 2015). The rebound can propagate through neural circuits and cause behavioral responses. In other words, neural inactivation also triggers activation. Similarly, optogenetic activation of neurons can cause inactivation (Herman et al., 2014).
The dynamics of local circuits can produce more subtle effect. For example, activity in cortical circuits is stabilized by local feedback inhibition, which implies that spike rates of inhibitory and excitatory neurons are coupled, on average (van Vreeswijk and Sompolinsky, 1996). As a result, optogenetic stimulation (e.g. by ChR) of GABAergic neurons can actually decrease the spike rates of these same GABAergic neurons. This effect, which has long been predicted by models of cortical circuits (Tsodyks et al., 1997), is caused by loss of driving excitatory input. Strong and phasic stimulation of GABAergic neurons overwhelms this coupling and spike rates of excitatory neurons go to zero. This regime corresponds to ‘photoinhibition’, a method in which GABAergic neurons are photostimulated to silence a brain region (Guo et al., 2014). Similarly, the effects of manipulating specific types of GABAergic interneurons on principal cells is highly dependent on details of the experiment so that minor methodological changes can lead to qualitatively different conclusions (Phillips and Hasenstaub, 2016).
Complex effects of optogenetic manipulation have been observed at the level of multi-regional circuits. For example, inactivating the anterior lateral motor cortex abolishes activity in downstream thalamic regions, but has little effect on strongly connected cortical areas (Guo et al., 2017). The system response to optogenetic manipulation can reveal interesting aspects of the organization of neural circuits and the relationship of activity to animal behavior (Li et al., 2016). Characterization of secondary effects of optogenetic stimulation has led to discoveries of unexpected connections in neural circuits (Olsen et al., 2012; Guo et al., 2017) (Figure 7). Linking manipulation and behavior in these situations requires the neurophysiological characterization of the system response to optogenetic stimulation.
Figure 7. Circuit Response to Optogenetic Stimulation of Layer 6 Corticothalamic Neurons.
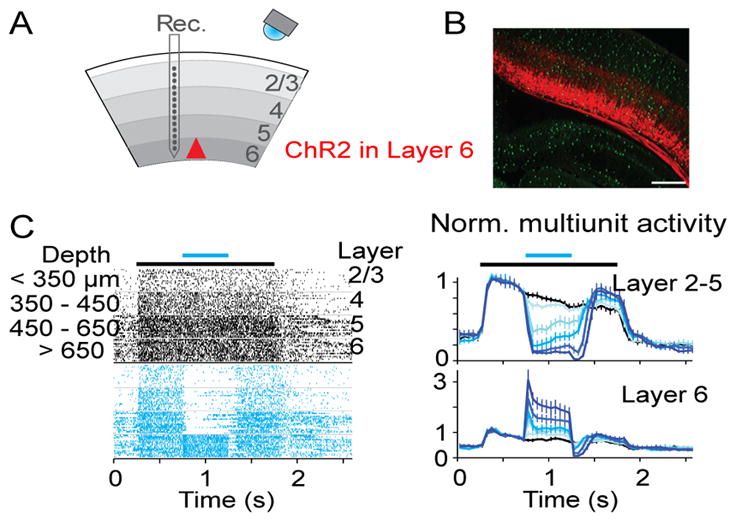
(A) Schematic of the experiment.
(B) Cre-dependent expression of red fluorescent protein in Ntsr1-cre mice. Expression is limited to thalamus-projecting layer 6 neurons.
(C) Extracellular recordings in the primary visual cortex. Multi-unit responses with (blue) and without (black) layer 6 photostimulation. Left, raster plot, grouped by depth. Black bar: visual stimulus; blue bar: LED illumination. Right, normalized peristimulus time histogram; top: upper layers; bottom: layer 6. Hues of blue correspond to different photostimulus intensities (light, low; dark, high; black, unstimulated).
5f. Summary and future directions
Cell type-specific methods for activation and inactivation are now a routine part of the experimental toolbox. Chemogenetic systems are ideal for spatially widely distributed neural populations, but have relatively poor temporal resolution. Optogenetic systems have excellent temporal resolution, but light is difficult to deliver over large tissue volumes, limiting applications in larger mammalian brains. Ultrasound and magnetic fields can be delivered deep into tissue. Systems activated by ultrasound or magnetic fields could have a large impact.
Neural activity patterns in the brain exhibit specificity beyond cell types. For example, only sparse subsets of CA1 pyramidal neurons express place field in particular locations and environments. Strategies therefore need to be developed that allow activation and inactivation based on behavior-related activity patterns of ensembles of neurons; these ensembles may be distributed across multiple cell types. This can potentially be achieved by version of the activity traps discussed in Section 2d. However, more precise capture of active neurons would be triggered by activity and light. In these systems gene expression would be controlled by the conjunction of light and neural activity.
Optogenetic manipulation experiments are now routinely performed in combination with recordings from hundreds to thousands of neurons. Rapid manipulations of groups of neurons cause complex responses in the connected neural circuit. These responses are highly informative about computation in neural circuits, but interpreting the neural dynamics ultimately requires new approaches to modeling neural circuits.
6. Conclusions and Outlook
Ten years ago, at the time of the first Primer, genetic analysis of neural circuits was a nascent field, especially in the mammalian brain. The first generation of cell type-specific driver and reporter lines had just been made. Channelrhodopsin-2 had recently been cloned, ringing in the optogenetics era. Imaging neurons with genetically encoded indicators of neural function was just at the very beginning. Few studies had linked quantitative analysis of behavior with cell type-specific neurophysiology and manipulation. Since then genetic analysis of neural circuits has exploded into a vibrant and rapidly developing field. This is in part due to the rapid proliferation of powerful methods and resources for analyzing neural circuits, catalyzed in part by support from the Brain Research through Advancing Innovative Neurotechnologies (BRAIN) initiative (Jorgenson et al., 2015).
The next decade will likely be similarly transformative, in part because of the availability of large-scale resources. Projects are currently under way to produce a complete census of the brain’s cell types using transcriptomic and anatomical methods. Knowledge of cellular gene expression patterns will provide access to most cell types in the intact brains of genetically tractable organisms for recording and manipulation. Large-scale electron microscopy is producing dense reconstructions of local circuits and even the entire brains of the fruit fly. Together these resources will provide a near complete parts list for the brain and a coherent picture of the structure of neural circuits in terms of genetically defined cell types.
An exciting emerging area is cell type-specific analysis of neural circuits in organisms that were not traditionally amenable to genetic analysis. This is made possible by genome engineering based on CRISPR/Cas9 and related methods; developing viral vectors that produce cell type-specific expression will further enhance this endeavor. Linking neural activity in defined cell types to behavior is now routine. However, behavior is the result of coordinated patterns of neural activity across multi-regional neural circuits. A major challenge is to link neural structure with neural dynamics across spatially extended neural networks, ideally in individual animals. Major efforts are under way to map neural activity at the level of the entire brain, using recently developed high-density electrodes (https://www.internationalbrainlab.com/). However, brain-wide analysis of activity is only at the beginning, especially with respect to cell type-specific analysis.
The central goal in neuroscience is to elucidate the principles underlying brain function. This requires linking the structure of neural circuits to their dynamics and to computation and behavior. Hypotheses need to be translated into well-defined quantitative models that take current knowledge about neural circuits and the biophysics of specific cell types into account. Brain research needs a new kind of theoretical neuroscience that takes the structure of neural circuits into account.
In a sequel to their 2008 primer on genetic dissection of neural circuits, Luo, Callaway, and Svoboda evaluate key advances over the past decade on cell type-specific anatomical, neurophysiological, and perturbation studies to link neurons and neural circuits to behavior.
Acknowledgments
We thank members of our laboratories and our colleagues for useful discussions, and NIH (LL, EMC), NSF (LL, EMC), and HHMI (LL, KS) for research support.
Footnotes
Publisher's Disclaimer: This is a PDF file of an unedited manuscript that has been accepted for publication. As a service to our customers we are providing this early version of the manuscript. The manuscript will undergo copyediting, typesetting, and review of the resulting proof before it is published in its final citable form. Please note that during the production process errors may be discovered which could affect the content, and all legal disclaimers that apply to the journal pertain.
References
- Ahrens MB, Orger MB, Robson DN, Li JM, Keller PJ. Whole-brain functional imaging at cellular resolution using light-sheet microscopy. Nat Methods. 2013;10:413–420. doi: 10.1038/nmeth.2434. [DOI] [PubMed] [Google Scholar]
- Albadri S, Del Bene F, Revenu C. Genome editing using CRISPR/Cas9-based knock-in approaches in zebrafish. Methods. 2017;121–122:77–85. doi: 10.1016/j.ymeth.2017.03.005. [DOI] [PubMed] [Google Scholar]
- Allen WE, DeNardo LA, Chen MZ, Liu CD, Loh KM, Fenno LE, Ramakrishnan C, Deisseroth K, Luo L. Thirst-associated preoptic neurons encode an aversive motivational drive. Science. 2017a;357:1149–1155. doi: 10.1126/science.aan6747. [DOI] [PMC free article] [PubMed] [Google Scholar]
- Allen WE, Kauvar IV, Chen MZ, Richman EB, Yang SJ, Chan K, Gradinaru V, Deverman BE, Luo L, Deisseroth K. Global Representations of Goal-Directed Behavior in Distinct Cell Types of Mouse Neocortex. Neuron. 2017b;94:891–907e896. doi: 10.1016/j.neuron.2017.04.017. [DOI] [PMC free article] [PubMed] [Google Scholar]
- Armbruster BN, Li X, Pausch MH, Herlitze S, Roth BL. Evolving the lock to fit the key to create a family of G protein-coupled receptors potently activated by an inert ligand. Proc Natl Acad Sci U S A. 2007;104:5163–5168. doi: 10.1073/pnas.0700293104. [DOI] [PMC free article] [PubMed] [Google Scholar]
- Aso Y, Hattori D, Yu Y, Johnston RM, Iyer NA, Ngo TT, Dionne H, Abbott LF, Axel R, Tanimoto H, et al. The neuronal architecture of the mushroom body provides a logic for associative learning. eLife. 2014;3:e04577. doi: 10.7554/eLife.04577. [DOI] [PMC free article] [PubMed] [Google Scholar]
- Beier KT, Kim CK, Hoerbelt P, Hung LW, Heifets BD, DeLoach KE, Mosca TJ, Neuner S, Deisseroth K, Luo L, et al. Rabies screen reveals GPe control of cocaine-triggered plasticity. Nature. 2017;549:345–350. doi: 10.1038/nature23888. [DOI] [PMC free article] [PubMed] [Google Scholar]
- Beier KT, Steinberg EE, DeLoach KE, Xie S, Miyamichi K, Schwarz L, Gao XJ, Kremer EJ, Malenka RC, Luo L. Circuit Architecture of VTA Dopamine Neurons Revealed by Systematic Input-Output Mapping. Cell. 2015;162:622–634. doi: 10.1016/j.cell.2015.07.015. [DOI] [PMC free article] [PubMed] [Google Scholar]
- Bellen HJ, O’Kane CJ, Wilson C, Grossniklaus U, Pearson RK, Gehring WJ. P-element-mediated enhancer detection: a versatile method to study development in Drosophila. Genes Dev. 1989;3:1288–1300. doi: 10.1101/gad.3.9.1288. [DOI] [PubMed] [Google Scholar]
- Berens P, Freeman J, Deneux T, Chenkov N, McColgan T, Speiser A, Macke JH, Turaga S, Mineault P, Rupprecht P, et al. Community-based benchmarking improves spike rate inference from two-photon calcium imaging data. bioRxiv. 2018 doi: 10.1101/177956. [DOI] [PMC free article] [PubMed] [Google Scholar]
- Berndt A, Lee SY, Ramakrishnan C, Deisseroth K. Structure-guided transformation of channelrhodopsin into a light-activated chloride channel. Science. 2014;344:420–424. doi: 10.1126/science.1252367. [DOI] [PMC free article] [PubMed] [Google Scholar]
- Berndt A, Yizhar O, Gunaydin LA, Hegemann P, Deisseroth K. Bi-stable neural state switches. Nat Neurosci. 2009;12:229–234. doi: 10.1038/nn.2247. [DOI] [PubMed] [Google Scholar]
- Bernstein JG, Garrity PA, Boyden ES. Optogenetics and thermogenetics: technologies for controlling the activity of targeted cells within intact neural circuits. Curr Opin Neurobiol. 2012;22:61–71. doi: 10.1016/j.conb.2011.10.023. [DOI] [PMC free article] [PubMed] [Google Scholar]
- Betley JN, Cao ZF, Ritola KD, Sternson SM. Parallel, redundant circuit organization for homeostatic control of feeding behavior. Cell. 2013;155:1337–1350. doi: 10.1016/j.cell.2013.11.002. [DOI] [PMC free article] [PubMed] [Google Scholar]
- Bhandawat V, Olsen SR, Gouwens NW, Schlief ML, Wilson RI. Sensory processing in the Drosophila antennal lobe increases reliability and separability of ensemble odor representations. Nat Neurosci. 2007;10:1474–1482. doi: 10.1038/nn1976. [DOI] [PMC free article] [PubMed] [Google Scholar]
- Bier E, Vaessin H, Shepherd S, Lee K, McCall K, Barbel S, Ackerman L, Carretto R, Uemura T, Grell E, et al. Searching for pattern and mutation in the Drosophila genome with a P-lacZ vector. Genes Dev. 1989;3:1273–1287. doi: 10.1101/gad.3.9.1273. [DOI] [PubMed] [Google Scholar]
- Binzegger T, Douglas RJ, Martin KA. A quantitative map of the circuit of cat primary visual cortex. J Neurosci. 2004;24:8441–8453. doi: 10.1523/JNEUROSCI.1400-04.2004. [DOI] [PMC free article] [PubMed] [Google Scholar]
- Bozza T, McGann JP, Mombaerts P, Wachowiak M. In vivo imaging of neuronal activity by targeted expression of a genetically encoded probe in the mouse. Neuron. 2004;42:9–21. doi: 10.1016/s0896-6273(04)00144-8. [DOI] [PubMed] [Google Scholar]
- Brand AH, Perrimon N. Targeted gene expression as a means of altering cell fates and generating dominant phenotypes. Development. 1993;118:401–415. doi: 10.1242/dev.118.2.401. [DOI] [PubMed] [Google Scholar]
- Braz JM, Rico B, Basbaum AI. Transneuronal tracing of diverse CNS circuits by Cre-mediated induction of wheat germ agglutinin in transgenic mice. Proc Natl Acad Sci U S A. 2002;99:15148–15153. doi: 10.1073/pnas.222546999. [DOI] [PMC free article] [PubMed] [Google Scholar]
- Briggman KL, Helmstaedter M, Denk W. Wiring specificity in the direction-selectivity circuit of the retina. Nature. 2011;471:183–188. doi: 10.1038/nature09818. [DOI] [PubMed] [Google Scholar]
- Callaway EM, Luo L. Monosynaptic Circuit Tracing with Glycoprotein-Deleted Rabies Viruses. J Neurosci. 2015;35:8979–8985. doi: 10.1523/JNEUROSCI.0409-15.2015. [DOI] [PMC free article] [PubMed] [Google Scholar]
- Cao G, Platisa J, Pieribone VA, Raccuglia D, Kunst M, Nitabach MN. Genetically targeted optical electrophysiology in intact neural circuits. Cell. 2013;154:904–913. doi: 10.1016/j.cell.2013.07.027. [DOI] [PMC free article] [PubMed] [Google Scholar]
- Cao J, Packer JS, Ramani V, Cusanovich DA, Huynh C, Daza R, Qiu X, Lee C, Furlan SN, Steemers FJ, et al. Comprehensive single-cell transcriptional profiling of a multicellular organism. Science. 2017;357:661–667. doi: 10.1126/science.aam8940. [DOI] [PMC free article] [PubMed] [Google Scholar]
- Capecchi MR. Altering the genome by homologous recombination. Science. 1989;244:1288–1292. doi: 10.1126/science.2660260. [DOI] [PubMed] [Google Scholar]
- Chamberland S, Yang HH, Pan MM, Evans SW, Guan S, Chavarha M, Yang Y, Salesse C, Wu H, Wu JC, et al. Fast two-photon imaging of subcellular voltage dynamics in neuronal tissue with genetically encoded indicators. eLife. 2017;6:e25690. doi: 10.7554/eLife.25690. [DOI] [PMC free article] [PubMed] [Google Scholar]
- Chatterjee S, Sullivan HA, MacLennan BJ, Xu R, Hou Y, Lavin TK, Lea NE, Michalski JE, Babcock KR, Dietrich S, et al. Nontoxic, double-deletion-mutant rabies viral vectors for retrograde targeting of projection neurons. Nat Neurosci. 2018 doi: 10.1038/s41593-018-0091-7. [DOI] [PMC free article] [PubMed] [Google Scholar]
- Chen BL, Hall DH, Chklovskii DB. Wiring optimization can relate neuronal structure and function. Proc Natl Acad Sci U S A. 2006;103:4723–4728. doi: 10.1073/pnas.0506806103. [DOI] [PMC free article] [PubMed] [Google Scholar]
- Chen KH, Boettiger AN, Moffitt JR, Wang S, Zhuang X. RNA imaging. Spatially resolved, highly multiplexed RNA profiling in single cells. Science. 2015;348:aaa6090. doi: 10.1126/science.aaa6090. [DOI] [PMC free article] [PubMed] [Google Scholar]
- Chen S, Lee B, Lee AY, Modzelewski AJ, He L. Highly Efficient Mouse Genome Editing by CRISPR Ribonucleoprotein Electroporation of Zygotes. J Biol Chem. 2016;291:14457–14467. doi: 10.1074/jbc.M116.733154. [DOI] [PMC free article] [PubMed] [Google Scholar]
- Chen TW, Wardill TJ, Sun Y, Pulver SR, Renninger SL, Baohan A, Schreiter ER, Kerr RA, Orger MB, Jayaraman V, et al. Ultrasensitive fluorescent proteins for imaging neuronal activity. Nature. 2013;499:295–300. doi: 10.1038/nature12354. [DOI] [PMC free article] [PubMed] [Google Scholar]
- Cheng HJ, Nakamoto M, Bergemann AD, Flanagan JG. Complementary gradients in expression and binding of ELF-1 and Mek4 in development of the topographic retinotectal projection map. Cell. 1995;82:371–381. doi: 10.1016/0092-8674(95)90426-3. [DOI] [PubMed] [Google Scholar]
- Chiang AS, Lin CY, Chuang CC, Chang HM, Hsieh CH, Yeh CW, Shih CT, Wu JJ, Wang GT, Chen YC, et al. Three-dimensional reconstruction of brain-wide wiring networks in Drosophila at single-cell resolution. Curr Biol. 2011;21:1–11. doi: 10.1016/j.cub.2010.11.056. [DOI] [PubMed] [Google Scholar]
- Chow BY, Han X, Dobry AS, Qian X, Chuong AS, Li M, Henninger MA, Belfort GM, Lin Y, Monahan PE, et al. High-performance genetically targetable optical neural silencing by light-driven proton pumps. Nature. 2010;463:98–102. doi: 10.1038/nature08652. [DOI] [PMC free article] [PubMed] [Google Scholar]
- Chung JE, Magland JF, Barnett AH, Tolosa VM, Tooker AC, Lee KY, Shah KG, Felix SH, Frank LM, Greengard LF. A Fully Automated Approach to Spike Sorting. Neuron. 2017;95:1381–1394. e1386. doi: 10.1016/j.neuron.2017.08.030. [DOI] [PMC free article] [PubMed] [Google Scholar]
- Ciabatti E, Gonzalez-Rueda A, Mariotti L, Morgese F, Tripodi M. Life-Long Genetic and Functional Access to Neural Circuits Using Self-Inactivating Rabies Virus. Cell. 2017;170:382–392. e314. doi: 10.1016/j.cell.2017.06.014. [DOI] [PMC free article] [PubMed] [Google Scholar]
- Cohen JY, Haesler S, Vong L, Lowell BB, Uchida N. Neuron-type-specific signals for reward and punishment in the ventral tegmental area. Nature. 2012;482:85–88. doi: 10.1038/nature10754. [DOI] [PMC free article] [PubMed] [Google Scholar]
- Cong L, Ran FA, Cox D, Lin S, Barretto R, Habib N, Hsu PD, Wu X, Jiang W, Marraffini LA, et al. Multiplex genome engineering using CRISPR/Cas systems. Science. 2013;339:819–823. doi: 10.1126/science.1231143. [DOI] [PMC free article] [PubMed] [Google Scholar]
- Costa M, Manton JD, Ostrovsky AD, Prohaska S, Jefferis GS. NBLAST: Rapid, Sensitive Comparison of Neuronal Structure and Construction of Neuron Family Databases. Neuron. 2016;91:293–311. doi: 10.1016/j.neuron.2016.06.012. [DOI] [PMC free article] [PubMed] [Google Scholar]
- Cowan WM. The emergence of modern neuroanatomy and developmental neurobiology. Neuron. 1998;20:413–426. doi: 10.1016/s0896-6273(00)80985-x. [DOI] [PubMed] [Google Scholar]
- Cox CL, Denk W, Tank DW, Svoboda K. Action potentials reliably invade axonal arbors of rat neocortical neurons. Proc Natl Acad Sci U S A. 2000;97:9724–9728. doi: 10.1073/pnas.170278697. [DOI] [PMC free article] [PubMed] [Google Scholar]
- Crick F. What Mad Pursuit: A Personal View of Scientific Discovery. Sloan Foundation; 1988. [Google Scholar]
- Crocker A, Guan XJ, Murphy CT, Murthy M. Cell-Type-Specific Transcriptome Analysis in the Drosophila Mushroom Body Reveals Memory-Related Changes in Gene Expression. Cell Reports. 2016;15:1580–1596. doi: 10.1016/j.celrep.2016.04.046. [DOI] [PMC free article] [PubMed] [Google Scholar]
- Cui G, Jun SB, Jin X, Pham MD, Vogel SS, Lovinger DM, Costa RM. Concurrent activation of striatal direct and indirect pathways during action initiation. Nature. 2013;494:238–242. doi: 10.1038/nature11846. [DOI] [PMC free article] [PubMed] [Google Scholar]
- Cunningham JP, Yu BM. Dimensionality reduction for large-scale neural recordings. Nat Neurosci. 2014;17:1500–1509. doi: 10.1038/nn.3776. [DOI] [PMC free article] [PubMed] [Google Scholar]
- Dana H, Mohar B, Sun Y, Narayan S, Gordus A, Hasseman JP, Tsegaye G, Holt GT, Hu A, Walpita D, et al. Sensitive red protein calcium indicators for imaging neural activity. eLife. 2016;5 doi: 10.7554/eLife.12727. [DOI] [PMC free article] [PubMed] [Google Scholar]
- Datta SR, Vasconcelos ML, Ruta V, Luo S, Wong A, Demir E, Flores J, Balonze K, Dickson BJ, Axel R. The Drosophila pheromone cVA activates a sexually dimorphic neural circuit. Nature. 2008;452:473–477. doi: 10.1038/nature06808. [DOI] [PubMed] [Google Scholar]
- DeFalco J, Tomishima M, Liu H, Zhao C, Cai X, Marth JD, Enquist L, Friedman JM. Virus-assisted mapping of neural inputs to a feeding center in the hypothalamus. Science. 2001;291:2608–2613. doi: 10.1126/science.1056602. [DOI] [PubMed] [Google Scholar]
- DeNardo L, Luo L. Genetic strategies to access activated neurons. Curr Opin Neurobiol. 2017;45:121–129. doi: 10.1016/j.conb.2017.05.014. [DOI] [PMC free article] [PubMed] [Google Scholar]
- Deverman BE, Pravdo PL, Simpson BP, Kumar SR, Chan KY, Banerjee A, Wu WL, Yang B, Huber N, Pasca SP, et al. Cre-dependent selection yields AAV variants for widespread gene transfer to the adult brain. Nat Biotechnol. 2016;34:204–209. doi: 10.1038/nbt.3440. [DOI] [PMC free article] [PubMed] [Google Scholar]
- Dimidschstein J, Chen Q, Tremblay R, Rogers SL, Saldi GA, Guo L, Xu Q, Liu R, Lu C, Chu J, et al. A viral strategy for targeting and manipulating interneurons across vertebrate species. Nat Neurosci. 2016;19:1743–1749. doi: 10.1038/nn.4430. [DOI] [PMC free article] [PubMed] [Google Scholar]
- Economo MN, Clack NG, Lavis LD, Gerfen CR, Svoboda K, Myers EW, Chandrashekar J. A platform for brain-wide imaging and reconstruction of individual neurons. eLife. 2016;5:e10566. doi: 10.7554/eLife.10566. [DOI] [PMC free article] [PubMed] [Google Scholar]
- Economo MN, Viswanathan S, Tasic B, Bas E, Winnubst J, Menon V, Graybuck L, Nguyen TN, Wang L, Gerfen CR, et al. Distinct descending motor cortex pathways and their roles in movement. bioRxiv. 2017 doi: 10.1101/229260. [DOI] [PubMed] [Google Scholar]
- Elyada YM, Haag J, Borst A. Dendritic end inhibition in large-field visual neurons of the fly. J Neurosci. 2013;33:3659–3667. doi: 10.1523/JNEUROSCI.4136-12.2013. [DOI] [PMC free article] [PubMed] [Google Scholar]
- Feinberg EH, VanHoven MK, Bendesky A, Wang G, Fetter RD, Shen K, Bargmann CI. GFP reconstitution across synaptic partners (GRASP) defines cell contacts and synapses in living animals. Neuron. 2007;57:353–363. doi: 10.1016/j.neuron.2007.11.030. [DOI] [PubMed] [Google Scholar]
- Fenno L, Yizhar O, Deisseroth K. The development and application of optogenetics. Annu Rev Neurosci. 2011;34:389–412. doi: 10.1146/annurev-neuro-061010-113817. [DOI] [PMC free article] [PubMed] [Google Scholar]
- Fenno LE, Mattis J, Ramakrishnan C, Hyun M, Lee SY, He M, Tucciarone J, Selimbeyoglu A, Berndt A, Grosenick L, et al. Targeting cells with single vectors using multiple-feature Boolean logic. Nat Methods. 2014;11:763–772. doi: 10.1038/nmeth.2996. [DOI] [PMC free article] [PubMed] [Google Scholar]
- Fetz EE. Operant conditioning of cortical unit activity. Science. 1969;163:955–958. doi: 10.1126/science.163.3870.955. [DOI] [PubMed] [Google Scholar]
- Flusberg BA, Cocker ED, Piyawattanametha W, Jung JC, Cheung EL, Schnitzer MJ. Fiber-optic fluorescence imaging. Nat Methods. 2005;2:941–950. doi: 10.1038/nmeth820. [DOI] [PMC free article] [PubMed] [Google Scholar]
- Foldy C, Darmanis S, Aoto J, Malenka RC, Quake SR, Sudhof TC. Single-cell RNAseq reveals cell adhesion molecule profiles in electrophysiologically defined neurons. Proc Natl Acad Sci U S A. 2016;113:E5222–5231. doi: 10.1073/pnas.1610155113. [DOI] [PMC free article] [PubMed] [Google Scholar]
- Fosque BF, Sun Y, Dana H, Yang CT, Ohyama T, Tadross MR, Patel R, Zlatic M, Kim DS, Ahrens MB, et al. Neural circuits. Labeling of active neural circuits in vivo with designed calcium integrators. Science. 2015;347:755–760. doi: 10.1126/science.1260922. [DOI] [PubMed] [Google Scholar]
- Franke K, Berens P, Schubert T, Bethge M, Euler T, Baden T. Inhibition decorrelates visual feature representations in the inner retina. Nature. 2017;542:439–444. doi: 10.1038/nature21394. [DOI] [PMC free article] [PubMed] [Google Scholar]
- Gentet LJ, Kremer Y, Taniguchi H, Huang ZJ, Staiger JF, Petersen CC. Unique functional properties of somatostatin-expressing GABAergic neurons in mouse barrel cortex. Nat Neurosci. 2012;15:607–612. doi: 10.1038/nn.3051. [DOI] [PubMed] [Google Scholar]
- Gilbert CD, Wiesel TN. Morphology and intracortical projections of functionally characterised neurones in the cat visual cortex. Nature. 1979;280:120–125. doi: 10.1038/280120a0. [DOI] [PubMed] [Google Scholar]
- Gomez JL, Bonaventura J, Lesniak W, Mathews WB, Sysa-Shah P, Rodriguez LA, Ellis RJ, Richie CT, Harvey BK, Dannals RF, et al. Chemogenetics revealed: DREADD occupancy and activation via converted clozapine. Science. 2017;357:503–507. doi: 10.1126/science.aan2475. [DOI] [PMC free article] [PubMed] [Google Scholar]
- Gong H, Zeng S, Yan C, Lv X, Yang Z, Xu T, Feng Z, Ding W, Qi X, Li A, et al. Continuously tracing brain-wide long-distance axonal projections in mice at a one-micron voxel resolution. NeuroImage. 2013;74:87–98. doi: 10.1016/j.neuroimage.2013.02.005. [DOI] [PubMed] [Google Scholar]
- Gong S, Doughty M, Harbaugh CR, Cummins A, Hatten ME, Heintz N, Gerfen CR. Targeting Cre recombinase to specific neuron populations with bacterial artificial chromosome constructs. J Neurosci. 2007;27:9817–9823. doi: 10.1523/JNEUROSCI.2707-07.2007. [DOI] [PMC free article] [PubMed] [Google Scholar]
- Gong Y, Huang C, Li JZ, Grewe BF, Zhang Y, Eismann S, Schnitzer MJ. High-speed recording of neural spikes in awake mice and flies with a fluorescent voltage sensor. Science. 2015;350:1361–1366. doi: 10.1126/science.aab0810. [DOI] [PMC free article] [PubMed] [Google Scholar]
- Govorunova EG, Sineshchekov OA, Janz R, Liu X, Spudich JL. Natural light-gated anion channels: A family of microbial rhodopsins for advanced optogenetics. Science. 2015;349:647–650. doi: 10.1126/science.aaa7484. [DOI] [PMC free article] [PubMed] [Google Scholar]
- Granit R, Phillips CG. Excitatory and inhibitory processes acting upon individual Purkinje cells of the cerebellum in cats. J Physiol. 1956;133:520–547. doi: 10.1113/jphysiol.1956.sp005606. [DOI] [PMC free article] [PubMed] [Google Scholar]
- Gratz SJ, Harrison MM, Wildonger J, O’Connor-Giles KM. Precise Genome Editing of Drosophila with CRISPR RNA-Guided Cas9. Methods Mol Biol. 2015;1311:335–348. doi: 10.1007/978-1-4939-2687-9_22. [DOI] [PMC free article] [PubMed] [Google Scholar]
- Greenberg ME, Ziff EB, Greene LA. Stimulation of neuronal acetylcholine receptors induces rapid gene transcription. Science. 1986;234:80–83. doi: 10.1126/science.3749894. [DOI] [PubMed] [Google Scholar]
- Grewe BF, Grundemann J, Kitch LJ, Lecoq JA, Parker JG, Marshall JD, Larkin MC, Jercog PE, Grenier F, Li JZ, et al. Neural ensemble dynamics underlying a long-term associative memory. Nature. 2017;543:670–675. doi: 10.1038/nature21682. [DOI] [PMC free article] [PubMed] [Google Scholar]
- Grienberger C, Konnerth A. Imaging calcium in neurons. Neuron. 2012;73:862–885. doi: 10.1016/j.neuron.2012.02.011. [DOI] [PubMed] [Google Scholar]
- Grosenick LM, Broxton M, Kim CK, Liston C, Poole B, Yang S, Andalman AS, Scharff E, Cohen N, Yizhar O, et al. Identification Of Cellular-Activity Dynamics Across Large Tissue Volumes In The Mammalian Brain. bioRxiv. 2017 doi: 10.1101/132688. [DOI] [Google Scholar]
- Grun D, van Oudenaarden A. Design and Analysis of Single-Cell Sequencing Experiments. Cell. 2015;163:799–810. doi: 10.1016/j.cell.2015.10.039. [DOI] [PubMed] [Google Scholar]
- Gunaydin LA, Grosenick L, Finkelstein JC, Kauvar IV, Fenno LE, Adhikari A, Lammel S, Mirzabekov JJ, Airan RD, Zalocusky KA, et al. Natural neural projection dynamics underlying social behavior. Cell. 2014;157:1535–1551. doi: 10.1016/j.cell.2014.05.017. [DOI] [PMC free article] [PubMed] [Google Scholar]
- Gunaydin LA, Yizhar O, Berndt A, Sohal VS, Deisseroth K, Hegemann P. Ultrafast optogenetic control. Nat Neurosci. 2010;13:387–392. doi: 10.1038/nn.2495. [DOI] [PubMed] [Google Scholar]
- Guo JZ, Graves AR, Guo WW, Zheng J, Lee A, Rodriguez-Gonzalez J, Li N, Macklin JJ, Phillips JW, Mensh BD, et al. Cortex commands the performance of skilled movement. eLife. 2015;4:e10774. doi: 10.7554/eLife.10774. [DOI] [PMC free article] [PubMed] [Google Scholar]
- Guo ZV, Inagaki HK, Daie K, Druckmann S, Gerfen CR, Svoboda K. Maintenance of persistent activity in a frontal thalamocortical loop. Nature. 2017;545:181–186. doi: 10.1038/nature22324. [DOI] [PMC free article] [PubMed] [Google Scholar]
- Guo ZV, Li N, Huber D, Ophir E, Gutnisky D, Ting JT, Feng G, Svoboda K. Flow of cortical activity underlying a tactile decision in mice. Neuron. 2014;81:179–194. doi: 10.1016/j.neuron.2013.10.020. [DOI] [PMC free article] [PubMed] [Google Scholar]
- Guzowski JF, Miyashita T, Chawla MK, Sanderson J, Maes LI, Houston FP, Lipa P, McNaughton BL, Worley PF, Barnes CA. Recent behavioral history modifies coupling between cell activity and Arc gene transcription in hippocampal CA1 neurons. Proc Natl Acad Sci U S A. 2006;103:1077–1082. doi: 10.1073/pnas.0505519103. [DOI] [PMC free article] [PubMed] [Google Scholar]
- Hahnloser RH, Kozhevnikov AA, Fee MS. An ultra-sparse code underlies the generation of neural sequences in a songbird. Nature. 2002;419:65–70. doi: 10.1038/nature00974. [DOI] [PubMed] [Google Scholar]
- Hamada FN, Rosenzweig M, Kang K, Pulver SR, Ghezzi A, Jegla TJ, Garrity PA. An internal thermal sensor controlling temperature preference in Drosophila. Nature. 2008;454:217–220. doi: 10.1038/nature07001. [DOI] [PMC free article] [PubMed] [Google Scholar]
- Han X, Boyden ES. Multiple-color optical activation, silencing, and desynchronization of neural activity, with single-spike temporal resolution. PLoS ONE. 2007;2:e299. doi: 10.1371/journal.pone.0000299. [DOI] [PMC free article] [PubMed] [Google Scholar]
- Harris KD, Quiroga RQ, Freeman J, Smith SL. Improving data quality in neuronal population recordings. Nat Neurosci. 2016;19:1165–1174. doi: 10.1038/nn.4365. [DOI] [PMC free article] [PubMed] [Google Scholar]
- Helassa N, Durst C, Coates C, Kerruth S, Arif U, Schulze C, Wiegert JS, Geeves M, Oertner T, Torok K. Ultrafast glutamate sensors resolve synaptic short-term plasticity. bioRxiv. 2017 doi: 10.1101/233494. [DOI] [PMC free article] [PubMed] [Google Scholar]
- Helmchen F, Denk W. Deep tissue two-photon microscopy. Nat Methods. 2005;2:932–940. doi: 10.1038/nmeth818. [DOI] [PubMed] [Google Scholar]
- Helmstaedter M, Briggman KL, Turaga SC, Jain V, Seung HS, Denk W. Connectomic reconstruction of the inner plexiform layer in the mouse retina. Nature. 2013;500:168–174. doi: 10.1038/nature12346. [DOI] [PubMed] [Google Scholar]
- Herman AM, Huang L, Murphey DK, Garcia I, Arenkiel BR. Cell type-specific and time-dependent light exposure contribute to silencing in neurons expressing Channelrhodopsin-2. eLife. 2014;3:e01481. doi: 10.7554/eLife.01481. [DOI] [PMC free article] [PubMed] [Google Scholar]
- Hikosaka O, Wurtz RH. Modification of saccadic eye movements by GABA-related substances. I. Effect of muscimol and bicuculline in monkey superior colliculus. J Neurophysiol. 1985;53:266–291. doi: 10.1152/jn.1985.53.1.266. [DOI] [PubMed] [Google Scholar]
- Hrvatin S, Hochbaum DR, Nagy MA, Cicconet M, Robertson K, Cheadle L, Zilionis R, Ratner A, Borges-Monroy R, Klein AM, et al. Single-cell analysis of experience-dependent transcriptomic states in the mouse visual cortex. Nat Neurosci. 2018;21:120–129. doi: 10.1038/s41593-017-0029-5. [DOI] [PMC free article] [PubMed] [Google Scholar]
- Huang TH, Niesman P, Arasu D, Lee D, De La Cruz A, Callejas A, Hong EJ, Lois C. Tracing neuronal circuits in transgenic animals by transneuronal control of transcription (TRACT) eLife. 2017;6:e32027. doi: 10.7554/eLife.32027. [DOI] [PMC free article] [PubMed] [Google Scholar]
- Huber D, Gutnisky DA, Peron S, O’Connor DH, Wiegert JS, Tian L, Oertner TG, Looger LL, Svoboda K. Multiple dynamic representations in the motor cortex during sensorimotor learning. Nature. 2012;484:473–478. doi: 10.1038/nature11039. [DOI] [PMC free article] [PubMed] [Google Scholar]
- Inoue M, Takeuchi A, Horigane S, Ohkura M, Gengyo-Ando K, Fujii H, Kamijo S, Takemoto-Kimura S, Kano M, Nakai J, et al. Rational design of a high-affinity, fast, red calcium indicator R-CaMP2. Nat Methods. 2015;12:64–70. doi: 10.1038/nmeth.3185. [DOI] [PubMed] [Google Scholar]
- Islam S, Kjallquist U, Moliner A, Zajac P, Fan JB, Lonnerberg P, Linnarsson S. Characterization of the single-cell transcriptional landscape by highly multiplex RNA-seq. Genome research. 2011;21:1160–1167. doi: 10.1101/gr.110882.110. [DOI] [PMC free article] [PubMed] [Google Scholar]
- Januszewski M, Kornfeld J, Li PH, Pope A, Blakely T, Lindsey L, Maitin-Shepard JB, Tyka M, Denk W, Jain V. High-Precision Automated Reconstruction of Neurons with Flood-filling Networks. bioRxiv. 2017 doi: 10.1101/200675. [DOI] [PubMed] [Google Scholar]
- Jazayeri M, Afraz A. Navigating the Neural Space in Search of the Neural Code. Neuron. 2017;93:1003–1014. doi: 10.1016/j.neuron.2017.02.019. [DOI] [PubMed] [Google Scholar]
- Jefferis GS, Livet J. Sparse and combinatorial neuron labelling. Curr Opin Neurobiol. 2012;22:101–110. doi: 10.1016/j.conb.2011.09.010. [DOI] [PubMed] [Google Scholar]
- Jefferis GSXE, Marin EC, Stocker RF, Luo L. Target neuron prespecification in the olfactory map of Drosophila. Nature. 2001;414:204–208. doi: 10.1038/35102574. [DOI] [PubMed] [Google Scholar]
- Jenett A, Rubin GM, Ngo TT, Shepherd D, Murphy C, Dionne H, Pfeiffer BD, Cavallaro A, Hall D, Jeter J, et al. A GAL4-driver line resource for Drosophila neurobiology. Cell Reports. 2012;2:991–1001. doi: 10.1016/j.celrep.2012.09.011. [DOI] [PMC free article] [PubMed] [Google Scholar]
- Jennings JH, Ung RL, Resendez SL, Stamatakis AM, Taylor JG, Huang J, Veleta K, Kantak PA, Aita M, Shilling-Scrivo K, et al. Visualizing hypothalamic network dynamics for appetitive and consummatory behaviors. Cell. 2015;160:516–527. doi: 10.1016/j.cell.2014.12.026. [DOI] [PMC free article] [PubMed] [Google Scholar]
- Jin L, Han Z, Platisa J, Wooltorton JR, Cohen LB, Pieribone VA. Single action potentials and subthreshold electrical events imaged in neurons with a fluorescent protein voltage probe. Neuron. 2012;75:779–785. doi: 10.1016/j.neuron.2012.06.040. [DOI] [PMC free article] [PubMed] [Google Scholar]
- Jinek M, Chylinski K, Fonfara I, Hauer M, Doudna JA, Charpentier E. A programmable dual-RNA-guided DNA endonuclease in adaptive bacterial immunity. Science. 2012;337:816–821. doi: 10.1126/science.1225829. [DOI] [PMC free article] [PubMed] [Google Scholar]
- Johnson MB, Walsh CA. Cerebral cortical neuron diversity and development at single-cell resolution. Curr Opin Neurobiol. 2017;42:9–16. doi: 10.1016/j.conb.2016.11.001. [DOI] [PMC free article] [PubMed] [Google Scholar]
- Jorgenson LA, Newsome WT, Anderson DJ, Bargmann CI, Brown EN, Deisseroth K, Donoghue JP, Hudson KL, Ling GS, MacLeish PR, et al. The BRAIN Initiative: developing technology to catalyse neuroscience discovery. Philosophical transactions of the Royal Society of London Series B, Biological sciences. 2015;370:20140164. doi: 10.1098/rstb.2014.0164. [DOI] [PMC free article] [PubMed] [Google Scholar]
- Jun JJ, Mitelut C, Lai C, Gratiy S, Anastassiou C, Harris TD. Real-time spike sorting platform for high-density extracellular probes with ground-truth validation and drift correction. bioRxiv. 2017a doi: 10.1101/101030. [DOI] [Google Scholar]
- Jun JJ, Steinmetz NA, Siegle JH, Denman DJ, Bauza M, Barbarits B, Lee AK, Anastassiou CA, Andrei A, Aydin C, et al. Fully integrated silicon probes for high-density recording of neural activity. Nature. 2017b;551:232–236. doi: 10.1038/nature24636. [DOI] [PMC free article] [PubMed] [Google Scholar]
- Junyent F, Kremer EJ. CAV-2--why a canine virus is a neurobiologist’s best friend. Current opinion in pharmacology. 2015;24:86–93. doi: 10.1016/j.coph.2015.08.004. [DOI] [PubMed] [Google Scholar]
- Karpova AY, Tervo DG, Gray NW, Svoboda K. Rapid and reversible chemical inactivation of synaptic transmission in genetically targeted neurons. Neuron. 2005;48:727–735. doi: 10.1016/j.neuron.2005.11.015. [DOI] [PubMed] [Google Scholar]
- Kato HK, Gillet SN, Peters AJ, Isaacson JS, Komiyama T. Parvalbumin-expressing interneurons linearly control olfactory bulb output. Neuron. 2013;80:1218–1231. doi: 10.1016/j.neuron.2013.08.036. [DOI] [PMC free article] [PubMed] [Google Scholar]
- Kebschull JM, Garcia da Silva P, Reid AP, Peikon ID, Albeanu DF, Zador AM. High-Throughput Mapping of Single-Neuron Projections by Sequencing of Barcoded RNA. Neuron. 2016;91:975–987. doi: 10.1016/j.neuron.2016.07.036. [DOI] [PMC free article] [PubMed] [Google Scholar]
- Keller PJ, Ahrens MB. Visualizing whole-brain activity and development at the single-cell level using light-sheet microscopy. Neuron. 2015;85:462–483. doi: 10.1016/j.neuron.2014.12.039. [DOI] [PubMed] [Google Scholar]
- Kerlin AM, Andermann ML, Berezovskii VK, Reid RC. Broadly tuned response properties of diverse inhibitory neuron subtypes in mouse visual cortex. Neuron. 2010;67:858–871. doi: 10.1016/j.neuron.2010.08.002. [DOI] [PMC free article] [PubMed] [Google Scholar]
- Kim EJ, Jacobs MW, Ito-Cole T, Callaway EM. Improved Monosynaptic Neural Circuit Tracing Using Engineered Rabies Virus Glycoproteins. Cell Reports. 2016;15:692–699. doi: 10.1016/j.celrep.2016.03.067. [DOI] [PMC free article] [PubMed] [Google Scholar]
- Kim J, Zhao T, Petralia RS, Yu Y, Peng H, Myers E, Magee JC. mGRASP enables mapping mammalian synaptic connectivity with light microscopy. Nat Methods. 2011;9:96–102. doi: 10.1038/nmeth.1784. [DOI] [PMC free article] [PubMed] [Google Scholar]
- Kim JC, Cook MN, Carey MR, Shen C, Regehr WG, Dymecki SM. Linking genetically defined neurons to behavior through a broadly applicable silencing allele. Neuron. 2009;63:305–315. doi: 10.1016/j.neuron.2009.07.010. [DOI] [PMC free article] [PubMed] [Google Scholar]
- Kitamoto T. Conditional modification of behavior in Drosophila by targeted expression of a temperature-sensitive shibire allele in defined neurons. J Neurobiol. 2001;47:81–92. doi: 10.1002/neu.1018. [DOI] [PubMed] [Google Scholar]
- Klapoetke NC, Murata Y, Kim SS, Pulver SR, Birdsey-Benson A, Cho YK, Morimoto TK, Chuong AS, Carpenter EJ, Tian Z, et al. Independent optical excitation of distinct neural populations. Nat Methods. 2014;11:338–346. doi: 10.1038/nmeth.2836. [DOI] [PMC free article] [PubMed] [Google Scholar]
- Klein AM, Mazutis L, Akartuna I, Tallapragada N, Veres A, Li V, Peshkin L, Weitz DA, Kirschner MW. Droplet barcoding for single-cell transcriptomics applied to embryonic stem cells. Cell. 2015;161:1187–1201. doi: 10.1016/j.cell.2015.04.044. [DOI] [PMC free article] [PubMed] [Google Scholar]
- Koenig JH, Saito K, Ikeda K. Reversible control of synaptic transmission in a single gene mutant of Drosophila melanogaster. J Cell Biol. 1983;96:1517–1522. doi: 10.1083/jcb.96.6.1517. [DOI] [PMC free article] [PubMed] [Google Scholar]
- Komiyama T, Sato TR, O’Connor DH, Zhang YX, Huber D, Hooks BM, Gabitto M, Svoboda K. Learning-related fine-scale specificity imaged in motor cortex circuits of behaving mice. Nature. 2010;464:1182–1186. doi: 10.1038/nature08897. [DOI] [PubMed] [Google Scholar]
- Komor AC, Badran AH, Liu DR. CRISPR-Based Technologies for the Manipulation of Eukaryotic Genomes. Cell. 2017;168:20–36. doi: 10.1016/j.cell.2016.10.044. [DOI] [PMC free article] [PubMed] [Google Scholar]
- Koya E, Golden SA, Harvey BK, Guez-Barber DH, Berkow A, Simmons DE, Bossert JM, Nair SG, Uejima JL, Marin MT, et al. Targeted disruption of cocaine-activated nucleus accumbens neurons prevents context-specific sensitization. Nat Neurosci. 2009;12:1069–1073. doi: 10.1038/nn.2364. [DOI] [PMC free article] [PubMed] [Google Scholar]
- Kralj JM, Douglass AD, Hochbaum DR, Maclaurin D, Cohen AE. Optical recording of action potentials in mammalian neurons using a microbial rhodopsin. Nat Methods. 2011;9:90–95. doi: 10.1038/nmeth.1782. [DOI] [PMC free article] [PubMed] [Google Scholar]
- Lagler M, Ozdemir AT, Lagoun S, Malagon-Vina H, Borhegyi Z, Hauer R, Jelem A, Klausberger T. Divisions of Identified Parvalbumin-Expressing Basket Cells during Working Memory-Guided Decision Making. Neuron. 2016;91:1390–1401. doi: 10.1016/j.neuron.2016.08.010. [DOI] [PubMed] [Google Scholar]
- Lee AT, Vogt D, Rubenstein JL, Sohal VS. A class of GABAergic neurons in the prefrontal cortex sends long-range projections to the nucleus accumbens and elicits acute avoidance behavior. J Neurosci. 2014;34:11519–11525. doi: 10.1523/JNEUROSCI.1157-14.2014. [DOI] [PMC free article] [PubMed] [Google Scholar]
- Lee D, Creed M, Jung K, Stefanelli T, Wendler DJ, Oh WC, Mignocchi NL, Luscher C, Kwon HB. Temporally precise labeling and control of neuromodulatory circuits in the mammalian brain. Nat Methods. 2017;14:495–503. doi: 10.1038/nmeth.4234. [DOI] [PubMed] [Google Scholar]
- Lee T, Luo L. Mosaic analysis with a repressible cell marker for studies of gene function in neuronal morphogenesis. Neuron. 1999;22:451–461. doi: 10.1016/s0896-6273(00)80701-1. [DOI] [PubMed] [Google Scholar]
- Lee WC, Bonin V, Reed M, Graham BJ, Hood G, Glattfelder K, Reid RC. Anatomy and function of an excitatory network in the visual cortex. Nature. 2016;532:370–374. doi: 10.1038/nature17192. [DOI] [PMC free article] [PubMed] [Google Scholar]
- Lein E, Borm LE, Linnarsson S. The promise of spatial transcriptomics for neuroscience in the era of molecular cell typing. Science. 2017;358:64–69. doi: 10.1126/science.aan6827. [DOI] [PubMed] [Google Scholar]
- Lein ES, Hawrylycz MJ, Ao N, Ayres M, Bensinger A, Bernard A, Boe AF, Boguski MS, Brockway KS, Byrnes EJ, et al. Genome-wide atlas of gene expression in the adult mouse brain. Nature. 2007;445:168–176. doi: 10.1038/nature05453. [DOI] [PubMed] [Google Scholar]
- Lerchner W, Xiao C, Nashmi R, Slimko EM, van Trigt L, Lester HA, Anderson DJ. Reversible silencing of neuronal excitability in behaving mice by a genetically targeted, ivermectin-gated Cl− channel. Neuron. 2007;54:35–49. doi: 10.1016/j.neuron.2007.02.030. [DOI] [PubMed] [Google Scholar]
- Lerner TN, Shilyansky C, Davidson TJ, Evans KE, Beier KT, Zalocusky KA, Crow AK, Malenka RC, Luo L, Tomer R, et al. Intact-Brain Analyses Reveal Distinct Information Carried by SNc Dopamine Subcircuits. Cell. 2015;162:635–647. doi: 10.1016/j.cell.2015.07.014. [DOI] [PMC free article] [PubMed] [Google Scholar]
- Lewicki MS. A review of methods for spike sorting: the detection and classification of neural action potentials. Network. 1998;9:R53–78. [PubMed] [Google Scholar]
- Li H, Horns F, Wu B, Xie Q, Li J, Li T, Luginbuhl DJ, Quake SR, Luo L. Classifying Drosophila Olfactory Projection Neuron Subtypes by Single-Cell RNA Sequencing. Cell. 2017a;171:1206–1220. doi: 10.1016/j.cell.2017.10.019. [DOI] [PMC free article] [PubMed] [Google Scholar]
- Li M, Liu F, Jiang H, Lee TS, Tang S. Long-Term Two-Photon Imaging in Awake Macaque Monkey. Neuron. 2017b;93:1049–1057. doi: 10.1016/j.neuron.2017.01.027. [DOI] [PubMed] [Google Scholar]
- Li N, Chen TW, Guo ZV, Gerfen CR, Svoboda K. A motor cortex circuit for motor planning and movement. Nature. 2015;519:51–56. doi: 10.1038/nature14178. [DOI] [PubMed] [Google Scholar]
- Li N, Daie K, Svoboda K, Druckmann S. Robust neuronal dynamics in premotor cortex during motor planning. Nature. 2016;532:459–464. doi: 10.1038/nature17643. [DOI] [PMC free article] [PubMed] [Google Scholar]
- Lima SQ, Hromadka T, Znamenskiy P, Zador AM. PINP: a new method of tagging neuronal populations for identification during in vivo electrophysiological recording. PLoS One. 2009;4:e6099. doi: 10.1371/journal.pone.0006099. [DOI] [PMC free article] [PubMed] [Google Scholar]
- Lima SQ, Miesenbock G. Remote control of behavior through genetically targeted photostimulation of neurons. Cell. 2005;121:141–152. doi: 10.1016/j.cell.2005.02.004. [DOI] [PubMed] [Google Scholar]
- Lin JY, Knutsen PM, Muller A, Kleinfeld D, Tsien RY. ReaChR: a red-shifted variant of channelrhodopsin enables deep transcranial optogenetic excitation. Nat Neurosci. 2013;16:1499–1508. doi: 10.1038/nn.3502. [DOI] [PMC free article] [PubMed] [Google Scholar]
- Lin MZ, Schnitzer MJ. Genetically encoded indicators of neuronal activity. Nat Neurosci. 2016;19:1142–1153. doi: 10.1038/nn.4359. [DOI] [PMC free article] [PubMed] [Google Scholar]
- Liu X, Ramirez S, Pang PT, Puryear CB, Govindarajan A, Deisseroth K, Tonegawa S. Optogenetic stimulation of a hippocampal engram activates fear memory recall. Nature. 2012;484:381–385. doi: 10.1038/nature11028. [DOI] [PMC free article] [PubMed] [Google Scholar]
- Livet J, Weissman TA, Kang H, Draft RW, Lu J, Bennis RA, Sanes JR, Lichtman JW. Transgenic strategies for combinatorial expression of fluorescent proteins in the nervous system. Nature. 2007;450:56–62. doi: 10.1038/nature06293. [DOI] [PubMed] [Google Scholar]
- Lo L, Anderson DJ. A Cre-dependent, anterograde transsynaptic viral tracer for mapping output pathways of genetically marked neurons. Neuron. 2011;72:938–950. doi: 10.1016/j.neuron.2011.12.002. [DOI] [PMC free article] [PubMed] [Google Scholar]
- Lovett-Barron M, Turi GF, Kaifosh P, Lee PH, Bolze F, Sun XH, Nicoud JF, Zemelman BV, Sternson SM, Losonczy A. Regulation of neuronal input transformations by tunable dendritic inhibition. Nat Neurosci. 2012;15:423–430. S421–423. doi: 10.1038/nn.3024. [DOI] [PubMed] [Google Scholar]
- Lu R, Sun W, Liang Y, Kerlin A, Bierfeld J, Seelig JD, Wilson DE, Scholl B, Mohar B, Tanimoto M, et al. Video-rate volumetric functional imaging of the brain at synaptic resolution. Nat Neurosci. 2017;20:620–628. doi: 10.1038/nn.4516. [DOI] [PMC free article] [PubMed] [Google Scholar]
- Luan H, Peabody NC, Vinson CR, White BH. Refined spatial manipulation of neuronal function by combinatorial restriction of transgene expression. Neuron. 2006;52:425–436. doi: 10.1016/j.neuron.2006.08.028. [DOI] [PMC free article] [PubMed] [Google Scholar]
- Lubeck E, Coskun AF, Zhiyentayev T, Ahmad M, Cai L. Single-cell in situ RNA profiling by sequential hybridization. Nat Methods. 2014;11:360–361. doi: 10.1038/nmeth.2892. [DOI] [PMC free article] [PubMed] [Google Scholar]
- Luo L, Callaway EM, Svoboda K. Genetic dissection of neural circuits. Neuron. 2008;57:634–660. doi: 10.1016/j.neuron.2008.01.002. [DOI] [PMC free article] [PubMed] [Google Scholar]
- Luquet S, Perez FA, Hnasko TS, Palmiter RD. NPY/AgRP neurons are essential for feeding in adult mice but can be ablated in neonates. Science. 2005;310:683–685. doi: 10.1126/science.1115524. [DOI] [PubMed] [Google Scholar]
- Lyford GL, Yamagata K, Kaufmann WE, Barnes CA, Sanders LK, Copeland NG, Gilbert DJ, Jenkins NA, Lanahan AA, Worley PF. Arc, a growth factor and activity-regulated gene, encodes a novel cytoskeleton-associated protein that is enriched in neuronal dendrites. Neuron. 1995;14:433–445. doi: 10.1016/0896-6273(95)90299-6. [DOI] [PubMed] [Google Scholar]
- Macosko EZ, Basu A, Satija R, Nemesh J, Shekhar K, Goldman M, Tirosh I, Bialas AR, Kamitaki N, Martersteck EM, et al. Highly Parallel Genome-wide Expression Profiling of Individual Cells Using Nanoliter Droplets. Cell. 2015;161:1202–1214. doi: 10.1016/j.cell.2015.05.002. [DOI] [PMC free article] [PubMed] [Google Scholar]
- Madisen L, Garner AR, Shimaoka D, Chuong AS, Klapoetke NC, Li L, van der Bourg A, Niino Y, Egolf L, Monetti C, et al. Transgenic mice for intersectional targeting of neural sensors and effectors with high specificity and performance. Neuron. 2015;85:942–958. doi: 10.1016/j.neuron.2015.02.022. [DOI] [PMC free article] [PubMed] [Google Scholar]
- Magnus CJ, Lee PH, Atasoy D, Su HH, Looger LL, Sternson SM. Chemical and genetic engineering of selective ion channel-ligand interactions. Science. 2011;333:1292–1296. doi: 10.1126/science.1206606. [DOI] [PMC free article] [PubMed] [Google Scholar]
- Mahn M, Gibor L, Malina KC-K, Patil P, Printz Y, Oring S, Levy R, Lampl I, Yizhar O. High-efficiency optogenetic silencing with soma-targeted anion-conducting channelrhodopsins. bioRxiv. 2017 doi: 10.1101/225847. [DOI] [PMC free article] [PubMed] [Google Scholar]
- Mali P, Yang L, Esvelt KM, Aach J, Guell M, DiCarlo JE, Norville JE, Church GM. RNA-guided human genome engineering via Cas9. Science. 2013;339:823–826. doi: 10.1126/science.1232033. [DOI] [PMC free article] [PubMed] [Google Scholar]
- Marin EC, Jefferis GSXE, Komiyama T, Zhu H, Luo L. Representation of the glomerular olfactory map in the Drosophila brain. Cell. 2002;109:243–255. doi: 10.1016/s0092-8674(02)00700-6. [DOI] [PubMed] [Google Scholar]
- Marvin JS, Borghuis BG, Tian L, Cichon J, Harnett MT, Akerboom J, Gordus A, Renninger SL, Chen TW, Bargmann CI, et al. An optimized fluorescent probe for visualizing glutamate neurotransmission. Nat Methods. 2013;10:162–170. doi: 10.1038/nmeth.2333. [DOI] [PMC free article] [PubMed] [Google Scholar]
- Marvin JS, Scholl B, Wilson DE, Podgorski K, Kazemipour A, Mueller JA, Schoch-McGovern S, Wang SS-H, Quiroz FJU, Rebola N, et al. Stability, affinity and chromatic variants of the glutamate sensor iGluSnFR. bioRxiv. 2017 doi: 10.1101/235176. [DOI] [PMC free article] [PubMed] [Google Scholar]
- Mazarakis ND, Azzouz M, Rohll JB, Ellard FM, Wilkes FJ, Olsen AL, Carter EE, Barber RD, Baban DF, Kingsman SM, et al. Rabies virus glycoprotein pseudotyping of lentiviral vectors enables retrograde axonal transport and access to the nervous system after peripheral delivery. Hum Mol Genet. 2001;10:2109–2121. doi: 10.1093/hmg/10.19.2109. [DOI] [PubMed] [Google Scholar]
- McDonald MJ, Rosbash M. Microarray analysis and organization of circadian gene expression in Drosophila. Cell. 2001;107:567–578. doi: 10.1016/s0092-8674(01)00545-1. [DOI] [PubMed] [Google Scholar]
- McGuire SE, Le PT, Osborn AJ, Matsumoto K, Davis RL. Spatiotemporal rescue of memory dysfunction in Drosophila. Science. 2003;302:1765–1768. doi: 10.1126/science.1089035. [DOI] [PubMed] [Google Scholar]
- Mikuni T, Nishiyama J, Sun Y, Kamasawa N, Yasuda R. High-Throughput, High-Resolution Mapping of Protein Localization in Mammalian Brain by In Vivo Genome Editing. Cell. 2016;165:1803–1817. doi: 10.1016/j.cell.2016.04.044. [DOI] [PMC free article] [PubMed] [Google Scholar]
- Miyawaki A, Niino Y. Molecular spies for bioimaging--fluorescent protein-based probes. Mol Cell. 2015;58:632–643. doi: 10.1016/j.molcel.2015.03.002. [DOI] [PubMed] [Google Scholar]
- Morgan JI, Curran T. Role of ion flux in the control of c-fos expression. Nature. 1986;322:552–555. doi: 10.1038/322552a0. [DOI] [PubMed] [Google Scholar]
- Nagel G, Szellas T, Huhn W, Kateriya S, Adeishvili N, Berthold P, Ollig D, Hegemann P, Bamberg E. Channelrhodopsin-2, a directly light-gated cation-selective membrane channel. Proc Natl Acad Sci U S A. 2003;100:13940–13945. doi: 10.1073/pnas.1936192100. [DOI] [PMC free article] [PubMed] [Google Scholar]
- Nern A, Pfeiffer BD, Rubin GM. Optimized tools for multicolor stochastic labeling reveal diverse stereotyped cell arrangements in the fly visual system. Proc Natl Acad Sci U S A. 2015;112:E2967–2976. doi: 10.1073/pnas.1506763112. [DOI] [PMC free article] [PubMed] [Google Scholar]
- Ng M, Roorda RD, Lima SQ, Zemelman BV, Morcillo P, Miesenbock G. Transmission of olfactory information between three populations of neurons in the antennal lobe of the fly. Neuron. 2002;36:463–474. doi: 10.1016/s0896-6273(02)00975-3. [DOI] [PubMed] [Google Scholar]
- Nishiyama J, Mikuni T, Yasuda R. Virus-Mediated Genome Editing via Homology-Directed Repair in Mitotic and Postmitotic Cells in Mammalian Brain. Neuron. 2017;96:755–768. doi: 10.1016/j.neuron.2017.10.004. [DOI] [PMC free article] [PubMed] [Google Scholar]
- O’Connor DH, Hires SA, Guo ZV, Li N, Yu J, Sun QQ, Huber D, Svoboda K. Neural coding during active somatosensation revealed using illusory touch. Nat Neurosci. 2013;16:958–965. doi: 10.1038/nn.3419. [DOI] [PMC free article] [PubMed] [Google Scholar]
- Ohki K, Chung S, Kara P, Hubener M, Bonhoeffer T, Reid RC. Highly ordered arrangement of single neurons in orientation pinwheels. Nature. 2006;442:925–928. doi: 10.1038/nature05019. [DOI] [PubMed] [Google Scholar]
- Olsen SR, Bortone DS, Adesnik H, Scanziani M. Gain control by layer six in cortical circuits of vision. Nature. 2012;483:47–52. doi: 10.1038/nature10835. [DOI] [PMC free article] [PubMed] [Google Scholar]
- Osakada F, Mori T, Cetin AH, Marshel JH, Virgen B, Callaway EM. New rabies virus variants for monitoring and manipulating activity and gene expression in defined neural circuits. Neuron. 2011;71:617–631. doi: 10.1016/j.neuron.2011.07.005. [DOI] [PMC free article] [PubMed] [Google Scholar]
- Otchy TM, Wolff SB, Rhee JY, Pehlevan C, Kawai R, Kempf A, Gobes SM, Olveczky BP. Acute off-target effects of neural circuit manipulations. Nature. 2015;528:358–363. doi: 10.1038/nature16442. [DOI] [PubMed] [Google Scholar]
- Oyibo HK, Znamenskiy P, Oviedo HV, Enquist LW, Zador AM. Long-term Cre-mediated retrograde tagging of neurons using a novel recombinant pseudorabies virus. Front Neuroanat. 2014;8:86. doi: 10.3389/fnana.2014.00086. [DOI] [PMC free article] [PubMed] [Google Scholar]
- Pachitariu M, Steinmetz N, Kadir S, Carandini M, Harris KD. Kilosort: realtime spike-sorting for extracellular electrophysiology with hundreds of channels. bioRxiv. 2016 doi: 10.1101/061481. [DOI] [Google Scholar]
- Paul A, Crow M, Raudales R, He M, Gillis J, Huang ZJ. Transcriptional Architecture of Synaptic Communication Delineates GABAergic Neuron Identity. Cell. 2017;171:522–539. e520. doi: 10.1016/j.cell.2017.08.032. [DOI] [PMC free article] [PubMed] [Google Scholar]
- Peng Y, Gillis-Smith S, Jin H, Trankner D, Ryba NJ, Zuker CS. Sweet and bitter taste in the brain of awake behaving animals. Nature. 2015;527:512–515. doi: 10.1038/nature15763. [DOI] [PMC free article] [PubMed] [Google Scholar]
- Peron S, Chen TW, Svoboda K. Comprehensive imaging of cortical networks. Curr Opin Neurobiol. 2015a;32:115–123. doi: 10.1016/j.conb.2015.03.016. [DOI] [PubMed] [Google Scholar]
- Peron SP, Freeman J, Iyer V, Guo C, Svoboda K. A Cellular Resolution Map of Barrel Cortex Activity during Tactile Behavior. Neuron. 2015b;86:783–799. doi: 10.1016/j.neuron.2015.03.027. [DOI] [PubMed] [Google Scholar]
- Petreanu L, Gutnisky DA, Huber D, Xu NL, O’Connor DH, Tian L, Looger L, Svoboda K. Activity in motor-sensory projections reveals distributed coding in somatosensation. Nature. 2012;489:299–303. doi: 10.1038/nature11321. [DOI] [PMC free article] [PubMed] [Google Scholar]
- Petreanu L, Huber D, Sobczyk A, Svoboda K. Channelrhodopsin-2-assisted circuit mapping of long-range callosal projections. Nat Neurosci. 2007;10:663–668. doi: 10.1038/nn1891. [DOI] [PubMed] [Google Scholar]
- Pfeiffer BD, Ngo TT, Hibbard KL, Murphy C, Jenett A, Truman JW, Rubin GM. Refinement of tools for targeted gene expression in Drosophila. Genetics. 2010;186:735–755. doi: 10.1534/genetics.110.119917. [DOI] [PMC free article] [PubMed] [Google Scholar]
- Phillips EA, Hasenstaub AR. Asymmetric effects of activating and inactivating cortical interneurons. eLife. 2016;5:e18383. doi: 10.7554/eLife.18383. [DOI] [PMC free article] [PubMed] [Google Scholar]
- Picelli S, Bjorklund AK, Faridani OR, Sagasser S, Winberg G, Sandberg R. Smart-seq2 for sensitive full-length transcriptome profiling in single cells. Nat Methods. 2013;10:1096–1098. doi: 10.1038/nmeth.2639. [DOI] [PubMed] [Google Scholar]
- Pinault D, Deschenes M. Anatomical evidence for a mechanism of lateral inhibition in the rat thalamus. Eur J Neurosci. 1998;10:3462–3469. doi: 10.1046/j.1460-9568.1998.00362.x. [DOI] [PubMed] [Google Scholar]
- Pnevmatikakis EA, Soudry D, Gao Y, Machado TA, Merel J, Pfau D, Reardon T, Mu Y, Lacefield C, Yang W, et al. Simultaneous Denoising, Deconvolution, and Demixing of Calcium Imaging Data. Neuron. 2016;89:285–299. doi: 10.1016/j.neuron.2015.11.037. [DOI] [PMC free article] [PubMed] [Google Scholar]
- Potter CJ, Tasic B, Russler EV, Liang L, Luo L. The Q system: a repressible binary system for transgene expression, lineage tracing, and mosaic analysis. Cell. 2010;141:536–548. doi: 10.1016/j.cell.2010.02.025. [DOI] [PMC free article] [PubMed] [Google Scholar]
- Pyzocha NK, Chen S. Diverse Class 2 CRISPR-Cas Effector Proteins for Genome Engineering Applications. ACS Chem Biol. 2017;13:347–356. doi: 10.1021/acschembio.7b00800. [DOI] [PMC free article] [PubMed] [Google Scholar]
- Quadros RM, Miura H, Harms DW, Akatsuka H, Sato T, Aida T, Redder R, Richardson GP, Inagaki Y, Sakai D, et al. Easi-CRISPR: a robust method for one-step generation of mice carrying conditional and insertion alleles using long ssDNA donors and CRISPR ribonucleoproteins. Genome Biology. 2017;18:92. doi: 10.1186/s13059-017-1220-4. [DOI] [PMC free article] [PubMed] [Google Scholar]
- Ragan T, Kadiri LR, Venkataraju KU, Bahlmann K, Sutin J, Taranda J, Arganda-Carreras I, Kim Y, Seung HS, Osten P. Serial two-photon tomography for automated ex vivo mouse brain imaging. Nat Methods. 2012;9:255–258. doi: 10.1038/nmeth.1854. [DOI] [PMC free article] [PubMed] [Google Scholar]
- Reardon TR, Murray AJ, Turi GF, Wirblich C, Croce KR, Schnell MJ, Jessell TM, Losonczy A. Rabies Virus CVS-N2c(DeltaG) Strain Enhances Retrograde Synaptic Transfer and Neuronal Viability. Neuron. 2016;89:711–724. doi: 10.1016/j.neuron.2016.01.004. [DOI] [PMC free article] [PubMed] [Google Scholar]
- Reijmers LG, Perkins BL, Matsuo N, Mayford M. Localization of a stable neural correlate of associative memory. Science. 2007;317:1230–1233. doi: 10.1126/science.1143839. [DOI] [PubMed] [Google Scholar]
- Ren J, Friedmann D, Xiong J, Liu CD, DeLoach KE, Ran C, Pu A, Sun Y, Weissbourd B, Neve RL, et al. Anatomical, Physiological, and Functional Heterogeneity of the Dorsal Raphe Serotonin System. bioRxiv. 2018 doi: 10.1101/257378. [DOI] [Google Scholar]
- Renier N, Adams EL, Kirst C, Wu Z, Azevedo R, Kohl J, Autry AE, Kadiri L, Umadevi Venkataraju K, Zhou Y, et al. Mapping of Brain Activity by Automated Volume Analysis of Immediate Early Genes. Cell. 2016;165:1789–1802. doi: 10.1016/j.cell.2016.05.007. [DOI] [PMC free article] [PubMed] [Google Scholar]
- Richardson DS, Lichtman JW. Clarifying Tissue Clearing. Cell. 2015;162:246–257. doi: 10.1016/j.cell.2015.06.067. [DOI] [PMC free article] [PubMed] [Google Scholar]
- Richardson DS, Lichtman JW. SnapShot: Tissue Clearing. Cell. 2017;171:496–496. doi: 10.1016/j.cell.2017.09.025. [DOI] [PubMed] [Google Scholar]
- Rickgauer JP, Deisseroth K, Tank DW. Simultaneous cellular-resolution optical perturbation and imaging of place cell firing fields. Nat Neurosci. 2014;17:1816–1824. doi: 10.1038/nn.3866. [DOI] [PMC free article] [PubMed] [Google Scholar]
- Sadakane O, Masamizu Y, Watakabe A, Terada S, Ohtsuka M, Takaji M, Mizukami H, Ozawa K, Kawasaki H, Matsuzaki M, et al. Long-Term Two-Photon Calcium Imaging of Neuronal Populations with Subcellular Resolution in Adult Non-human Primates. Cell reports. 2015;13:1989–1999. doi: 10.1016/j.celrep.2015.10.050. [DOI] [PubMed] [Google Scholar]
- Salzman CD, Britten KH, Newsome WT. Cortical microstimulation influences perceptual judgements of motion direction. Nature. 1990;346:174–177. doi: 10.1038/346174a0. [DOI] [PubMed] [Google Scholar]
- Sano H, Nagai Y, Yokoi M. Inducible expression of retrograde transynaptic genetic tracer in mice. Genesis. 2007;45:123–128. doi: 10.1002/dvg.20273. [DOI] [PubMed] [Google Scholar]
- Schnutgen F, Doerflinger N, Calleja C, Wendling O, Chambon P, Ghyselinck NB. A directional strategy for monitoring Cre-mediated recombination at the cellular level in the mouse. Nat Biotechnol. 2003;21:562–565. doi: 10.1038/nbt811. [DOI] [PubMed] [Google Scholar]
- Schwarz LA, Miyamichi K, Gao XJ, Beier KT, Weissbourd B, DeLoach KE, Ren J, Ibanes S, Malenka RC, Kremer EJ, et al. Viral-genetic tracing of the input-output organization of a central noradrenaline circuit. Nature. 2015;524:88–92. doi: 10.1038/nature14600. [DOI] [PMC free article] [PubMed] [Google Scholar]
- Shekhar K, Lapan SW, Whitney IE, Tran NM, Macosko EZ, Kowalczyk M, Adiconis X, Levin JZ, Nemesh J, Goldman M, et al. Comprehensive Classification of Retinal Bipolar Neurons by Single-Cell Transcriptomics. Cell. 2016;166:1308–1323. e1330. doi: 10.1016/j.cell.2016.07.054. [DOI] [PMC free article] [PubMed] [Google Scholar]
- Shima Y, Sugino K, Hempel CM, Shima M, Taneja P, Bullis JB, Mehta S, Lois C, Nelson SB. A Mammalian enhancer trap resource for discovering and manipulating neuronal cell types. eLife. 2016;5:e13503. doi: 10.7554/eLife.13503. [DOI] [PMC free article] [PubMed] [Google Scholar]
- Singer W. Neuronal synchrony: a versatile code for the definition of relations? Neuron. 1999;24:49–65. 111–125. doi: 10.1016/s0896-6273(00)80821-1. [DOI] [PubMed] [Google Scholar]
- Smith JB, Klug JR, Ross DL, Howard CD, Hollon NG, Ko VI, Hoffman H, Callaway EM, Gerfen CR, Jin X. Genetic-Based Dissection Unveils the Inputs and Outputs of Striatal Patch and Matrix Compartments. Neuron. 2016;91:1069–1084. doi: 10.1016/j.neuron.2016.07.046. [DOI] [PMC free article] [PubMed] [Google Scholar]
- Sofroniew NJ, Flickinger D, King J, Svoboda K. A large field of view two-photon mesoscope with subcellular resolution for in vivo imaging. eLife. 2016;5:e14472. doi: 10.7554/eLife.14472. [DOI] [PMC free article] [PubMed] [Google Scholar]
- Song S, Sjostrom PJ, Reigl M, Nelson S, Chklovskii DB. Highly nonrandom features of synaptic connectivity in local cortical circuits. PLoS Biol. 2005;3:e68. doi: 10.1371/journal.pbio.0030068. [DOI] [PMC free article] [PubMed] [Google Scholar]
- Stachniak TJ, Ghosh A, Sternson SM. Chemogenetic synaptic silencing of neural circuits localizes a hypothalamus-->midbrain pathway for feeding behavior. Neuron. 2014;82:797–808. doi: 10.1016/j.neuron.2014.04.008. [DOI] [PMC free article] [PubMed] [Google Scholar]
- Steinberg EE, Keiflin R, Boivin JR, Witten IB, Deisseroth K, Janak PH. A causal link between prediction errors, dopamine neurons and learning. Nat Neurosci. 2013;16:966–973. doi: 10.1038/nn.3413. [DOI] [PMC free article] [PubMed] [Google Scholar]
- Sternson SM, Roth BL. Chemogenetic tools to interrogate brain functions. Annu Rev Neurosci. 2014;37:387–407. doi: 10.1146/annurev-neuro-071013-014048. [DOI] [PubMed] [Google Scholar]
- Stirman JN, Smith IT, Kudenov MW, Smith SL. Wide field-of-view, multi-region, two-photon imaging of neuronal activity in the mammalian brain. Nat Biotechnol. 2016;34:857–862. doi: 10.1038/nbt.3594. [DOI] [PMC free article] [PubMed] [Google Scholar]
- Stockinger P, Kvitsiani D, Rotkopf S, Tirian L, Dickson BJ. Neural circuitry that governs Drosophila male courtship behavior. Cell. 2005;121:795–807. doi: 10.1016/j.cell.2005.04.026. [DOI] [PubMed] [Google Scholar]
- Stosiek C, Garaschuk O, Holthoff K, Konnerth A. In vivo two-photon calcium imaging of neuronal networks. Proc Natl Acad Sci U S A. 2003;100:7319–7324. doi: 10.1073/pnas.1232232100. [DOI] [PMC free article] [PubMed] [Google Scholar]
- Stuart GJ, Spruston N. Dendritic integration: 60 years of progress. Nat Neurosci. 2015;18:1713–1721. doi: 10.1038/nn.4157. [DOI] [PubMed] [Google Scholar]
- Svoboda K, Block SM. Biological applications of optical forces. Annual Rev Biophys Biomol Structure. 1994;23:247–285. doi: 10.1146/annurev.bb.23.060194.001335. [DOI] [PubMed] [Google Scholar]
- Svoboda K, Denk W, Kleinfeld D, Tank DW. In vivo dendritic calcium dynamics in neocortical pyramidal neurons. Nature. 1997;385:161–165. doi: 10.1038/385161a0. [DOI] [PubMed] [Google Scholar]
- Takemura SY, Bharioke A, Lu Z, Nern A, Vitaladevuni S, Rivlin PK, Katz WT, Olbris DJ, Plaza SM, Winston P, et al. A visual motion detection circuit suggested by Drosophila connectomics. Nature. 2013;500:175–181. doi: 10.1038/nature12450. [DOI] [PMC free article] [PubMed] [Google Scholar]
- Talay M, Richman EB, Snell NJ, Hartmann GG, Fisher JD, Sorkac A, Santoyo JF, Chou-Freed C, Nair N, Johnson M, et al. Transsynaptic Mapping of Second-Order Taste Neurons in Flies by trans-Tango. Neuron. 2017;96:783–795. e784. doi: 10.1016/j.neuron.2017.10.011. [DOI] [PMC free article] [PubMed] [Google Scholar]
- Tan EM, Yamaguchi Y, Horwitz GD, Gosgnach S, Lein ES, Goulding M, Albright TD, Callaway EM. Selective and quickly reversible inactivation of mammalian neurons in vivo using the Drosophila allatostatin receptor. Neuron. 2006;51:157–170. doi: 10.1016/j.neuron.2006.06.018. [DOI] [PubMed] [Google Scholar]
- Tang F, Barbacioru C, Wang Y, Nordman E, Lee C, Xu N, Wang X, Bodeau J, Tuch BB, Siddiqui A, et al. mRNA-Seq whole-transcriptome analysis of a single cell. Nat Methods. 2009;6:377–382. doi: 10.1038/nmeth.1315. [DOI] [PubMed] [Google Scholar]
- Taniguchi H, He M, Wu P, Kim S, Paik R, Sugino K, Kvitsiani D, Fu Y, Lu J, Lin Y, et al. A resource of Cre driver lines for genetic targeting of GABAergic neurons in cerebral cortex. Neuron. 2011;71:995–1013. doi: 10.1016/j.neuron.2011.07.026. [DOI] [PMC free article] [PubMed] [Google Scholar]
- Taniguchi H, Lu J, Huang ZJ. The spatial and temporal origin of chandelier cells in mouse neocortex. Science. 2013;339:70–74. doi: 10.1126/science.1227622. [DOI] [PMC free article] [PubMed] [Google Scholar]
- Tanji J, Evarts EV. Anticipatory activity of motor cortex neurons in relation to direction of an intended movement. J Neurophysiol. 1976;39:1062–1068. doi: 10.1152/jn.1976.39.5.1062. [DOI] [PubMed] [Google Scholar]
- Tasaka G, Guenther CA, Sahlev A, Gilday O, Luo L, Mizrahi A. Maternal plasticity of cording ultrasonic vocalizations in the auditory cortex revealed by genetic tagging of active neurons. Nature communications. 2018;9:871. doi: 10.1038/s41467-018-03183-2. [DOI] [PMC free article] [PubMed] [Google Scholar]
- Tasic B, Hippenmeyer S, Wang C, Gamboa M, Zong H, Chen-Tsai Y, Luo L. Site-specific integrase-mediated transgenesis in mice via pronuclear injection. Proc Natl Acad Sci U S A. 2011;108:7902–7907. doi: 10.1073/pnas.1019507108. [DOI] [PMC free article] [PubMed] [Google Scholar]
- Tasic B, Menon V, Nguyen TN, Kim TK, Jarsky T, Yao Z, Levi B, Gray LT, Sorensen SA, Dolbeare T, et al. Adult mouse cortical cell taxonomy revealed by single cell transcriptomics. Nat Neurosci. 2016;19:335–346. doi: 10.1038/nn.4216. [DOI] [PMC free article] [PubMed] [Google Scholar]
- Tasic B, Yao Z, Smith KA, Graybuck L, Nguyen T, Bertagolli D, Goldy J, Garren E, Economo MN, Viswanathan S, et al. Shared and distinct transcriptomic cell types across neocortical areas. bioRxiv. 2017 doi: 10.1101/229542. [DOI] [PMC free article] [PubMed] [Google Scholar]
- Tervo DG, Hwang BY, Viswanathan S, Gaj T, Lavzin M, Ritola KD, Lindo S, Michael S, Kuleshova E, Ojala D, et al. A Designer AAV Variant Permits Efficient Retrograde Access to Projection Neurons. Neuron. 2016;92:372–382. doi: 10.1016/j.neuron.2016.09.021. [DOI] [PMC free article] [PubMed] [Google Scholar]
- Theis L, Berens P, Froudarakis E, Reimer J, Roman Roson M, Baden T, Euler T, Tolias AS, Bethge M. Benchmarking Spike Rate Inference in Population Calcium Imaging. Neuron. 2016;90:471–482. doi: 10.1016/j.neuron.2016.04.014. [DOI] [PMC free article] [PubMed] [Google Scholar]
- Tian J, Huang R, Cohen JY, Osakada F, Kobak D, Machens CK, Callaway EM, Uchida N, Watabe-Uchida M. Distributed and Mixed Information in Monosynaptic Inputs to Dopamine Neurons. Neuron. 2016;91:1374–1389. doi: 10.1016/j.neuron.2016.08.018. [DOI] [PMC free article] [PubMed] [Google Scholar]
- Tsodyks MV, Skaggs WE, Sejnowski TJ, McNaughton BL. Paradoxical effects of external modulation of inhibitory interneurons. J Neurosci. 1997;17:4382–4388. doi: 10.1523/JNEUROSCI.17-11-04382.1997. [DOI] [PMC free article] [PubMed] [Google Scholar]
- Turner-Evans D, Wegener S, Rouault H, Franconville R, Wolff T, Seelig JD, Druckmann S, Jayaraman V. Angular velocity integration in a fly heading circuit. eLife. 2017;6:e23496. doi: 10.7554/eLife.23496. [DOI] [PMC free article] [PubMed] [Google Scholar]
- Ugolini G. Specificity of rabies virus as a transneuronal tracer of motor networks: transfer from hypoglossal motoneurons to connected second-order and higher order central nervous system cell groups. J Comp Neurol. 1995;356:457–480. doi: 10.1002/cne.903560312. [DOI] [PubMed] [Google Scholar]
- Ugolini G, Kuypers HG, Simmons A. Retrograde transneuronal transfer of herpes simplex virus type 1 (HSV 1) from motoneurones. Brain Res. 1987;422:242–256. doi: 10.1016/0006-8993(87)90931-0. [DOI] [PubMed] [Google Scholar]
- van Vreeswijk C, Sompolinsky H. Chaos in neuronal networks with balanced excitatory and inhibitory activity. Science. 1996;274:1724–1726. doi: 10.1126/science.274.5293.1724. [DOI] [PubMed] [Google Scholar]
- Wall NR, Wickersham IR, Cetin A, De La Parra M, Callaway EM. Monosynaptic circuit tracing in vivo through Cre-dependent targeting and complementation of modified rabies virus. Proc Natl Acad Sci U S A. 2010;107:21848–21853. doi: 10.1073/pnas.1011756107. [DOI] [PMC free article] [PubMed] [Google Scholar]
- Wang W, Wildes CP, Pattarabanjird T, Sanchez MI, Glober GF, Matthews GA, Tye KM, Ting AY. A light- and calcium-gated transcription factor for imaging and manipulating activated neurons. Nat Biotechnol. 2017;35:864–871. doi: 10.1038/nbt.3909. [DOI] [PMC free article] [PubMed] [Google Scholar]
- Wang Y, Guo HF, Pologruto TA, Hannan F, Hakker I, Svoboda K, Zhong Y. Stereotyped odor-evoked activity in the mushroom body of Drosophila revealed by green fluorescent protein-based Ca2+ imaging. J Neurosci. 2004;24:6507–6514. doi: 10.1523/JNEUROSCI.3727-03.2004. [DOI] [PMC free article] [PubMed] [Google Scholar]
- Wertz A, Trenholm S, Yonehara K, Hillier D, Raics Z, Leinweber M, Szalay G, Ghanem A, Keller G, Rozsa B, et al. PRESYNAPTIC NETWORKS. Single-cell-initiated monosynaptic tracing reveals layer-specific cortical network modules. Science. 2015;349:70–74. doi: 10.1126/science.aab1687. [DOI] [PubMed] [Google Scholar]
- White JG, Southgate E, Thomson JN, Brenner S. The structure of the nervous system of the nematode Caenohabditis elegans. Philos Trans R Soc Lond B. 1986;314:1–340. doi: 10.1098/rstb.1986.0056. [DOI] [PubMed] [Google Scholar]
- Wickersham IR, Finke S, Conzelmann KK, Callaway EM. Retrograde neuronal tracing with a deletion-mutant rabies virus. Nat Methods. 2007a;4:47–49. doi: 10.1038/NMETH999. [DOI] [PMC free article] [PubMed] [Google Scholar]
- Wickersham IR, Lyon DC, Barnard RJ, Mori T, Finke S, Conzelmann KK, Young JA, Callaway EM. Monosynaptic restriction of transsynaptic tracing from single, genetically targeted neurons. Neuron. 2007b;53:639–647. doi: 10.1016/j.neuron.2007.01.033. [DOI] [PMC free article] [PubMed] [Google Scholar]
- Wietek J, Wiegert JS, Adeishvili N, Schneider F, Watanabe H, Tsunoda SP, Vogt A, Elstner M, Oertner TG, Hegemann P. Conversion of channelrhodopsin into a light-gated chloride channel. Science. 2014;344:409–412. doi: 10.1126/science.1249375. [DOI] [PubMed] [Google Scholar]
- Wong AM, Wang JW, Axel R. Spatial representation of the glomerular map in the Drosophila protocerebrum. Cell. 2002;109:229–241. doi: 10.1016/s0092-8674(02)00707-9. [DOI] [PubMed] [Google Scholar]
- Xu CS, Hayworth KJ, Lu Z, Grob P, Hassan AM, Garcia-Cerdan JG, Niyogi KK, Nogales E, Weinberg RJ, Hess HF. Enhanced FIB-SEM systems for large-volume 3D imaging. eLife. 2017a;6:e25916. doi: 10.7554/eLife.25916. [DOI] [PMC free article] [PubMed] [Google Scholar]
- Xu Y, Zou P, Cohen AE. Voltage imaging with genetically encoded indicators. Curr Opin Chem Biol. 2017b;39:1–10. doi: 10.1016/j.cbpa.2017.04.005. [DOI] [PMC free article] [PubMed] [Google Scholar]
- Yamamoto M, Wada N, Kitabatake Y, Watanabe D, Anzai M, Yokoyama M, Teranishi Y, Nakanishi S. Reversible suppression of glutamatergic neurotransmission of cerebellar granule cells in vivo by genetically manipulated expression of tetanus neurotoxin light chain. J Neurosci. 2003;23:6759–6767. doi: 10.1523/JNEUROSCI.23-17-06759.2003. [DOI] [PMC free article] [PubMed] [Google Scholar]
- Yang H, Wang H, Shivalila CS, Cheng AW, Shi L, Jaenisch R. One-step generation of mice carrying reporter and conditional alleles by CRISPR/Cas-mediated genome engineering. Cell. 2013;154:1370–1379. doi: 10.1016/j.cell.2013.08.022. [DOI] [PMC free article] [PubMed] [Google Scholar]
- Yang HH, St-Pierre F, Sun X, Ding X, Lin MZ, Clandinin TR. Subcellular Imaging of Voltage and Calcium Signals Reveals Neural Processing In Vivo. Cell. 2016;166:245–257. doi: 10.1016/j.cell.2016.05.031. [DOI] [PMC free article] [PubMed] [Google Scholar]
- Ye L, Allen WE, Thompson KR, Tian Q, Hsueh B, Ramakrishnan C, Wang AC, Jennings JH, Adhikari A, Halpern CH, et al. Wiring and Molecular Features of Prefrontal Ensembles Representing Distinct Experiences. Cell. 2016;165:1776–1788. doi: 10.1016/j.cell.2016.05.010. [DOI] [PMC free article] [PubMed] [Google Scholar]
- Yoshihara Y, Mizuno T, Nakahira M, Kawasaki M, Watanabe Y, Kagamiyama H, Jishage K, Ueda O, Suzuki H, Tabuchi K, et al. A genetic approach to visualization of multisynaptic neural pathways using plant lectin transgene. Neuron. 1999;22:33–41. doi: 10.1016/s0896-6273(00)80676-5. [DOI] [PubMed] [Google Scholar]
- Yoshimura Y, Dantzker JL, Callaway EM. Excitatory cortical neurons form fine-scale functional networks. Nature. 2005;433:868–873. doi: 10.1038/nature03252. [DOI] [PubMed] [Google Scholar]
- Zador AM, Dubnau J, Oyibo HK, Zhan H, Cao G, Peikon ID. Sequencing the connectome. PLoS biology. 2012;10:e1001411. doi: 10.1371/journal.pbio.1001411. [DOI] [PMC free article] [PubMed] [Google Scholar]
- Zeisel A, Munoz-Manchado AB, Codeluppi S, Lonnerberg P, La Manno G, Jureus A, Marques S, Munguba H, He L, Betsholtz C, et al. Brain structure. Cell types in the mouse cortex and hippocampus revealed by single-cell RNA-seq. Science. 2015;347:1138–1142. doi: 10.1126/science.aaa1934. [DOI] [PubMed] [Google Scholar]
- Zeng H, Sanes JR. Neuronal cell-type classification: challenges, opportunities and the path forward. Nat Rev Neurosci. 2017;18:530–546. doi: 10.1038/nrn.2017.85. [DOI] [PubMed] [Google Scholar]
- Zhang F, Wang LP, Brauner M, Liewald JF, Kay K, Watzke N, Wood PG, Bamberg E, Nagel G, Gottschalk A, et al. Multimodal fast optical interrogation of neural circuitry. Nature. 2007;446:633–639. doi: 10.1038/nature05744. [DOI] [PubMed] [Google Scholar]
- Ziv Y, Burns LD, Cocker ED, Hamel EO, Ghosh KK, Kitch LJ, El Gamal A, Schnitzer MJ. Long-term dynamics of CA1 hippocampal place codes. Nat Neurosci. 2013;16:264–266. doi: 10.1038/nn.3329. [DOI] [PMC free article] [PubMed] [Google Scholar]