

Abstract
Clarifying dynamic fluctuations in resting-state connectivity in youth at risk for psychosis (termed clinical high-risk; CHR) may inform our understanding of psychotic disorders, such as schizophrenia, which have been associated with dysconnectivity and aberrant salience processing. Dynamic functional connectivity (DFC) investigations provide insight into how neural networks exchange information over time. Currently, there are no published DFC studies involving CHR youth. This is notable, as understanding how networks may come together and disassociate over time could lend insight into the neural communication that underlies psychosis development and symptomatology. A sliding-window analysis was utilized to examine DFC (defined as the SD over a series of sliding windows) in resting-state scans in a total of 31 CHR youth and 28 controls. Clinical assessments at baseline and 12-months later were conducted.
CHR youth exhibited less DFC (lower SD) in connectivity involving areas of both the SN and DMN with regions involved in sensory, motor, attention, and internal cognitive functions relative to controls. Within CHR youth, this pattern was associated with greater positive symptoms 12 months later, possibly reflecting a mechanism behind aberrant salience processing. Higher SN – DMN inter-network DFC related to elevated baseline negative symptoms, anxiety and depression in CHR youth, which may indicate neurological processes underlying worry and rumination. Overall, through highlighting unique DFC properties within CHR youth and detecting informative links with clinically relevant symptomatology, results support dysconnectivity and aberrant salience processing models of psychosis.
Keywords: dynamic connectivity, psychosis-risk, salience, default mode, dsyconnectivity
Introduction
Resting state connectivity dynamics in youth at risk for psychosis
Schizophrenia is widely conceptualized as a disorder of dysconnectivity (Pettersson-Yeo, Allen, Benetti, McGuire, & Mechelli, 2011) and aberrant salience (Kapur, 2003). These two complimentary hypotheses focus on the origin of psychotic symptoms and lend themselves to investigations of both brain and behavior. The dysconnectivity hypothesis posits that hypo-NMDA receptor functioning causes widespread alterations to neural circuitry, ultimately resulting in symptoms of psychosis (Friston, Brown, Siemerkus, & Stephan, 2016; Stephan, Friston, & Frith, 2009). One specific pathway from dysconnectivity to psychosis may be through a downstream increase of dopamine within the brain (Barkus et al., 2014; Modinos, Allen, Grace, & McGuire, 2015). Such increases in dopaminergic transmission are associated with aberrant salience processing (Kapur, 2003), which refers to the disrupted assignment of value and relevancy to one’s external and internal experience that gives rise to the positive symptoms of psychosis (Kapur, 2003; Modinos, Allen, et al., 2015).
Taken together, these hypotheses prompted inquiry into altered neural circuitry in psychosis. As a result, significant progress has been made in clarifying how disrupted connectivity in schizophrenia may result in symptomatology, particularly in regard to altered frontal-thalamic connections (Chai et al., 2011; Fornito & Bullmore, 2015; Mamah, Barch, & Repovs, 2013; Repovs, Csernansky, & Barch, 2011; M. P. van den Heuvel & Fornito, 2014; Susan Whitfield-Gabrieli et al., 2009). However, the exact relationship among dysconnectivity, salience processing and symptoms in psychosis remains unclear (Fornito & Bullmore, 2015; Friston et al., 2016; Howes & Nour, 2016).
Functional magnetic resonance imaging (fMRI) studies in psychosis have increased dramatically in recent years. A number of specific fMRI methods take advantage of the BOLD signal including task-based fMRI investigations of activation, task-dependent connectivity, and resting state functional connectivity. Task-based fMRI examines regional BOLD response and connectivity patterns associated with changes in task-related cognition. In contrast, resting-state connectivity studies provide information about how networks exchange information intrinsically, without the addition of a specific task or behavior imposed upon the individual. This procedure entails examining the interactions (i.e. correlations in fMRI BOLD signal) between different brain regions during a state of awake rest, which is often associated with unconstrained cognition (Andreasen et al., 1995; Andrews-Hanna, Reidler, Huang, & Buckner, 2010; Fox et al., 2005; Van Dijk et al., 2010). A large portion of neural circuitry research in schizophrenia utilizes resting-state functional connectivity given the ease of assessing complex clinical samples (i.e., only requiring rest in scan) along with the absence of additional confounds due to task.
Two brain networks often emphasized in resting-state research are the salience network (SN) and default mode network (DMN), which are thought to facilitate processing of salient external and internal information. The SN (including the insular cortex and the dorsal anterior cingulate (dACC)) responds to external and internal salient environmental stimuli, and may facilitate switching between other large-scale brain networks (Uddin, 2015). The SN has particular relevance in schizophrenia as disruption in the SN “circuit breaker” (Corbetta, Patel, & Shulman, 2008) process may, through impaired insular modulation of other networks, cause disrupted integration of sensory information and executive function (Palaniyappan & Liddle, 2012; Palaniyappan, Simmonite, White, Liddle, & Liddle, 2013; Uddin, 2015). In contrast, the DMN includes areas of the medial prefrontal cortex (mPFC) and the posterior cingulate (PCC), as well as key cortical and subcortical regions that are anatomically and functionally connected (Andrews-Hanna, Reidler, Sepulcre, Poulin, & Buckner, 2010). The DMN is involved in internally-oriented processes, such as self-referential thinking, mentalizing, memory, mind-wandering, and rumination (Andrews-Hanna, 2012). Evidence in schizophrenia suggests that a hyperactive DMN results in an increased focus on the internal experience, which leads to blurred boundaries between external and internal stimuli and the positive symptoms of psychosis (Buckner, 2013; Susan Whitfield-Gabrieli et al., 2009). Schizophrenia also has hallmark features of a disrupted sense of self (Sass, 2014) and altered social cognitive functioning (Billeke & Aboitiz, 2013; Bora, Yucel, & Pantelis, 2009), both of which make the DMN an area of particular interest in psychosis.
Although static analyses have proven useful in improving our conceptualization of psychopathology, recent evidence suggests that a shift toward dynamic functional connectivity (DFC) analysis may be more informative (Calhoun, et al., 2014; Hutchison, et al., 2013; Rashid, et al., 2016), as brain networks dynamically reconfigure in a manner that may track corresponding shifts in mental state (Zabelina and Andrews-Hanna, 2016). In general, the inference behind DFC in resting-state analyses (as opposed to task-based fMRI) is that it highlights the fluctuating exchange of information occurring within the brain at rest (i.e. the dynamic correlations among regions and networks of the brain). Furthermore, results from DFC analyses have proved superior at correctly classifying psychopathology profiles in comparison to static connectivity (Rashid, et al., 2016). Given the nature of this analysis, DFC investigations may prove especially useful in clarifying the nature of dysconnectivity and salience processing in psychosis.
Only a handful of studies have explored DFC in schizophrenia, and these studies generally show less dynamic variability in correlations between brain regions over time, weaker correlational strength, and unique connectivity “states” compared to controls (i.e. spending a differential amount of time in a specific state of connectivity (often more loosely connected) relative to unaffected controls) (Damaraju et al., 2014; Du et al., 2016; Miller et al., 2016). These findings support the dysconnectivity hypothesis, and are thought to indicate sluggish and less efficient neural processes in schizophrenia. However, the nature of DFC in psychosis is not fully clear, as other work suggests increased variability in resting-state connectivity in schizophrenia (Ma, Calhoun, Phlypo, & Adali, 2014) and studies emphasizing less variability have cautioned against over-interpretation due to potential medication effects on results (Damaraju et al., 2014). Given the complexity of DFC results in formal psychosis, studies assessing DFC properties in youth at risk for psychosis is warranted.
To date, there are no DFC studies in psychosis risk samples – individuals who exhibit clinical symptoms indicating imminent risk for transition to disorders including schizophrenia (termed clinical high-risk or CHR). These CHR individuals experience attenuated positive (e.g. hallucinations and delusions) and negative (e.g. amotivation, asociality, blunted affect) symptoms of psychosis and often show significant decline in functioning (McGlashan, Miller, Woods, Hoffman, & Davidson, 2001). The study of CHR youth has potential to enhance our understanding of individual differences in the trajectory of psychosis development and encourage the study of preventative treatment. Thus, the gap in the DFC literature around CHR youth is significant, as longitudinal research involving this method may improve our knowledge around how neural networks underlie psychotic symptomatology.
The present study aimed to investigate dynamic fluctuations in connectivity and clinical symptomatology in a CHR sample in regions representing the SN and DMN in 31 CHR individuals and 28 comparative healthy controls. We used a sliding window technique to investigate DFC of these two networks with all other areas of the brain, with two primary aims. First, we sought to evaluate group differences in dynamic properties between the CHR and control groups. Although the literature around DFC in schizophrenia is not conclusive, we predicted that regions of the SN and DMN would show less DFC (i.e. less fluctuations, as measured by the standard deviation of correlations across 18 windows) within and between networks in CHR youth relative to controls. This hypothesis was generated based on more recent data with larger schizophrenia samples (i.e. n > 150) showing less DFC properties as being associated with psychosis (Miller et al., 2016).
Second, we investigated relationships between dynamic connectivity and the prodromal syndrome (i.e., attenuated positive and negative symptom domains). Given the presence of less DFC in schizophrenia samples relative to controls (Damaraju et al., 2014; Du et al., 2016; Miller et al., 2016), we believed that less baseline dynamic connectivity would correlate with higher baseline attenuated positive and negative symptoms. Given that we believe less DFC as being related to psychosis, we also expected this pattern of less DFC to be associated with a greater increase in attenuated positive and negative symptoms over the course of 12 months. We also included exploratory analyses involving depressive and anxiety symptoms, as these symptom domains can often characterize the CHR population (Fusar-Poli, Nelson, Valmaggia, Yung, & McGuire, 2014).
Method
Participants
Participants included 59 adolescents/young adults (31 CHR and 28 healthy controls (HC)), aged 16–21 (baseline mean age = 19.08, SD = 1.28, 51% female (30/59)), who were recruited to the Adolescent Development and Preventive Treatment (ADAPT) research program. Exclusion criteria for both groups included history of head injury, neurological disorder, any contraindications to the magnetic resonance imaging (MRI) environment (e.g. current pregnancy or metal in the body), and having a DSM-IV-TR Axis I psychotic disorder or substance dependence. The presence of a psychotic disorder in a first-degree relative or meeting for an Axis I disorder were exclusionary criteria for HC youth. Adult participants provided written informed consent. Parents/legal guardians provided written informed consent on behalf of participants under the age of 18, while minor participants provided written assent for their participation in the study. The present study was approved the University of Colorado Institutional Review Board (IRB) protocol 10-0398.
Measures and Procedure
The Structured Interview for Prodromal Syndromes (SIPS) (McGlashan et al., 2001) was administered to detect the presence of a prodromal syndrome and to track positive and negative symptom dimensions. A prodromal syndrome was defined as (a) recent onset or escalation of moderate levels of attenuated positive symptoms; or (b) the presence of schizotypal personality disorder (SPD) and a decline in global functioning over the last 12 months; or (c) the presence of a first-degree relative with a psychotic disorder such as schizophrenia, coupled with a decline in global functioning over the last 12 months. The Structured Clinical Interview for the Diagnostic and Statistical Manual was administered to determine psychosis and substance dependence diagnoses (SCID-I) (First, Spitzer, Gibbon, & Williams, 1995). Anxiety and depression were assessed using the self-report Beck Anxiety Inventory (BAI) (Beck, Epstein, Brown, & Steer, 1988) and the Beck Depression Inventory (BDI) (Beck, Ward, Mendelson, Mock, & Erbaugh, 1961).
Imaging acquisition and processing
Both structural and functional resting-state scans were acquired using a 3T Siemens Trio scanner. Structural images were acquired with a T1-weighted 3D magnetization prepared rapid gradient multi-echo sequence using a 12-channel head coil (MPRAGE; sagittal plane; repetition time [TR] = 2,530 ms; echo times [TE] = 1.64 ms, 3.5 ms, 5.36 ms, 7.22 ms, 9.08 ms; GRAPPA parallel imaging factor of 2; 1 mm3 isomorphic voxels, 192 interleaved slices; FOV = 256 mm; flip angle = 7°). Additionally, resting state blood-oxygen-level dependent (BOLD) scan was acquired with a T2-weighted echo-planar functional protocol (number of volumes = 165; TR = 2,000ms; TE = 29 ms; matrix size = 64 × 64 × 33; FA = 75°; 3.8 × 3.8 × 3.5 mm3 voxels; 33 slices; FOV = 240 mm). A turbo spin echo proton density (PD)/T2-weighted acquisition (TSE; axial oblique aligned with anterior commissure-posterior commissure line; TR = 3,720 ms; TE = 89 ms; GRAPPA parallel imaging factor of 2; FOV = 240 mm; flip ange: 120°; 0.9 × 0.9 mm2 voxels; 77 interleaved 1.5 mm slices) was generated to investigate incidental pathology. Resting-state scans were 5 minutes and 34 seconds during which participants were instructed to relax and close their eyes. Studies indicate that the functional connectivity MRI (fcMRI) duration utilized in the present study provides equal power to longer scan times (Van Dijk et al., 2010).
Data were preprocessed in FSL (v. 5; http://fsl.fmrib.ox.ac.uk/fsl), which involved motion correction, brain extraction, high-pass filtering (100 s), and spatial smoothing (6mm FWHM). Functional images were aligned to the MNI 2-mm brain template. To correct for motion (J. D. Power, Barnes, Snyder, Schlaggar, & Petersen, 2012), we used the artifact rejection software (ART; http://www.nitrc.org/projects/artifact_detect/) to create confound regressors for motion parameters (3 translation and 3 rotation parameters), and additional confound regressors for specific image frames with outliers based on brain activation and head movement. In order to identify outliers in brain activation, the mean global brain activity (i.e., the mean signal across all voxels) was calculated as a function of time, and was then Z normalized. Outliers were defined as any frames where the global mean signal exceeded 3 SD. Similarly, frame-wise measures of motion (composite measure of total motion (i.e. maximum voxel displacement) across translation and rotation) were used to identify any motion outliers (i.e., motion spikes). Motion outliers were defined as any frame where the motion exceeded 1 mm.
All functional connectivity analyses were performed in the CONN toolbox 15.b (S. Whitfield-Gabrieli & Nieto-Castanon, 2012) and SPM12 (Wellcome Department of Imaging Neuroscience, London, UK; www.fil.ion.ucl.ac.uk/spm). Anatomical images were segmented into gray matter, white matter, and CSF with SPM12 in order to create masks for signal extraction. The CONN toolbox extracts 5 temporal components from the segmented CSF and white matter, which were entered as confound regressors in the subject-level GLM. Motion from the ART toolbox was also included as a confound regressor.
Dynamic analysis
We utilized a sliding window technique to perform DFC analyses based on prior work that utilized sliding windows to investigate major depression using similar scanning acquisition (Kaiser et al., 2015). Sliding-window analysis is one of several techniques used to assess dynamic fluctuations in BOLD signal. Other commonly used methods include using independent component analysis and k-means clustering techniques (see Hutchison et al. 2013 for a review) and dynamic conditional correlational modeling (DCC) (Lindquist, Xu, Nebel, & Caffo, 2014). A number of these methods utilize a multidimensional approach that clusters the BOLD correlations into “states” of processing, providing unique information on the different patterns of network connectivity where individuals and/or groups may linger. In contrast, our sliding-window analysis approach generates a single value – the standard deviation in BOLD signal between two regions, which describes the variability in the signal correlations between two regions across all the sliding windows. High variability would suggest increased switching between networks, which can be understood to mean heightened changes in how regions are communicating with one another. In contrast, low variability would suggest less switching and therefore, more of a constant pattern of communication among brain regions.
We chose the current sliding window analysis due to the straightforward nature of this approach, which would aid in study interpretation, future replication, and dissemination of results. Further, this DFC analysis was previously conducted in a relevant clinical sample (Kaiser et al., 2015) that generated informative findings around neural processes underlying depression. Our sliding-window analysis also allowed for us to hone in on specific seed regions of interest related to the SN and DMN, which was a primary focus of this study.
To implement this sliding window approach, we first changed the standard band-pass filter within CONN to −0.0278 – 0.1Hz, in order to optimize signal-to-noise ratio (SNR) (Kaiser et al., 2015; Leonardi & Van De Ville, 2015). In accordance with guidelines and previous DFC research (Kaiser et al., 2015; Leonardi & Van De Ville, 2015), temporal decomposition was selected in the CONN toolbox and a window of 36 s was selected with a window onset set at 18 s resulting in 18 windows. We defined 5 a priori seeds to represent the SN and DMN (bilateral insula and ACC for SN; mPFC and PCC for DMN) by masking regions of these established resting-state networks from Yeo et al. (2011) (Figure 1). These 5 a priori seeds were chosen based on data suggesting these regions to be key nodes of each network, indicating that they play a central role in their respective network processes (Andrews-Hanna, Reidler, Sepulcre, et al., 2010; Buckner, Andrews-Hanna, & Schacter, 2008; Jonathan D. Power, Schlaggar, Lessov-Schlaggar, & Petersen, 2013; Seeley et al., 2007; Sridharan, Levitin, & Menon, 2008; Martijn P. van den Heuvel & Sporns, 2013). Given that these regions really function together to form a functional network in the brain (i.e. regions do not function in isolation), we believed it necessary to include more than one seed in our analyses of the SN and DMN.
Figure 1.
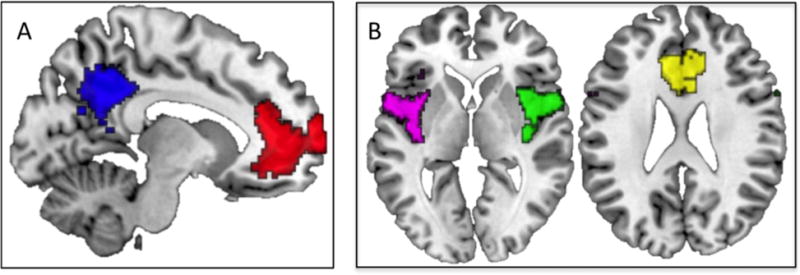
Seed Regions of Interest. A) Saggital slice (x = −6) showing default mode network seeds (medial prefrontal cortex in red, posterior cingulate cortex in blue), B) Axial slices (z = 0 and z = 25, respectively) showing salience network seeds (left insula in violet, right insula in green, and anterior cingulate cortex in yellow) from Yeo et al., 2011.
Group differences in DFC
First-level whole-brain analyses were run within CONN, which generated a beta map (fisher r to z transformed correlation maps), which corresponded to the within-subject connectivity patterns for each region of interest (ROI). This data was generated for each of the 18 windows, for each participant, for each ROI. Next, using in-house scripts, the standard deviation (SD) of each of these beta-maps was computed to get a measure of variability (i.e. a measure of whole-brain DFC for each seed, which was our main outcome variable). We moved these first-level results up for group-level analyses and conducted 5 whole-brain GLMs investigating group differences in DFC (one for each ROI). Results of all analyses were thresholded at the voxel-level at Puncorrected <0.001 and then corrected at the cluster-level using a family-wise error rate (FWE) of P<0.05. We examined these group differences with and without controlling for motion and antipsychotic medication usage, with no significant changes to results.
DFC relationship with symptoms
We then examined the CHR group alone to determine whether the regions emerging in the between-group analysis linked with symptomatology, and specifically baseline and change in positive and negative symptoms (12 month scores – baseline scores). The primary outcome measure in these analyses included the bivariate correlation between DFC (i.e. SD of correlations) and symptoms. These bivariate correlational analyses were conducted within SPSS using the standard deviation value extracted from the regions that emerged from the group difference results. As secondary analyses, we examined baseline and 12-month relationships (change scores) with anxiety and depression to determine specificity, as the present sample exhibited rates of comorbid depressive and anxiety disorders at 16% (5/31) and 32% (10/31), respectively, similar to previous CHR meta-analyses (Fusar-Poli et al., 2014). All change-score analyses controlled for the presence of baseline symptoms.
Within the CHR group, exploratory analyses were also conducted examining the relationship between the left insula – whole brain connectivity and both baseline and change in positive and negative symptoms. This further analysis was conducted because the left insula appeared as both significant when testing relationships involving the significant between-group brain regions and symptomatology. The goal of this whole-brain analysis was to determine if there were informative symptom relationships with other regions that did not show up as being significantly different between groups. Relationships between left insula - whole-brain connectivity with symptoms were evaluated within SPM. Results of the SPM whole-brain investigation were additionally thresholded at the voxel-level at Puncorrected <0.001 and then corrected at the cluster-level using a family-wise error rate (FWE) of P<0.01. Notably, all of these DFC – symptom analyses were conducted with and without covarying for antipsychotic usage and motion (from ART analysis), and the direction and magnitude of the results did not significantly change.
For those relationships that emerged as significant with symptomatology, we also evaluated the ratio of positive to negative windows for each group, similar to previous work (Kaiser et al., 2015). The goal of this analysis of the sliding windows was to determine whether the groups differed in the time they spent in a positive versus a negative correlational state, as this data could inform interpretations of why associations with symptoms exist.
Statistical analysis
Independent two-tailed t-tests and chi-square tests were conducted in SPSS v.23 (IBM, IBM Corp. Released 2015) to evaluate group differences in demographic variables, symptoms, and ART scanner movement measure of motion and outliers.
Results
Sample Characteristics
Despite similar demographic profiles across groups, all measures of clinical symptomatology were significantly greater in CHR than HCs at both time points, consistent with prior studies (Fusar-Poli et al., 2014) (Table 1). A small percentage of the CHR sample utilized antipsychotics at both time points, and 7% (2/31) transitioned to a psychotic disorder at the 12-month assessment. Importantly, the two groups did not significantly differ with respect to ART composite motion and intensity outlier estimates (Table 1).
Table 1.
Sample Characteristics
| Variable | Baseline CHR (N = 31) |
Baseline HC (N = 28) |
12-month CHR (N = 31) |
12-month HC (N = 28) |
|---|---|---|---|---|
| Sex (male) | 61% (19/31) | 36% (10/28) | 61% (19/31) | 36% (10/28) |
| Age | 19.10 (1.14) | 19.07 (1.44) | 20.04 (1.48) | 20.23 (1.72) |
| Race (white) | 71% (22/31) | 50% (14/28) | 71% (22/31) | 50% (14/28) |
| Positive Symptoms** | 12.52 (3.94) | 0.64 (1.34) | 11.61 (6.52) | 0.29 (0.66) |
| Negative Symptoms** | 10.58 (6.57) | 0.46 (0.84) | 9.61 (7.99) | 0.21 (0.50) |
| Antipsychotic usage | 7% (2/31) | 0% (0/28) | 19% (6/31) | 0% (0/28) |
| Psychosis conversion | 0% (0/31) | 0% (0/28) | 7% (2/31) | 0% (0/28) |
| ART Motion | 0.28 (0.24) | 0.30 (0.44) | — | — |
| ART Outliers | 5.42 (4.60) | 7.00 (7.52) | — | — |
Note.
indicates significant group differences at P<0.05 for both time points. CHR (clinical high-risk); HC (healthy control). Attenuated positive symptoms and negative symptoms are the total scores for each domain derived from the Structured Interview for Prodromal Syndromes. ART (artifact rejection software). ART Motion refers to the mean (SD) of composite motion score; ART Outliers refers to mean (SD) number of participants where the global mean signal exceeded 3 SD.
Group differences in DFC
In support of our hypotheses, the CHR individuals showed less DFC (i.e. less variability in correlations) involving SN and DMN regions. Specifically, CHR youth exhibited less DFC from the left insula (SN) to the right precuneus, left precentral gyrus, and left superior temporal gyrus (LSTG) compared to the HC group. The CHR group also showed less DFC from the mPFC (DMN) to right temporal parietal junction (TPJ), and less DFC from the left PCC (DMN) to precentral and postcentral gyri, supramarginal gyrus, and superior frontal gyrus, relative to HCs (Figure 2, Table 2). Contrary to expectations, there were no significant group differences involving the right insula or ACC.
Figure 2.
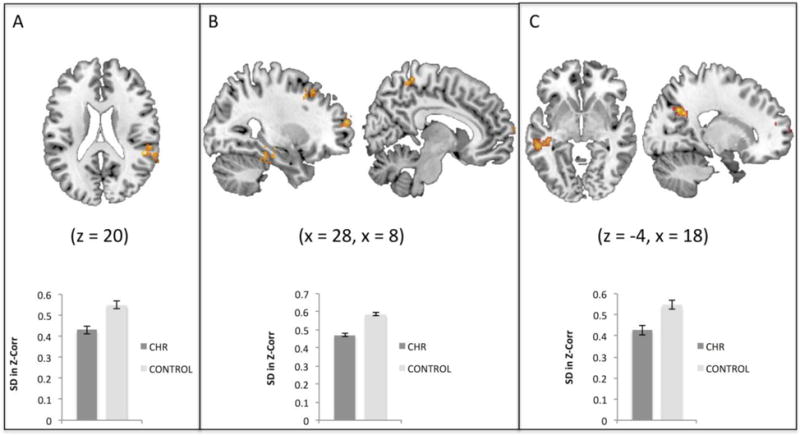
Group differences in dynamic functional connectivity. A) Clinical high-risk (CHR) youth showed less dynamic functional connectivity (DFC) between the medial prefrontal cortex (DMN region – not shown here) and right temporal parietal junction (shown in red/yellow) in comparison with the HC group, B) CHR showed less DFC between the posterior cingulate cortex (DMN region – not shown here) and right precentral gyrus, left postcentral gyrus, right supramarginal gyrus, and right superior frontal gyrus relative to HC individuals, C) The CHR group exhibited less DFC relative to HCs between the left insula (SN region – not shown here) and right precuneus, left precentral gyrus, and left superior temporal gyrus. Images are thresholded here for viewing purposes at the initial level of P<0.005, and cluster corrected using FWE at P<0.05.
Table 2.
Group Differences in Dynamic Connectivity
| Regions | Size | MNI Coordinates
|
t | ||
|---|---|---|---|---|---|
| x | y | z | |||
| mPFC – R. TPJ | 55 | 52 | −38 | 20 | 5.02 |
| PCC – R. Precentral Gyrus | 35 | 48 | 0 | 30 | 4.88 |
| PCC – L. Postcentral Gyrus | 39 | −16 | −44 | 56 | 4.88 |
| PCC – R. Supramarginal Gyrus | 36 | 48 | −36 | 50 | 4.80 |
| PCC – R. Superior Frontal Gyrus | 34 | 20 | 18 | 38 | 4.66 |
| LI – R. Precuneus | 63 | 16 | −66 | 32 | 5.36 |
| LI – L. Precentral Gyrus | 35 | −38 | −22 | 56 | 4.40 |
| LI – L. Superior Temporal Gyrus | 36 | −54 | −36 | −4 | 4.39 |
Note. Group differences in baseline dynamic connectivity between clinical high-risk (CHR) youth and comparative HCs (healthy controls). All results showed that the CHR group exhibited less dynamic connectivity relative to the HC group. Results of all analyses were thresholded at the voxel-level at Puncorrected <0.001 and then corrected at the cluster-level using a family-wise error rate of P<0.05 Abbreviations: LI (left insula), mPFC (medial prefrontal cortex), PCC (posterior cingulate cortex), TPJ (temporal parietal junction), R (right) and L (left).
DFC relationship with symptoms
There were no significant relationships between the regions emerging in the between-group DFC analysis and positive symptoms (either baseline or change in symptoms). However, in the whole-brain exploratory analysis, a significant relationship existed whereby less baseline DFC (less variability) of the left insula with regions including the posterior STG (an area mapping onto Yeo et al.’s SN) (Yeo et al., 2011), visual and somatomotor cortex was associated with having an increase in positive symptoms over the course of the 12 months, which fit with a priori hypotheses (Figure 3, Table 3). Closer inspection of the dynamic windows for these regions revealed no significant group differences in time spent in positive versus negative correlational state. Both groups exhibited the same ratio of positive versus negative correlations across windows (18/18 positive windows for both groups) (Figure 5), suggesting that the CHR relationship with symptoms was more related to variability of DFC as opposed to the nature of the correlations.
Figure 3.
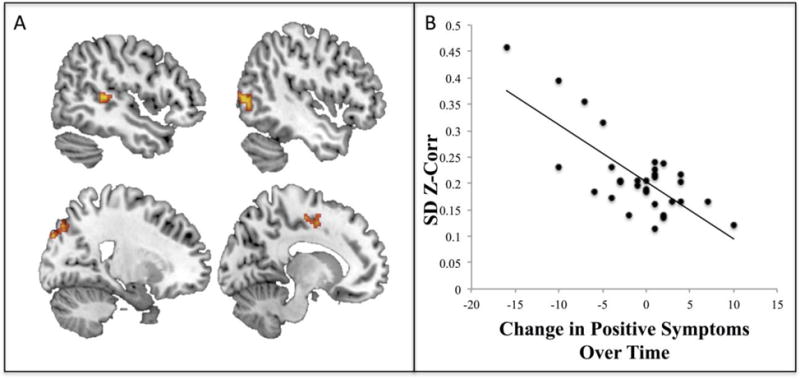
Whole-brain dynamic functional connectivity links with psychosis symptoms. A) Less whole-brain dynamic functional connectivity (DFC) of the left insula with the right superior temporal gyrus, right lateral occipital cortex (LOC), left LOC, and left supplementary motor cortex (clockwise from top left: x = 47, x = −46, x = 21, x = −13; clusters met threshold criteria (primary of P<0.001, and FWE cluster correction at P<0.01)). B) Scatterplot presented solely for display purposes only showing that lower baseline DFC was related to having increasing positive symptoms over time (i.e. a greater change in symptoms between 12 months and baseline).
Table 3.
Whole-brain dynamics of the left insula are associated with changes in positive symptoms
| Regions | Size | MNI Coordinates
|
t | ||
|---|---|---|---|---|---|
| x | y | z | |||
| posterior superior temporal gyrus | 76 | 48 | −34 | 6 | 5.85 |
| superior lateral occipital cortex | 98 | 16 | −84 | 38 | 5.35 |
| inferior lateral occipital cortex | 85 | −50 | −76 | 8 | 5.34 |
| anterior parahippocampal gyrus | 53 | −24 | −12 | −40 | 5.14 |
| supplementary motor cortex | 64 | −6 | −2 | 56 | 5.13 |
| precentral gyrus | 50 | −40 | −14 | 42 | 4.82 |
Note. Results of whole brain analysis showed that dynamics involving the left insula were significantly related to having increasing positive symptoms at 12-months. Results of all analyses were thresholded at the voxel-level at Puncorrected <0.001 and then corrected at the cluster-level using a family-wise error rate of P<0.01.
Figure 5.
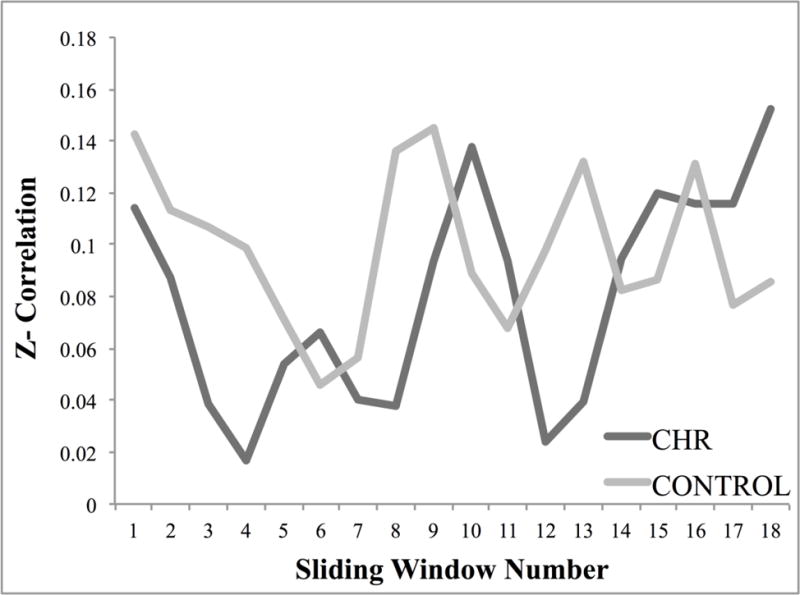
Sliding window correlations. Figure 5 shows the fisher z-transformed correlation value of each window for the CHR (clinical high-risk) and healthy control groups involving the left insula with the superior temporal gyrus, bilateral lateral occipital cortex, supplementary motor cortex, and parahippocapal gyrus. Both groups spent 18/18 windows in a state of positive connectivity.
Higher variability of DFC between the left insula and left STG related to higher levels of baseline negative symptoms in CHR youth (r = 0.37, p = 0.04), which was contrary to the hypothesized direction. There were no significant relationships between group differences in DFC and change in negative symptoms. Notably, there was also a significant relationship involving higher fluctuations of DFC between the left insula and left STG with higher baseline levels of anxiety (r = 0.48, P<0.01) and depressive symptoms (r = 0.45, P=0.01) in CHR youth (Figure 4), but no relationship involving change in these symptom domains at 12-months. Further analysis of DFC between left insula and left STG revealed that both groups spent the same amount of time (i.e. 15/18 windows) in a state of negative connectivity. Again, the similar window correlations between groups suggest an emphasis on the importance variability of DFC as opposed to correlation type in relation to symptomatology (Figure 6).
Figure 4.
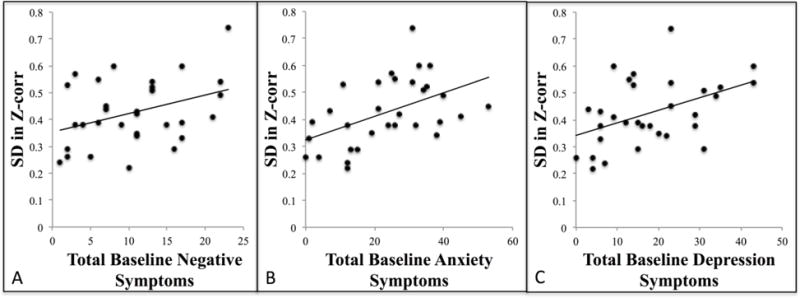
DFC correlations with symptoms. A) Higher baseline dynamic functional connectivity was significantly associated with higher baseline negative symptoms (r = 0.37, P=0.04), B) higher baseline anxiety symptoms (r = 0.48, P<0.01), and C) higher baseline depression symptoms (r = 0.45, P=0.01).
Figure 6.
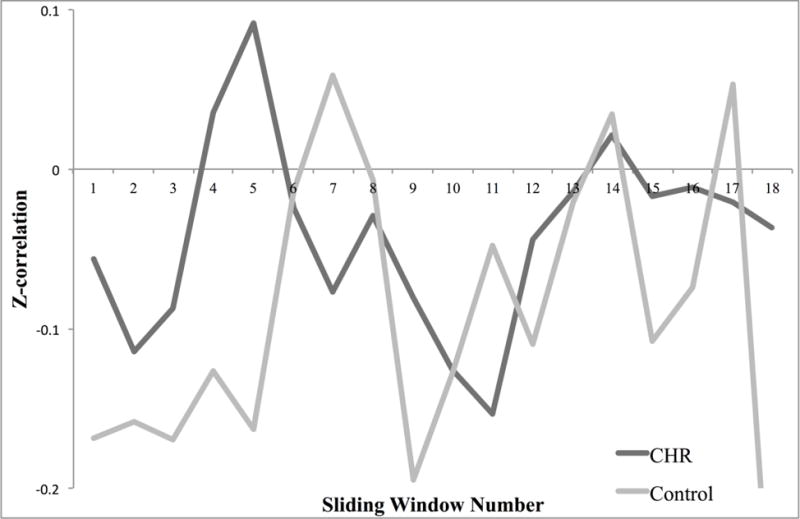
Sliding window correlations. Figure 6 shows the fisher z-transformed correlation value for each window for the CHR (clinical high-risk) and healthy control groups (HC) involving the left insula with the left superior temporal gyrus. Both groups spent 15/18 windows in a state of negative connectivity.
Discussion
Investigating how neural networks come together and dissolve over time in their relationship with one another is informative to our understanding of the neural basis of behavior. While dynamic studies exist in schizophrenia, the present study is the first to evaluate DFC of resting-state fMRI in a CHR sample. The unique dynamic analysis and the longitudinal nature of the study are notable, as this method allows for us to see how neural networks switch and correspond with clinical symptomatology, mapping who worsens over time and the neural profile that relates to symptom changes. In the present study, unique DFC patterns emerged for positive and negative symptoms. Specifically, CHR youth showed less baseline dynamic fluctuations between the SN and sensory regions, which was associated with an increase in positive symptoms 12 months later, highlighting a potential neural basis for the process of aberrant salience. Higher baseline inter-network fluctuations between the SN and DMN in CHR youth were related to more negative symptoms, depression and anxiety, which may reflect a mechanism underlying worry and/or rumination. The results support existing literature in schizophrenia showing aberrant dynamic connectivity (Damaraju et al., 2014; Miller et al., 2016) and extend these findings to an at-risk sample by focusing on the SN and DMN, further supporting a role of dysconnectivity and aberrant salience processing in psychosis.
Group differences in DFC
Three group differences emerged involving the left insula, mPFC, and PCC regions indicating that CHR youth exhibit less DFC involving these regions relative to controls, similar to the larger body of work in schizophrenia (Damaraju et al., 2014; Du et al., 2016; Miller et al., 2016). Only the left insular cortex of the SN was associated with symptomatology, which challenges interpretation of these DMN regional group differences. It is possible that other behavioral domains or symptomatology would have shown relationships to the CHR group’s aberrant DMN DFC. For example, studies utilizing static resting-state and task-based fMRI have linked the DMN with aberrant salience processing (Pankow et al., 2016), cognition (Mason et al., 2007; Weissman, Roberts, Visscher, & Woldorff, 2006; S. Whitfield-Gabrieli & Ford, 2012), body perception disturbances (Wotruba et al., 2014), emotion recognition (Pelletier-Baldelli, Bernard, & Mittal, 2015) and social functioning (Dodell-Feder, Delisi, & Hooker, 2014), none of which were directly assessed in the present study. However, considering group status is based on the presence of a prodromal syndrome (e.g. attenuated positive symptoms), these DMN regional group differences may still be meaningful, despite a lack of direct relationship with symptomatology.
DFC relationship with symptoms
Less dynamic variability of the left insula (a region of the SN) was associated with having a greater increase in positive symptoms over time. Previous DFC work has linked the positive symptoms of psychosis with reduced whole-brain dynamic connectivity (Miller et al., 2016). If we consider the SN’s function as a “circuit breaker” (Corbetta et al., 2008; Uddin, 2015) to cue other networks to come online and respond to salient stimuli, then it may be that the CHR group’s SN is functioning less efficiently (i.e. not communicating well with other networks and regions). This finding reflects back to the aberrant salience model of psychosis – if the SN is less efficient in regulating neural functioning, aberrant salience may get attributed to otherwise irrelevant internal and external stimuli through a deficient inability to integrate sensory information (Palaniyappan & Liddle, 2012), giving rise to positive symptoms. The clinical relevancy of this finding is notable, particularly given the relationship with increasing positive symptoms over time. Currently, only 10–30% of youth identified as being CHR will be diagnosed with a psychosis illness within a 24-month period (Cannon et al., 2008; Fusar-Poli et al., 2012; Woods et al., 2009). It remains vital to continue to improve our ability to predict risk for various psychopathology, as the majority of those identified as CHR for psychosis do not actually develop a psychotic disorder. Within this context, the present result suggests that a less efficient SN may aid in our ability to differentiate which individuals within the psychosis-risk population are at an even greater risk of a formal psychotic disorder.
It is difficult to interpret this result in the context of the existing literature. Although SN connectivity with regions such as the ventral striatum and DMN has been associated with positive symptoms (Orliac et al., 2013; Wotruba et al., 2014), there is minimal work examining its exact role in aberrant salience processing, while there is evidence directly linking dopaminergic transmission, ventral striatal response (Roiser, Howes, Chaddock, Joyce, & McGuire, 2013) and reduced mPFC activation (Modinos, Tseng, et al., 2015; Pankow et al., 2016) to aberrant salience processing. Furthermore, there exist no studies examining the DFC of the SN within the framework of understanding how aberrant salience originates. Thus, the inferences of the present study regarding the function of reduced fluctuations among SN and sensory regions would need to be tested with other paradigms, such as task-based fMRI to determine exact relationships between behavior and neural processing.
Dynamic connectivity of the left insula – STG (a region of Yeo et al’s DMN) (Yeo et al., 2011) was associated with higher baseline negative symptoms. This finding is noteworthy because unique DFC patterns emerged for the two symptom categories (i.e. positive versus negative). These different neurological signatures highlight the heterogeneous nature of psychosis, and may be informative to understanding presentations dominated by one domain versus the other.
The present study indicates a nuanced role of the internetwork communication between the SN and DMN in CHR symptoms, as findings suggested a lack of specificity of the relationship between left insula – STG DFC and negative symptoms. Not surprisingly, we found that left insula – STG DFC was also moderately associated with both anxiety and depression symptomatology, which is supported by evidence showing that negative symptoms in CHR are closely tied to anxiety and depression (Millan, Fone, Steckler, & Horan, 2014). At the neural circuit level, there is extensive evidence showing that the left insula, and the insula more broadly, as well as the superior temporal gyrus and DMN, have been repeatedly linked to the negative symptoms of schizophrenia (Manoliu et al., 2013; Palaniyappan & Liddle, 2012). Furthermore, studies exist implicating a role of the SN in anxiety and anxious anticipation (Alvarez et al., 2015; Geng, Li, Chen, Li, & Gu, 2016; Seeley et al., 2007), with other work showing that the DMN is involved in symptoms of anxiety through a dysfunctional emphasis on self-referential thinking relating to worry (Coutinho et al., 2016). Research examining DFC in depression showed that increased dynamic switching between the insula and DMN was associated with higher levels of rumination in individuals with major depressive disorder (Kaiser et al., 2015). Thus, there is a robust literature supporting our finding that SN – DMN DFC plays a role in the manifestation negative symptoms, anxiety, and depression.
The clinical implications of the heightened dynamic SN – DMN communication can be interpreted in light of considering the function of each network – the SN as being attuned to salient internal and external stimuli and the DMN as being involved in self-referential thought and rumination. Within this context, CHR youth may be more likely to notice environmental and/or internal stimuli (e.g. people, thoughts, sensations), worry or ruminate about the stimuli, notice it again, and continue to worry and/or ruminate. Such a process would undoubtedly link to negative symptoms such as asociality and/or lack of motivation and persistence toward goals, as well as anxiety and depression. In fact, it has been hypothesized that faulty switching among networks due to insula dysfunction may link with impaired attention (Palaniyappan & Liddle, 2012), and presence of anxiety and depression are known to be associated with avolition and apathy (Fusar-Poli et al., 2014).
The altered SN – DMN communication links to work from other groups and from our own research. Specifically, we showed that altered static connectivity between these two networks was evident in a psychosis risk sample (Pelletier-Baldelli et al., 2015). Similarly, other work has found reduced influence of the SN on the DMN in individuals diagnosed with schizophrenia (Manoliu et al., 2014; Palaniyappan et al., 2013). The current results and the larger body of literature is suggestive of an altered role of the SN in coordinating network switching to appropriately respond to external and internal stimuli (Uddin, 2015). In sum, dysconnectivity and disrupted processing of salient stimuli, as evidenced by altered SN – DMN DFC, may be one mechanism that underlies negative symptoms, anxiety, and depression in CHR youth.
There are some limitations to the present study, and particularly the methodology, that should be noted. First, this study did not directly measure other relevant areas of symptomatology, including aberrant salience processing. Future work would benefit from directly including tasks assessing salience processing. Most notably perhaps, DFC analyses are particularly sensitive to noise, and the influence of noise remains a concern in interpreting dynamic results (Hutchison et al., 2013; Leonardi & Van De Ville, 2015). Of note, we made several careful attempts to remove the impact of physiological and scanner-related noise by identifying and regressing out motion and intensity outlier frames (i.e. “censoring”), and by choosing an appropriate window size. Furthermore, motion parameters did not significantly differ between groups (see Table 1), and controlling for motion at the between-subjects level did not alter the results. Relatedly, interpreting DFC remains an area of contention (Hindriks et al., 2016), and there is some debate as to what dynamic fluctuations in BOLD signal reflect and what modeling method best captures these fluctuations (Hindriks et al., 2016; Hutchison et al., 2013). Continued research into DFC will be important in order to clarify the ambiguity that remains around methodology and interpretation. Despite these limitations, it is important to note that adjunctive static analyses (see supplemental data) did not show any group differences involving the left insula, which underscores that the current dynamic analysis afforded a unique look at these networks and relationships to symptoms that would otherwise have gone unnoticed.
Conclusion
In conclusion, the present study shows that individuals at risk for psychosis exhibit fewer fluctuations in connectivity involving the SN and DMN relative to their unaffected peers. Within the CHR group, less baseline dynamic fluctuations between the SN and sensory regions were related to exhibiting a greater increase in positive symptoms 12 months later, which may reflect aberrant salience processing resulting from the SN being less efficient in communicating effectively with other networks to cue or turn off functioning. Higher baseline inter-network fluctuations between the SN and DMN in CHR youth were related to more negative symptoms, depression and anxiety, which may be a result of a heightened experiencing of internal and external stimuli as salient and responding with worry and/or rumination. Overall, results support both the dysconnectivity hypothesis and aberrant salience model of schizophrenia through highlighting unique SN and DMN DFC properties within CHR youth and provide informative links with clinically relevant symptomatology.
Supplementary Material
General Scientific Summary.
This study suggests that examining how brain regions come together and disassociate over time at a more detailed level may provide additional information about how the brain relates to symptoms associated with psychosis risk.
Acknowledgments
Funding for this study was provided by the National Institute of Mental Health F31MH100821 to A.P. and R01MH094650 to V.A.M. The authors would like to thank Derek J. Dean, M.A., Emily Carol, M.A., and Raena Newberry, B.A at the University of Colorado Boulder, along with Tina Gupta, B.A. at Northwestern University for their contribution to data collection, as well as thank Yoni Ashar, M.A. and R. McKell Carter, Ph.D., who were consulted during the analysis.
Footnotes
The data presented here are original, and have not been published in any form. An earlier version of this analysis was presented at the Society for Research in Psychopathology conference in Baltimore, MD in 2016.
Authors Pelletier-Baldelli and Dr. Andrews-Hanna report no biomedical financial interests or potential conflicts of interest.
References
- Alvarez RP, Kirlic N, Misaki M, Bodurka J, Rhudy JL, Paulus MP, Drevets WC. Increased anterior insula activity in anxious individuals is linked to diminished perceived control. Transl Psychiatry. 2015;5:e591. doi: 10.1038/tp.2015.84. [DOI] [PMC free article] [PubMed] [Google Scholar]
- Andreasen NC, O’Leary DS, Cizadlo T, Arndt S, Rezai K, Watkins GL, Hichwa RD. Remembering the past: two facets of episodic memory explored with positron emission tomography. The American journal of psychiatry. 1995;152(11):1576–1585. doi: 10.1176/ajp.152.11.1576. [DOI] [PubMed] [Google Scholar]
- Andrews-Hanna JR. The brain’s default network and its adaptive role in internal mentation. The Neuroscientist : a review journal bringing neurobiology, neurology and psychiatry. 2012;18(3):251–270. doi: 10.1177/1073858411403316. [DOI] [PMC free article] [PubMed] [Google Scholar]
- Andrews-Hanna JR, Reidler JS, Huang C, Buckner RL. Evidence for the default network’s role in spontaneous cognition. Journal of neurophysiology. 2010;104(1):322–335. doi: 10.1152/jn.00830.2009. [DOI] [PMC free article] [PubMed] [Google Scholar]
- Andrews-Hanna JR, Reidler JS, Sepulcre J, Poulin R, Buckner RL. Functional-anatomic fractionation of the brain’s default network. Neuron. 2010;65(4):550–562. doi: 10.1016/j.neuron.2010.02.005. [DOI] [PMC free article] [PubMed] [Google Scholar]
- Barkus C, Sanderson DJ, Rawlins JN, Walton ME, Harrison PJ, Bannerman DM. What causes aberrant salience in schizophrenia? A role for impaired short-term habituation and the GRIA1 (GluA1) AMPA receptor subunit. Molecular psychiatry. 2014;19(10):1060–1070. doi: 10.1038/mp.2014.91. [DOI] [PMC free article] [PubMed] [Google Scholar]
- Beck AT, Epstein N, Brown G, Steer RA. An inventory for measuring clinical anxiety: psychometric properties. J Consult Clin Psychol. 1988;56(6):893–897. doi: 10.1037//0022-006x.56.6.893. [DOI] [PubMed] [Google Scholar]
- Beck AT, Ward CH, Mendelson M, Mock J, Erbaugh J. An inventory for measuring depression. Archives of general psychiatry. 1961;4:561–571. doi: 10.1001/archpsyc.1961.01710120031004. [DOI] [PubMed] [Google Scholar]
- Billeke P, Aboitiz F. Social cognition in schizophrenia: from social stimuli processing to social engagement. Frontiers in psychiatry/Frontiers Research Foundation. 2013;4:4. doi: 10.3389/fpsyt.2013.00004. [DOI] [PMC free article] [PubMed] [Google Scholar]
- Bora E, Yucel M, Pantelis C. Theory of mind impairment in schizophrenia: meta-analysis. Schizophrenia research. 2009;109(1–3):1–9. doi: 10.1016/j.schres.2008.12.020. [DOI] [PubMed] [Google Scholar]
- Buckner RL. The brain’s default network: origins and implications for the study of psychosis. Dialogues in clinical neuroscience. 2013;15(3):351–358. doi: 10.31887/DCNS.2013.15.3/rbuckner. [DOI] [PMC free article] [PubMed] [Google Scholar]
- Buckner RL, Andrews-Hanna JR, Schacter DL. The brain’s default network: anatomy, function, and relevance to disease. Ann N Y Acad Sci. 2008;1124:1–38. doi: 10.1196/annals.1440.011. [DOI] [PubMed] [Google Scholar]
- Cannon TD, Cadenhead K, Cornblatt B, Woods SW, Addington J, Walker E, Heinssen R. Prediction of psychosis in youth at high clinical risk: a multisite longitudinal study in North America. Archives of general psychiatry. 2008;65(1):28–37. doi: 10.1001/archgenpsychiatry.2007.3. [DOI] [PMC free article] [PubMed] [Google Scholar]
- Chai XJ, Whitfield-Gabrieli S, Shinn AK, Gabrieli JD, Nieto Castanon A, McCarthy JM, Ongur D. Abnormal medial prefrontal cortex resting-state connectivity in bipolar disorder and schizophrenia. Neuropsychopharmacology : official publication of the American College of Neuropsychopharmacology. 2011;36(10):2009–2017. doi: 10.1038/npp.2011.88. [DOI] [PMC free article] [PubMed] [Google Scholar]
- Corbetta M, Patel G, Shulman GL. The reorienting system of the human brain: from environment to theory of mind. Neuron. 2008;58(3):306–324. doi: 10.1016/j.neuron.2008.04.017. [DOI] [PMC free article] [PubMed] [Google Scholar]
- Coutinho JF, Fernandesl SV, Soares JM, Maia L, Goncalves OF, Sampaio A. Default mode network dissociation in depressive and anxiety states. Brain Imaging Behav. 2016;10(1):147–157. doi: 10.1007/s11682-015-9375-7. [DOI] [PubMed] [Google Scholar]
- Damaraju E, Allen EA, Belger A, Ford JM, McEwen S, Mathalon DH, Calhoun VD. Dynamic functional connectivity analysis reveals transient states of dysconnectivity in schizophrenia. Neuroimage Clin. 2014;5:298–308. doi: 10.1016/j.nicl.2014.07.003. [DOI] [PMC free article] [PubMed] [Google Scholar]
- Dodell-Feder D, Delisi LE, Hooker CI. The relationship between default mode network connectivity and social functioning in individuals at familial high-risk for schizophrenia. Schizophrenia research. 2014;156(1):87–95. doi: 10.1016/j.schres.2014.03.031. [DOI] [PMC free article] [PubMed] [Google Scholar]
- Du Y, Pearlson GD, Yu Q, He H, Lin D, Sui J, Calhoun VD. Interaction among subsystems within default mode network diminished in schizophrenia patients: A dynamic connectivity approach. Schizophrenia research. 2016;170(1):55–65. doi: 10.1016/j.schres.2015.11.021. [DOI] [PMC free article] [PubMed] [Google Scholar]
- First M, Spitzer R, Gibbon M, Williams J. Structured Clinical Interview for the DSM-IV Axis I Disorders (SCID-I) Patient Edition. American Psychiatric Press; Washington, DC: 1995. [Google Scholar]
- Fornito A, Bullmore ET. Reconciling abnormalities of brain network structure and function in schizophrenia. Current opinion in neurobiology. 2015;30:44–50. doi: 10.1016/j.conb.2014.08.006. [DOI] [PubMed] [Google Scholar]
- Fox MD, Snyder AZ, Vincent JL, Corbetta M, Van Essen DC, Raichle ME. The human brain is intrinsically organized into dynamic, anticorrelated functional networks. Proceedings of the National Academy of Sciences of the United States of America. 2005;102(27):9673–9678. doi: 10.1073/pnas.0504136102. [DOI] [PMC free article] [PubMed] [Google Scholar]
- Friston K, Brown HR, Siemerkus J, Stephan KE. The dysconnection hypothesis (2016) Schizophrenia research. 2016;176(2–3):83–94. doi: 10.1016/j.schres.2016.07.014. [DOI] [PMC free article] [PubMed] [Google Scholar]
- Fusar-Poli P, Bonoldi I, Yung AR, Borgwardt S, Kempton MJ, Valmaggia L, McGuire P. Predicting psychosis: meta-analysis of transition outcomes in individuals at high clinical risk. Archives of general psychiatry. 2012;69(3):220–229. doi: 10.1001/archgenpsychiatry.2011.1472. [DOI] [PubMed] [Google Scholar]
- Fusar-Poli P, Nelson B, Valmaggia L, Yung AR, McGuire PK. Comorbid depressive and anxiety disorders in 509 individuals with an at-risk mental state: impact on psychopathology and transition to psychosis. Schizophrenia bulletin. 2014;40(1):120–131. doi: 10.1093/schbul/sbs136. [DOI] [PMC free article] [PubMed] [Google Scholar]
- Geng H, Li X, Chen J, Li X, Gu R. Decreased intra- and inter- salience network functional connectivity is related to trait anxiety in adolescents. Frontiers in Behavioral Neuroscience. 2016;9 doi: 10.3389/fnbeh.2015.00350. [DOI] [PMC free article] [PubMed] [Google Scholar]
- Hindriks R, Adhikari MH, Murayama Y, Ganzetti M, Mantini D, Logothetis NK, Deco G. Can sliding-window correlations reveal dynamic functional connectivity in resting-state fMRI? NeuroImage. 2016;127:242–256. doi: 10.1016/j.neuroimage.2015.11.055. [DOI] [PMC free article] [PubMed] [Google Scholar]
- Howes OD, Nour MM. Dopamine and the aberrant salience hypothesis of schizophrenia. World psychiatry : official journal of the World Psychiatric Association. 2016;15(1):3–4. doi: 10.1002/wps.20276. [DOI] [PMC free article] [PubMed] [Google Scholar]
- Hutchison RM, Womelsdorf T, Allen EA, Bandettini PA, Calhoun VD, Corbetta M, Chang C. Dynamic functional connectivity: promise, issues, and interpretations. NeuroImage. 2013;80:360–378. doi: 10.1016/j.neuroimage.2013.05.079. [DOI] [PMC free article] [PubMed] [Google Scholar]
- Kaiser RH, Whitfield-Gabrieli S, Dillon DG, Goer F, Beltzer M, Minkel J, Pizzagalli DA. Dynamic Resting-State Functional Connectivity in Major Depression. Neuropsychopharmacology : official publication of the American College of Neuropsychopharmacology. 2015 doi: 10.1038/npp.2015.352. [DOI] [PMC free article] [PubMed] [Google Scholar]
- Kapur S. Psychosis as a State of Aberrant Salience: A Framework Linking Biology, Phenomenology, and Pharmacology in Schizophrenia. American Journal of Psychiatry. 2003;160:13–23. doi: 10.1176/appi.ajp.160.1.13. [DOI] [PubMed] [Google Scholar]
- Leonardi N, Van De Ville D. On spurious and real fluctuations of dynamic functional connectivity during rest. NeuroImage. 2015;104:430–436. doi: 10.1016/j.neuroimage.2014.09.007. [DOI] [PubMed] [Google Scholar]
- Lindquist MA, Xu Y, Nebel MB, Caffo BS. Evaluating dynamic bivariate correlations in resting-state fMRI: a comparison study and a new approach. NeuroImage. 2014;101:531–546. doi: 10.1016/j.neuroimage.2014.06.052. [DOI] [PMC free article] [PubMed] [Google Scholar]
- Ma S, Calhoun VD, Phlypo R, Adali T. Dynamic changes of spatial functional network connectivity in healthy individuals and schizophrenia patients using independent vector analysis. NeuroImage. 2014;90:196–206. doi: 10.1016/j.neuroimage.2013.12.063. [DOI] [PMC free article] [PubMed] [Google Scholar]
- Mamah D, Barch DM, Repovs G. Resting state functional connectivity of five neural networks in bipolar disorder and schizophrenia. Journal of affective disorders. 2013;150(2):601–609. doi: 10.1016/j.jad.2013.01.051. [DOI] [PMC free article] [PubMed] [Google Scholar]
- Manoliu A, Riedl V, Doll A, Bauml JG, Muhlau M, Schwerthoffer D, Sorg C. Insular Dysfunction Reflects Altered Between-Network Connectivity and Severity of Negative Symptoms in Schizophrenia during Psychotic Remission. Frontiers in human neuroscience. 2013;7:216. doi: 10.3389/fnhum.2013.00216. [DOI] [PMC free article] [PubMed] [Google Scholar]
- Manoliu A, Riedl V, Zherdin A, Muhlau M, Schwerthoffer D, Scherr M, Sorg C. Aberrant dependence of default mode/central executive network interactions on anterior insular salience network activity in schizophrenia. Schizophrenia bulletin. 2014;40(2):428–437. doi: 10.1093/schbul/sbt037. [DOI] [PMC free article] [PubMed] [Google Scholar]
- Mason MF, Norton MI, Van Horn JD, Wegner DM, Grafton ST, Macrae CN. Wandering minds: the default network and stimulus-independent thought. Science. 2007;315(5810):393–395. doi: 10.1126/science.1131295. [DOI] [PMC free article] [PubMed] [Google Scholar]
- McGlashan TH, Miller TJ, Woods SW, Hoffman RE, Davidson L. Instrument for the assessment of prodromal symptoms and states Early intervention in psychotic disorders. Springer; 2001. pp. 135–149. [Google Scholar]
- Millan MJ, Fone K, Steckler T, Horan WP. Negative symptoms of schizophrenia: clinical characteristics, pathophysiological substrates, experimental models and prospects for improved treatment. European neuropsychopharmacology : the journal of the European College of Neuropsychopharmacology. 2014;24(5):645–692. doi: 10.1016/j.euroneuro.2014.03.008. [DOI] [PubMed] [Google Scholar]
- Miller RL, Yaesoubi M, Turner JA, Mathalon D, Preda A, Pearlson G, Calhoun VD. Higher Dimensional Meta-State Analysis Reveals Reduced Resting fMRI Connectivity Dynamism in Schizophrenia Patients. PloS one. 2016;11(3):e0149849. doi: 10.1371/journal.pone.0149849. [DOI] [PMC free article] [PubMed] [Google Scholar]
- Modinos G, Allen P, Grace AA, McGuire P. Translating the MAM model of psychosis to humans. Trends in neurosciences. 2015;38(3):129–138. doi: 10.1016/j.tins.2014.12.005. [DOI] [PMC free article] [PubMed] [Google Scholar]
- Modinos G, Tseng HH, Falkenberg I, Samson C, McGuire P, Allen P. Neural correlates of aberrant emotional salience predict psychotic symptoms and global functioning in high-risk and first-episode psychosis. Social cognitive and affective neuroscience. 2015;10(10):1429–1436. doi: 10.1093/scan/nsv035. [DOI] [PMC free article] [PubMed] [Google Scholar]
- Orliac F, Naveau M, Joliot M, Delcroix N, Razafimandimby A, Brazo P, Delamillieure P. Links among resting-state default-mode network, salience network, and symptomatology in schizophrenia. Schizophrenia research. 2013;148(1–3):74–80. doi: 10.1016/j.schres.2013.05.007. [DOI] [PubMed] [Google Scholar]
- Palaniyappan L, Liddle PF. Does the salience network play a cardinal role in psychosis? An emerging hypothesis of insular dysfunction. Journal of psychiatry & neuroscience : JPN. 2012;37(1):17–27. doi: 10.1503/jpn.100176. [DOI] [PMC free article] [PubMed] [Google Scholar]
- Palaniyappan L, Simmonite M, White TP, Liddle EB, Liddle PF. Neural primacy of the salience processing system in schizophrenia. Neuron. 2013;79(4):814–828. doi: 10.1016/j.neuron.2013.06.027. [DOI] [PMC free article] [PubMed] [Google Scholar]
- Pankow A, Katthagen T, Diner S, Deserno L, Boehme R, Kathmann N, Schlagenhauf F. Aberrant Salience Is Related to Dysfunctional Self-Referential Processing in Psychosis. Schizophrenia bulletin. 2016;42(1):67–76. doi: 10.1093/schbul/sbv098. [DOI] [PMC free article] [PubMed] [Google Scholar]
- Pelletier-Baldelli A, Bernard JA, Mittal VA. Intrinsic Functional Connectivity in Salience and Default Mode Networks and Aberrant Social Processes in Youth at Ultra-High Risk for Psychosis. PloS one. 2015;10(8):e0134936. doi: 10.1371/journal.pone.0134936. [DOI] [PMC free article] [PubMed] [Google Scholar]
- Pettersson-Yeo W, Allen P, Benetti S, McGuire P, Mechelli A. Dysconnectivity in schizophrenia: where are we now? Neuroscience and biobehavioral reviews. 2011;35(5):1110–1124. doi: 10.1016/j.neubiorev.2010.11.004. [DOI] [PubMed] [Google Scholar]
- Power JD, Barnes KA, Snyder AZ, Schlaggar BL, Petersen SE. Spurious but systematic correlations in functional connectivity MRI networks arise from subject motion. NeuroImage. 2012;59(3):2142–2154. doi: 10.1016/j.neuroimage.2011.10.018. [DOI] [PMC free article] [PubMed] [Google Scholar]
- Power Jonathan D, Schlaggar Bradley L, Lessov-Schlaggar Christina N, Petersen Steven E. Evidence for Hubs in Human Functional Brain Networks. Neuron. 2013;79(4):798–813. doi: 10.1016/j.neuron.2013.07.035. http://dx.doi.org/10.1016/j.neuron.2013.07.035. [DOI] [PMC free article] [PubMed] [Google Scholar]
- Repovs G, Csernansky JG, Barch DM. Brain network connectivity in individuals with schizophrenia and their siblings. Biological psychiatry. 2011;69(10):967–973. doi: 10.1016/j.biopsych.2010.11.009. [DOI] [PMC free article] [PubMed] [Google Scholar]
- Roiser JP, Howes OD, Chaddock CA, Joyce EM, McGuire P. Neural and behavioral correlates of aberrant salience in individuals at risk for psychosis. Schizophrenia bulletin. 2013;39(6):1328–1336. doi: 10.1093/schbul/sbs147. [DOI] [PMC free article] [PubMed] [Google Scholar]
- Sass LA. Self-disturbance and schizophrenia: structure, specificity, pathogenesis (Current issues, New directions) Schizophrenia research. 2014;152(1):5–11. doi: 10.1016/j.schres.2013.05.017. [DOI] [PubMed] [Google Scholar]
- Seeley WW, Menon V, Schatzberg AF, Keller J, Glover GH, Kenna H, Greicius MD. Dissociable intrinsic connectivity networks for salience processing and executive control. The Journal of neuroscience : the official journal of the Society for Neuroscience. 2007;27(9):2349–2356. doi: 10.1523/JNEUROSCI.5587-06.2007. [DOI] [PMC free article] [PubMed] [Google Scholar]
- Sridharan D, Levitin DJ, Menon V. A critical role for the right fronto-insular cortex in switching between central-executive and default-mode networks. Proceedings of the National Academy of Sciences of the United States of America. 2008;105(34):12569–12574. doi: 10.1073/pnas.0800005105. [DOI] [PMC free article] [PubMed] [Google Scholar]
- Stephan KE, Friston KJ, Frith CD. Dysconnection in schizophrenia: from abnormal synaptic plasticity to failures of self-monitoring. Schizophrenia bulletin. 2009;35(3):509–527. doi: 10.1093/schbul/sbn176. [DOI] [PMC free article] [PubMed] [Google Scholar]
- Uddin LQ. Salience processing and insular cortical function and dysfunction. Nature reviews Neuroscience. 2015;16(1):55–61. doi: 10.1038/nrn3857. [DOI] [PubMed] [Google Scholar]
- van den Heuvel MP, Fornito A. Brain networks in schizophrenia. Neuropsychology review. 2014;24(1):32–48. doi: 10.1007/s11065-014-9248-7. [DOI] [PubMed] [Google Scholar]
- van den Heuvel MP, Sporns O. Network hubs in the human brain. Trends in cognitive sciences. 2013;17(12):683–696. doi: 10.1016/j.tics.2013.09.012. http://dx.doi.org/10.1016/j.tics.2013.09.012. [DOI] [PubMed] [Google Scholar]
- Van Dijk KR, Hedden T, Venkataraman A, Evans KC, Lazar SW, Buckner RL. Intrinsic functional connectivity as a tool for human connectomics: theory, properties, and optimization. Journal of neurophysiology. 2010;103(1):297–321. doi: 10.1152/jn.00783.2009. [DOI] [PMC free article] [PubMed] [Google Scholar]
- Weissman DH, Roberts KC, Visscher KM, Woldorff MG. The neural bases of momentary lapses in attention. Nature neuroscience. 2006;9(7):971–978. doi: 10.1038/nn1727. [DOI] [PubMed] [Google Scholar]
- Whitfield-Gabrieli S, Ford JM. Default mode network activity and connectivity in psychopathology. Annual review of clinical psychology. 2012;8:49–76. doi: 10.1146/annurev-clinpsy-032511-143049. [DOI] [PubMed] [Google Scholar]
- Whitfield-Gabrieli S, Nieto-Castanon A. Conn: a functional connectivity toolbox for correlated and anticorrelated brain networks. Brain Connect. 2012;2(3):125–141. doi: 10.1089/brain.2012.0073. [DOI] [PubMed] [Google Scholar]
- Whitfield-Gabrieli S, Thermenos HW, Milanovic S, Tsuang MT, Faraone SV, McCarley RW, LaViolette P. Hyperactivity and hyperconnectivity of the default network in schizophrenia and in first-degree relatives of persons with schizophrenia. Proceedings of the National Academy of Sciences. 2009;106(4):1279–1284. doi: 10.1073/pnas.0809141106. [DOI] [PMC free article] [PubMed] [Google Scholar]
- Woods SW, Addington J, Cadenhead KS, Cannon TD, Cornblatt BA, Heinssen R, McGlashan TH. Validity of the prodromal risk syndrome for first psychosis: findings from the North American Prodrome Longitudinal Study. Schizophrenia bulletin. 2009;35(5):894–908. doi: 10.1093/schbul/sbp027. [DOI] [PMC free article] [PubMed] [Google Scholar]
- Wotruba D, Michels L, Buechler R, Metzler S, Theodoridou A, Gerstenberg M, Heekeren K. Aberrant coupling within and across the default mode, task-positive, and salience network in subjects at risk for psychosis. Schizophrenia bulletin. 2014;40(5):1095–1104. doi: 10.1093/schbul/sbt161. [DOI] [PMC free article] [PubMed] [Google Scholar]
- Yeo BT, Krienen FM, Sepulcre J, Sabuncu MR, Lashkari D, Hollinshead M, Buckner RL. The organization of the human cerebral cortex estimated by intrinsic functional connectivity. Journal of neurophysiology. 2011;106(3):1125–1165. doi: 10.1152/jn.00338.2011. [DOI] [PMC free article] [PubMed] [Google Scholar]
Associated Data
This section collects any data citations, data availability statements, or supplementary materials included in this article.