Abstract
Purpose
This study aims to develop a fully automated algorithm for artery–vein (A-V) and arteriole-venule classification and to quantify the effect of hypertension on A-V caliber and tortuosity ratios of nonproliferative diabetic retinopathy (NPDR) patients.
Methods
We combine an optical density ratio (ODR) analysis and blood vessel tracking (BVT) algorithm to classify arteries and veins and arterioles and venules. An enhanced blood vessel map and ODR analysis are used to determine the blood vessel source nodes. The whole vessel map is then tracked beginning from the source nodes and classified as vein (venule) or artery (arteriole) using vessel curvature and angle information. Fifty color fundus images from NPDR patients are used to test the algorithm. Sensitivity, specificity, and accuracy metrics are measured to validate the classification method compared to ground truths.
Results
The combined ODR-BVT method demonstrates 97.06% accuracy in identifying blood vessels as vein or artery. Sensitivity and specificity of A-V identification are 97.58%, 97.81%, and 95.89%, 96.68%, respectively. Comparative analysis revealed that the average A-V caliber and tortuosity ratios of NPDR patients with hypertension have 48% and 15.5% decreases, respectively, compared to that of NPDR patients without hypertension.
Conclusions
Automated A-V classification has been achieved by combined ODR-BVT analysis. Quantitative analysis of color fundus images verified robust performance of the A-V classification. Comparative quantification of A-V caliber and tortuosity ratios provided objective biomarkers to differentiate NPDR groups with and without hypertension.
Translational Relevance
Automated A-V classification can facilitate quantitative analysis of retinal vascular distortions due to diabetic retinopathy and other eye conditions and provide increased sensitivity for early detection of eye diseases.
Keywords: vein–artery classification, optical density ratio, blood vessel tracking, diabetic retinopathy
Introduction
Retinal microvasculature is known to be affected by systemic and cardiovascular diseases along with common eye diseases.1–3 Quantitative fundus photography is essential for screening, diagnosis, and treatment assessment of eye diseases. Objective and automated classification of vasculature distortions in fundus images holds great potential to help physician decision making, foster telemedicine, and explore early screening of eye diseases in primary care environments.4
Different diseases and progressing stages may affect arteries and veins differently. For example, arterial narrowing is a well-established phenomenon associated with hypertension, whereas venous widening is associated with stroke and cardiovascular diseases.5–8 Artery–vein (A-V) caliber ratio has been used as a predictor of these diseases.3,5,6,9,10 However, manual differentiation of arteries or veins is time consuming. Therefore, a number of algorithms have been proposed to explore computer-aided classification of A-V vessels.11–20 Computer-aided classification typically requires multiple steps: extracting the blood vessel map, differentiating the artery and vein, quantifying any changes, and assessing the condition of the patient. Most of the vessel classification algorithms are based on the color and intensity information of arteries and veins.13–16,18–20 Because of the presence of oxygenated blood, the arteries have lighter color intensity. However, this difference becomes less significant as the blood vessels propagate toward the fovea due to intensity and contrast variability. Therefore, the small vessels have to be tracked to their origin near the optic disk to be classified reliably.21 Semiautomatic algorithms11,12,17 for supervised classification have also been proposed based on vessel-tracking techniques. In supervised classification,16,22,23 the intra- and interimage light variation make it quite challenging to get high accuracy in A-V classification. Furthermore, these algorithms require a large number of training sets with manual annotations from clinicians. Some researchers have tried incorporating functional features such as optical density ratio (ODR) to identify arteries and veins in dual-wavelength images obtained in red and green channels.23–25 However, high sensitivity was achieved only for large vessels, leaving reliable A-V classification difficult for small vessels at the macular area that are vulnerable to many eye diseases.
In this work, we introduce an automated method that combines ODR analysis and a blood vessel tracking (BVT) algorithm to enable A-V classification at arteriole and venule level. As a functional feature, ODR is used to identify arteries and veins near the optic disk, while a BVT algorithm maps veins or arteries from source to endpoint using vessel curvature and angle information. Incorporating a vessel-enhancement algorithm with the tracking algorithm allows reliable A-V classification. We implemented the method on 50 color fundus images from 35 nonproliferative diabetic retinopathy (NPDR) patients and validated the results by comparing them to manual annotation from two independent observers. The classification performance is validated using sensitivity, specificity, and accuracy metrics along with graphical metrics, that is, a receiver operation characteristics (ROC) curve. We also measured two quantitative features, A-V caliber and tortuosity, to evaluate the effect of hypertension on the retinal vessels of NPDR patients.
Materials and Methods
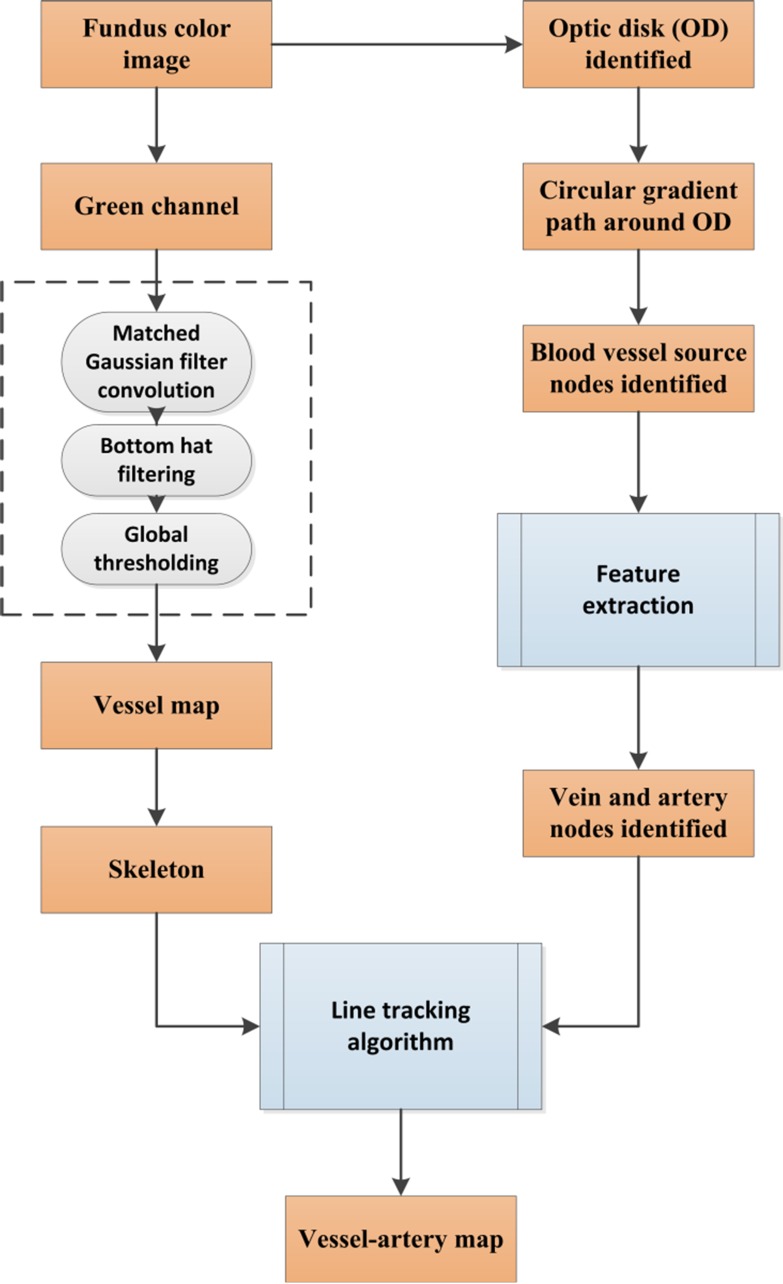
This section describes the algorithms for the fully automated classification of veins and arteries in color fundus images. Figure 1 briefly illustrates the core steps of the algorithm. The technical details of each step are described in the following sections.
Figure 1.
Core steps of A-V identification.
Data Acquisition
Fifty color fundus images (from 35 patients) with resolution of 2392 × 2048 pixels were used for this study. These images were captured with a Cirrus 800 nonmydriatic retinal camera with a 30° to 45° field of view. The database contains color fundus images from subjects with NPDR. All the patients were recruited from University of Illinois at Chicago (UIC) Retinal Clinic. The study was approved by the Institutional Review Board of the University of Illinois at Chicago and was in compliance with the ethical standards as stated in the Declaration of Helsinki. All images were labeled by two experienced ophthalmologists (authors DT and JIL) to generate a ground truth to compare the classification results.
Extraction of the Vessel Map
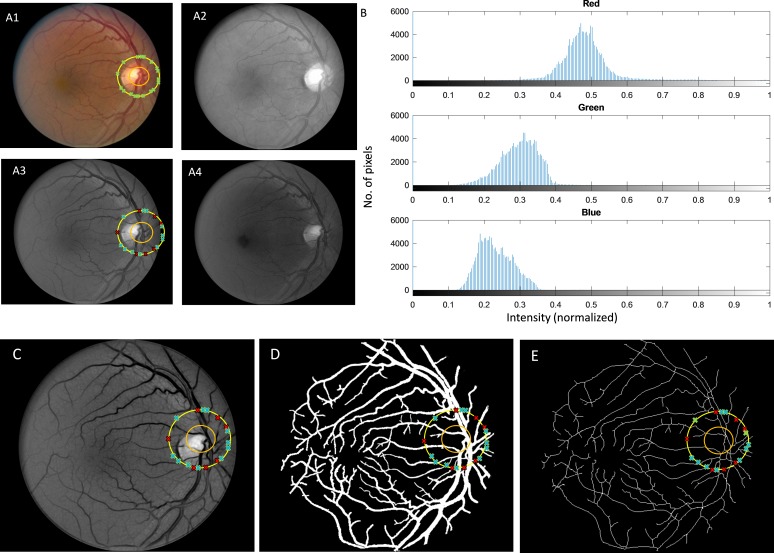
Figure 2 shows the original fundus image, separated red, green, and blue channels (Fig. 2A1–A4), and corresponding intensity histograms of segmented blood vessels (Fig. 2B) in the three channels. The green channel is used for the segmentation as it provides best contrast of the blood vessels.26–29 Various studies, especially those focused on fundus image analysis, have established that the green channel provides greater contrast, whereas the red channel is saturated and blue channel is too noisy.27,30 In green light, both oxygenated and deoxygenated hemoglobin (A-V) have peaks in their absorption coefficient spectrum around 500 nm,31 which falls in the range of green light wavelength (495–570 nm).32 As a consequence, the features that contain hemoglobin (i.e., blood vessels) absorb more green light compared to the surrounding tissues. Thus, they appear darker in contrast to the background in green channel images. On the other hand, the red light (which is mostly reflected from choroid) is not extensively absorbed by the pigments of the inner eye, which is why red light dominates the reflected light spectrum and the fundus image appears to have a reddish glare. Due to the lower absorption coefficient of red light, structures containing pigments have lower contrast compared to that of green light. And as for blue light, the blood vessels have darker intensity, but the contrast and signal-to-noise ratio is too low relative to the background. Thus, considering all these issues, we used green channel images for extracting the blood vessel map.
Figure 2.
(A1) Original fundus image. (A2) Red channel. (A3) Green channel. (A4) Blue channel. (B) Intensity histogram of three channels. (C) Enhanced green channel. (D) Vessel map. (E) Skeleton.
Upon extracting the green channel image, we used a matched filtering method33 to enhance the blood vessels from the background. Two-dimensional Gaussian kernels of 12 different orientations and 10 different sizes were used that matched blood vessels. The kernels cover all blood vessel directions and diameters and can be defined by the following equation34–36:
 |
where x and y are pixel coordinates, θ is the rotation angle of the kernel, θ ∼ [0, π], and σ defines the width of the kernel. A total of 120 kernels are convolved with the green channel image after subtracting their means. When the cross-correlation is performed between the image and the enhancement kernels, the features in the image that match the enhancement kernels (which represent blood vessels of different diameters) produce the largest values. Thus, maximum values in the results represent blood vessel structures, and they are selected to produce the final map of blood vessels. The final blood vessel enhanced image obtained from the maximum intensity projection of 120 convolved images is shown in Fig. 2C. A 20 × 20 bottom hat filter is used to reduce the background variance and correct uneven illumination. Then, global thresholding was used to generate the extracted blood vessel map (Fig. 2D). This binary vessel map was then skeletonized. The skeletonization process removes pixels on the boundaries of vessels but does not allow objects to break apart.37,38 The remaining pixels make up the image skeleton (Fig. 2E). All the endpoints of the skeleton are identified. The skeleton and the endpoints serve as inputs to the BVT algorithm.
Identifying Vessel Source Nodes
The vessel-tracking algorithm starts from the source of veins or arteries. To identify these source nodes, it is important to identify the optic disk or at least the area in the fundus image where the optic disk is located. The optic disk has comparatively lower pigmentation and hence reflects more light compared to other retinal areas.39 Therefore, the optic disk area is always the brightest location in a fundus image. A 30 × 30 shifting window is moved through the enhanced green channel image (Fig. 3C), and the mean intensity is calculated for the whole window. The algorithm then looks for a cluster of neighboring windows with high intensity values. A customized MATLAB function is implemented that looks for a cluster of neighboring windows with high intensity values. It is a simple decision-making algorithm that looks at the histogram of the intensity values of each 30 × 30 window and automatically detects the windows that have intensity values in upper 95% spectrum. The algorithm then checks the distance among the centroid of selected windows and identifies the connected region from clustered centroids. The selected region is identified as optics disk tissue (illustrated with orange circle in Fig. 2A1), and the center of the area is marked. From the center, a circular path is drawn that has double the diameter of the approximate optic disk diameter. This path acts like a gradient line. Whenever there is a blood vessel, the intensity of those pixels is different from the background. Using this gradient intensity information, the blood vessel spots are identified (illustrated with green crosses in Fig. 2A1).
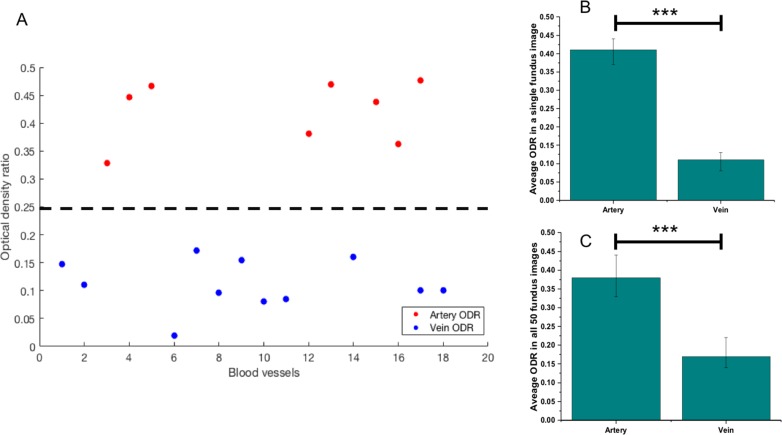
Figure 3.
Comparing ODR in arteries and veins. (A) Scatter plot illustrates ODR values of identified blood vessels in perifoveal retina of a single fundus image. A threshold can be added easily to clearly distinguish arterial and venous ODRs. (B) Average arterial and venous ODR values in a single fundus image. (C) Average arterial and venous ODR values for 50 fundus images used in this study. The average values are presented with corresponding standard deviations. ***P < 0.001 from Student's t-test.
Classifying Vein and Artery Source Nodes
The blood vessel source nodes are classified into vein and artery using a functional feature: ODR.21 Optical density (OD) and ODR were calculated for each source node. OD is an indicator of light absorbance of vessel tissues relative to its surrounding background and is calculated as21
 |
where IVessel is pixel value inside the vessel source node and IBackground is the pixel value of the background. ODR is calculated as21
 |
ODred and ODgreen are ODs at red (oxygen-sensitive wavelength) and green channels (oxygen-insensitive wavelength).40 Light at smaller wavelengths (green channel) are equally scattered by oxyhemoglobin (artery) and deoxyhemoglobin (vein) and thus is insensitive to oxygen difference.21,41 The red channel is oppositely sensitive to oxygen. Because of this phenomenon, ODR in veins is lower than in arteries. The algorithm identifies source nodes with high ODR as arteries and low ODR as veins (identified in Fig. 3B with veins as blue crosses and arteries as red crosses). Figure 3A illustrates ODR of identified blood vessels (segmented from background) in a single fundus image. A threshold can clearly distinguish arterial and venous ODRs from the scatter plot. From Figures 3B and 3C, we can observe significantly larger ODR in arteries compared to veins in single and multiple (n = 50) fundus images, respectively (P < 0.001), representing higher oxygen saturation in arteries.
BVT Algorithm
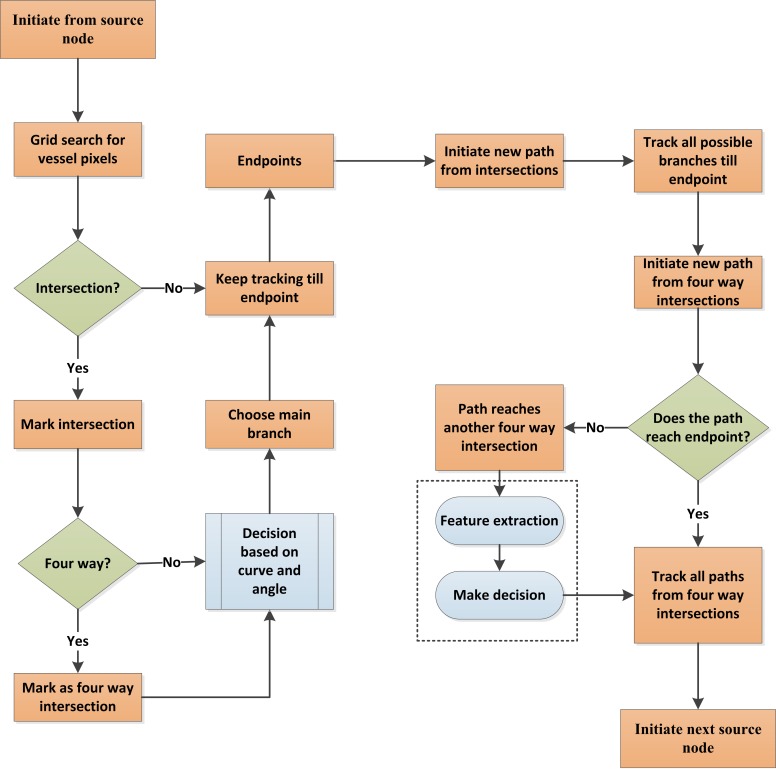
The skeleton map of the blood vessel and identified A-V source nodes were incorporated into a BVT algorithm to obtain the final vein and artery map of the retinal vasculature. Figure 4 illustrates the procedures of the BVT algorithm, and Figure 5 illustrates the corresponding images.
Figure 4.
Core steps of BVT algorithm.
Figure 5.
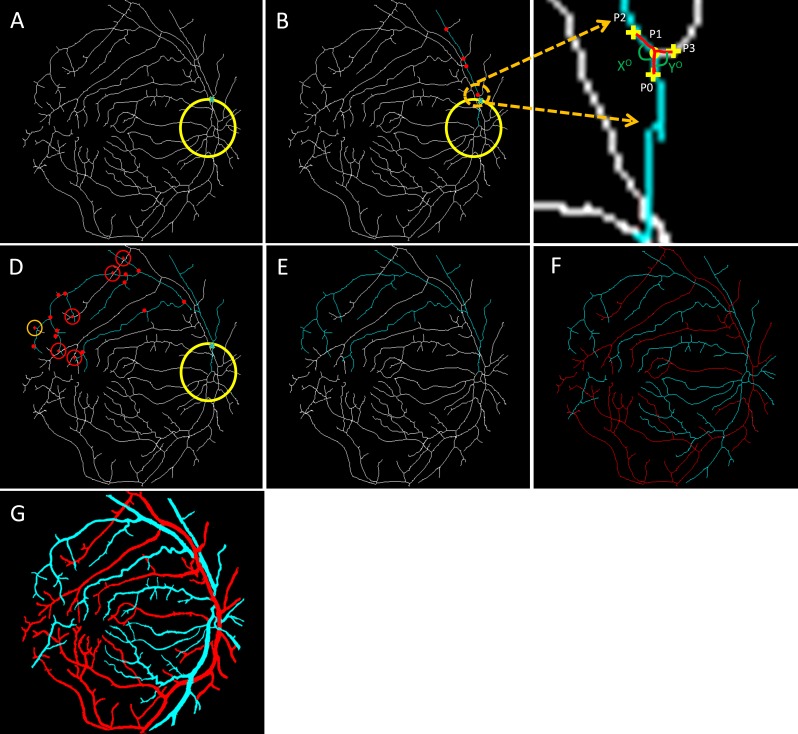
Steps of vessel tracking. (A) A source node is identified with the cross. (B) The main branch of the vessel is tracked; the red dots represent all the possible branch nodes. (C) The process of choosing the forward path in the vessel map is shown in this enlarged window. (D) All the possible branches are identified; only four-way cross sections are marked with red crosses. (E) The decision taken on the four-way cross sections and whole vessel is identified. (F) Vein (blue) and artery (red) identified in the skeleton. (G) Classified vein and artery map.
The tracking starts from a specific source node (Fig. 5A). It uses a 3 × 3 grid to find vessel pixels in its way. If it cannot find any vessel pixels, it increases the size of the grid. The algorithm tracks the main branch of the blood vessel first. Every time there is an intersection, it uses curve and angle information to choose the forward-going main branch. Figure 5B illustrates a normal intersection scenario in the associated enlarged window in Figure 5C. P1 is the current point, and P2 and P3 are the candidate points for the forward path. A past-visited point P0 is chosen, and two separate curves are considered to compare. The first curve is P0-P1-P2, and second is P0-P1-P3. The curvature can be quantified using the distance metric42–44 between P0 (x1,y1) and P2 or P3 (x2,y2) which can be calculated as
 |
If we define each of the separated curves (i.e., P0-P1-P2 and P0-P1-P3) with [x(t), y(t)] on the interval [t0, t1], the geodesic distance between the endpoints, that is, P0 and P2, P3, can be calculated with the following equation44:
 |
For two endpoints (i.e., P0 [x1, y1] and P2 or P3 [x2, y2]), the Euclidian distance is calculated with following equation44:
 |
Whichever path has smaller curvature value (curve P0-P1-P2 in Fig. 5C), the algorithm identifies it as the main branch of the vessel to go forward. The algorithm also takes into account the angle information of the two curvatures. We can observe that the angle X (corresponding to curve P0-P1-P2) is larger than Y (corresponding to curve P0-P1-P3), so the algorithm uses this angle information along with the curvature feature to make a decision to go forward.
The intersection and all the others along the way are marked (shown in red dots in Fig. 5B) so that tracking can be resumed from the intersection nodes once the main branch is identified until the endpoint. After the main branch reaches the endpoint, the algorithm comes back to each intersection and follows the same procedure to track all vessel branches associated with the main branch. The four-way intersections are specially marked as they might be crossovers from other vessels (red crosses in Fig. 5D). The algorithm first checks if the branches from a four-way intersection lead to any other vessel intersection. If not (as shown with orange circles in Fig. 5D), the branches are identified with the original main branch. But if they are (as shown with red circles in Fig. 5D), then algorithm has to decide if it will assign it to the original vessel or the new vessel. In this case, several textural parameters (ODR, contrast, entropy, and edge of the branches) are compared to the two vessels by the algorithm to decide to which vessel these branches belong. In a few cases, the textural parameters of a branch may not be enough to correctly assign it to a specific vessel. The algorithm marks that branch as unclassified for the moment and proceeds to the next branch. After tracking all the branches (Fig. 5E), the same process starts for the next source node until all the vessels are tracked (Fig. 5F). All the branches belonging to a tracked vessel are classified as vein or artery based on the identity of the respective source node. The only remaining branches are the unclassified ones and those that are broken from the vessel skeleton due to various pathologic reasons. The algorithm measures the textural parameters of the A-V map and compares them to all the unclassified branches. The unclassified branches are identified as artery or vein based on their similarity to either artery or vein map features. Once the whole skeleton map is classified into veins and arteries, it is used to generate a vessel map with veins and arteries fully identified (Fig. 5G).
Quantitative Features
For the quantitative analysis of classified veins and arteries, two features are measured: A-V caliber and tortuosity ratio. It is known that hypertension causes arterial narrowing and in some cases causes the veins to be more tortuous.5,45 With the separation of artery and vein, A-V ratios are used to identify patients with hypertension.
For measuring the blood vessel caliber (artery or vein), both the vessel map and skeleton are used. The average caliber of the blood vessels is defined as the ratio of the vascular area (calculated from the vessel map) and vascular length (calculated from the skeleton).44,46
 |
where B(i,j) represents vessel pixels and S(i,j) represents skeleton pixels.
For measuring the blood vessel tortuosity, Equations 4, 5, and 6 are used on the skeleton map with identified endpoints. A-V caliber and tortuosity ratios are calculated as the final parameters.
Results
Performance Metrics
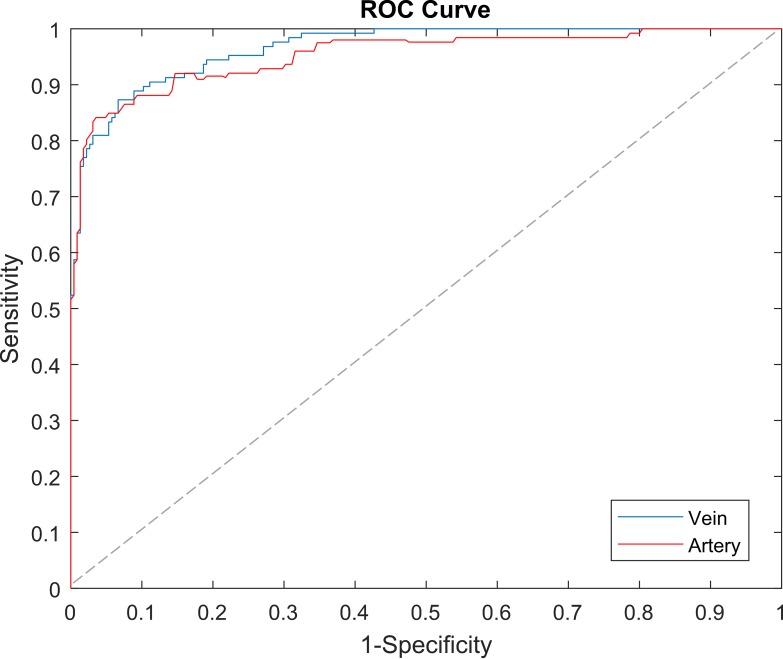
A dataset of 50 color fundus images was used to test and validate the proposed classification method. The results of the vein and artery classification are compared to the ground truth vessel map manually labeled by the two experienced observers. These two observers had a 94.27% agreement on the identified vein and artery map. To evaluate the performance of the proposed method, sensitivity, specificity, and accuracy metrics are measured. We also incorporated a graphic method using a ROC curve to assess the classification performance. In a ROC curve, true-positive rate (sensitivity) is plotted as a function of false-positive rate (1-specificity) at different cutoff points. Thus, the closer the curve is to the upper left corner, the more accurate is the prediction. The area under the ROC curve (AUC) is measured to quantify how well the classifier is able to identify the different classes. AUC = 1, or 100%, represents a perfect prediction, and 0.5, or 50%, represents a bad prediction. These evaluation metrics are measured separately for arteries and veins with respect to the labeled ground truths.
A-V Classification
A detailed performance analysis is shown in the Table. The A-V classification algorithm works well to differentiate venules and arterioles, which are small vessels located near fovea. With the incorporation of the blood vessel-enhancement technique, we observed an average of 23% increase in the vessel map compared to the original map. The algorithm demonstrates 97.06% accuracy in identifying blood vessels as vein or artery. Sensitivity and specificity of artery identification are 97.58% and 95.89%, respectively. Sensitivity and specificity of vein identification are 97.81% and 96.68%, respectively. The algorithm misclassified only 2.94% vessels compared to 8%, 9.92%, and 11.72% observed in literature.47–49 We can also observe the ROC curves in Figure 6 for veins and arteries with AUC of 97.14% and 95.62%, respectively.
Table.
Performance of A-V Classification
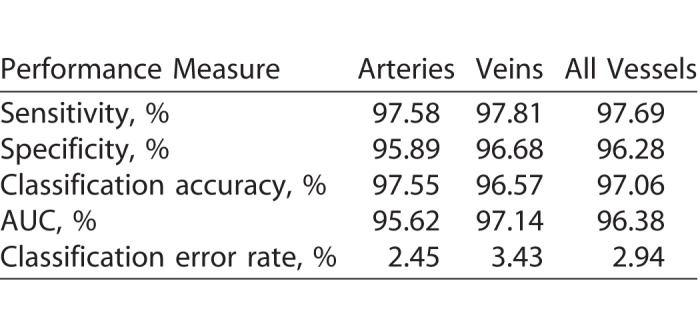
Figure 6.
The comparison of mean ROC curves for A-V classification. The dashed line represents the trade-off resulting from random chance.
Comparative A-V Analysis of NPDR Patients
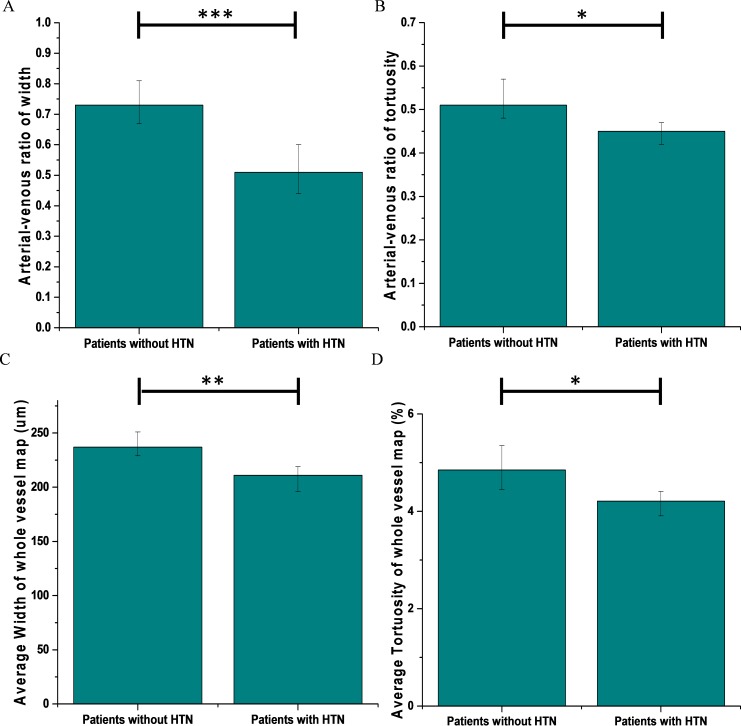
As a direct application of A-V classifications, two quantitative features, A-V caliber and tortuosity ratios, were measured and analyzed. Out of 35 NPDR patients, 24 had hypertension. Figure 7A and 7B illustrates the mean A-V caliber and tortuosity ratios respectively. It was observed that the averaged A-V caliber ratio for subjects without hypertension was 0.74 compared to 0.5 for subjects with hypertension. Thus, there was a significant 48% decrease in patients with hypertension (P < 0.001 and Cohen's d = 4.35). In case of A-V tortuosity ratio, the average for patients without hypertension is 0.52 compared to 0.45 for patients with hypertension. There was a moderately significant decrease of 15.5% (P < 0.05, Cohen's d = 2.33). The average caliber and tortuosity of the whole blood vessel map (Figs. 7C, 7D) were also measured without separating vein and artery. It was observed that the sensitivity of these parameters were quite low compared to the result obtained with the vein and artery separated. For patients with hypertension, the average caliber and tortuosity decreased by only 12% and 0.64%, respectively, compared to 48% and 15.5% decrease in A-V caliber and tortuosity ratios.
Figure 7.
Quantitative comparison between patients without hypertension and with hypertension. (A) A-V caliber ratio. (B) A-V tortuosity ratio. (C) Average caliber of the whole vessel map. (D) Average tortuosity of the whole vessel map. Error bars are standard deviations; the significance of Student's t-test is marked as *P < 0.05; **P < 0.01; ***P < 0.001.
Discussion
This study proposes a fully automated technique to classify retinal blood vessels into A-V categories using a combination ODR-BVT algorithm. We implemented the algorithm on 50 color fundus images from 35 NPDR patients and compared the results with ground truths created by two independent observers. Sensitivity, specificity, and accuracy metrics were used to validate the classification results. The algorithm identified artery and veins with 97.02% accuracy. Upon classification of arteries and veins, two quantitative features were measured to analyze the effect of hypertension in NPDR patients. About 68% of the population was diagnosed with hypertension. We observed that patients with hypertension had 48% arterial narrowing and about 15.5% increase in venous tortuosity. These microvascular changes were significant and validated with Student's t-test and calculation of Cohen's d.
The proposed technique for A-V classification has two major steps. In the first step, the algorithm deals with finding source nodes of blood vessels coming out of the optic disk and classifying them into A-V categories. The algorithm takes advantage of the significant morphologic contrast observed in the optic disk area, so we can avoid the challenge of illumination change across the retinal fundus images, especially near the foveal area.
The algorithm automatically locates the optic disc using intensity-based information and finds the blood vessels in its outer periphery using a gradient-based measurement. As mentioned in Narasimha-Iyer et al.,23 the ODRs in dual-wavelength red and green channels are significantly different because arteries contain oxygenated blood and thus are lighter in intensity. But this feature is less effective near the foveal area where the blood vessels become narrower and their center reflex becomes negligible. However, the ODR is quite useful near the optic disk as the vessels are wider and have distinguishable center reflexes. The algorithm uses ODR as a functional feature to classify the source nodes of blood vessels as arteries and veins. In the first phase, parallel to the classification of source nodes, the algorithm also employs a matched filtering based an edge-enhancing technique that extracts and segments the blood vessel map with intricate details. We observed an average of 23% increase in the vasculature map in fundus images compared to the original one. This ensures the classification of thinner arterioles and venules along with the regular veins and arteries. With the comprehensive blood vessel map and classified source nodes, the algorithm moves on to its second phase. This phase involves the BVT algorithm that maps the artery or vein from the identified source nodes to the endpoints. The algorithm involves vessel curvature and angle information to track the whole vessel in a systematic manner. First, it tracks the main branch while locating the intersections. Then it repeats the tracking for all the branches coming out of the vessels except for those with four-way intersections. The four-way intersections are challenging as they could be crossovers from other blood vessels (arteries or veins). The algorithm makes a decision based on morphologic feature extraction and by comparing the features of the candidate branches. The details of the BVT algorithm are discussed in earlier sections and illustrated in Figure 4 and Figure 5. The classification algorithm shows reasonable AUC for veins and arteries (96.38% in average for veins and arteries). The accuracy was an improved 97.06% in average compared to recent A-V classification algorithms47–49 (92%, 90.08%, and 88.28%, respectively). It also showed improved performance over a recent study that employed a similar approach50 to our algorithm using a minimal path approach and vessel tracing and had about 88% accuracy. Employing a vessel-enhancing technique improved the overall blood vessel map and enabled classification of smaller vascular structure near the fovea compared to the most commonly classified larger veins and arteries in literature.
The widespread interest in A-V classification is linked directly to its potential application in clinical assessments. With accurate and robust identification of arteries and veins, subtle microvascular changes in retina could be analyzed for different systemic and retinal diseases. To show such an application, we considered two quantitative features, A-V caliber and tortuosity ratios, in order to observe microvascular changes in patient retinas. Our database consists of 35 NPDR patients, among whom 24 have prediagnosed hypertension. As we know, arterial narrowing and increased vein tortuosity have been correlated with hypertension by many studies. This is the reason we chose these two quantitative features. We observed significant decrease in A-V caliber ratio and moderately significant decrease in A-V tortuosity ratio in hypertension patients. To compare the sensitivity of A-V ratios of caliber and tortuosity we also measured average caliber and tortuosity of whole blood vessel map. We observed only 12% and 0.64% decrease in caliber and tortuosity in patients with hypertension compared to 48% and 15.5% decrease in A-V ratios. This further confirms that A-V classification provides improved sensitivity for quantitative analysis of fundus images. We anticipate that the A-V classification can benefit improved sensitivity of quantitative image analysis of other eye diseases.
Conclusion
A fully automated A-V classification method has been demonstrated based on a combined ODR-BVT algorithm. Fifty density-ratio fundus images were used to verify the performance of the ODR-BVT algorithm. Two quantitative features, A-V blood vessel caliber and tortuosity ratios, were measured to differentiate fundus images from NPDR patients with or without hypertension. NPDR patients with hypertension show significant decreases in A-V caliber and tortuosity ratios.
Acknowledgments
Supported in part by NIH Grants R01 EY023522, R01 EY024628, P30 EY001792; an unrestricted grant from Research to Prevent Blindness; the Richard and Loan Hill endowment; the Marion H. Schenk Chair Endowment; and an ICTD Fellowship from Government of Bangladesh.
Disclosure: M. Alam, (P); T. Son, None; D. Toslak, None; J.I. Lim, None; X. Yao, (P)
References
- 1. Abràmoff MD, Garvin MK, Sonka M. . Retinal imaging and image analysis. IEEE Rev Biomed Eng. 2010; 3: 169– 208. [DOI] [PMC free article] [PubMed] [Google Scholar]
- 2. Wong TY, Klein R, Klein BE, Tielsch JM, Hubbard L, Nieto FJ. . Retinal microvascular abnormalities and their relationship with hypertension, cardiovascular disease, and mortality. Surv Ophthalmol. 2001; 46: 59– 80. [DOI] [PubMed] [Google Scholar]
- 3. Wong TY, Knudtson MD, Klein R, Klein BE, Meuer SM, Hubbard LD. . Computer-assisted measurement of retinal vessel diameters in the Beaver Dam Eye Study: methodology, correlation between eyes, and effect of refractive errors. Ophthalmology. 2004; 111: 1183– 1190. [DOI] [PubMed] [Google Scholar]
- 4. Patton N, Aslam TM, MacGillivray T,et al. Retinal image analysis: concepts, applications and potential. Prog Retin Eye Res. 2006; 25: 99– 127. [DOI] [PubMed] [Google Scholar]
- 5. Ikram MK, Witteman JC, Vingerling JR, Breteler MM, Hofman A, de Jong PT. . Retinal vessel diameters and risk of hypertension. Hypertension. 2006; 47: 189– 194. [DOI] [PubMed] [Google Scholar]
- 6. Liew G, Wong TY, Mitchell P, Cheung N, Wang JJ. . Retinopathy predicts coronary heart disease mortality. Heart. 2009; 95: 391– 394. [DOI] [PubMed] [Google Scholar]
- 7. Wang JJ, Liew G, Wong TY,et al. Retinal vascular calibre and the risk of coronary heart disease-related death. Heart. 2006; 92: 1583– 1587. [DOI] [PMC free article] [PubMed] [Google Scholar]
- 8. Wong TY, Kamineni A, Klein R,et al. Quantitative retinal venular caliber and risk of cardiovascular disease in older persons: the cardiovascular health study. Arch Intern Med. 2006; 166: 2388– 2394. [DOI] [PubMed] [Google Scholar]
- 9. Niemeijer M, Xu X, Dumitrescu AV,et al. Automated measurement of the arteriolar-to-venular width ratio in digital color fundus photographs. IEEE Trans Med Imaging. 2011; 30: 1941– 1950. [DOI] [PubMed] [Google Scholar]
- 10. Hubbard LD, Brothers RJ, King WN,et al. Methods for evaluation of retinal microvascular abnormalities associated with hypertension/sclerosis in the Atherosclerosis Risk in Communities Study. Ophthalmology. 1999; 106: 2269– 2280. [DOI] [PubMed] [Google Scholar]
- 11. Aguilar W, Martinez-Perez ME, Frauel Y, Escolano F, Lozano MA, Espinosa-Romero A. . Graph-based methods for retinal mosaicing and vascular characterization. Lecture Notes Comp Sci. 2007; 4538: 25. [Google Scholar]
- 12. Chrástek R, Wolf M, Donath K, Niemann H, Michelson G. . Automated calculation of retinal arteriovenous ratio for detection and monitoring of cerebrovascular disease based on assessment of morphological changes of retinal vascular system. Mach Vis Appl. 2002: 240– 243.
- 13. Grisan E, Ruggeri A. . A divide et impera strategy for automatic classification of retinal vessels into arteries and veins. Engineering in medicine and biology society, 2003 Proceedings of the 25th annual international conference of the IEEE. Piscataway, NJ: IEEE; 2003: 890– 893. [Google Scholar]
- 14. Jelinek H, Depardieu C, Lucas C, Cornforth D, Huang W, Cree M. . Towards vessel characterization in the vicinity of the optic disc in digital retinal images. Image Vis Comput Conf. 2005: 2– 7.
- 15. Li H, Hsu W, Lee M-L, Wang H. . A piecewise Gaussian model for profiling and differentiating retinal vessels. Proceedings of the 2003 International Conference on Image Processing. 2003: Piscataway, NJ: IEEE; 2003: I– 1069. [Google Scholar]
- 16. Niemeijer M, van Ginneken B, Abràmoff MD. . Automatic classification of retinal vessels into arteries and veins. Med Imaging. 2009; 72601F– 72601F.
- 17. Rothaus K, Jiang X, Rhiem P. . Separation of the retinal vascular graph in arteries and veins based upon structural knowledge. Image Vis Comput. 2009; 27: 864– 875. [Google Scholar]
- 18. Simó A, de Ves E. . Segmentation of macular fluorescein angiographies. A statistical approach. Pattern Recognition. 2001; 34: 795– 809. [Google Scholar]
- 19. Vázquez S, Barreira N, Penedo M, Penas M, Pose-Reino A. . Automatic classification of retinal vessels into arteries and veins. Proceedings of the 7th International Conference Biomedical Engineering (BioMED 2010). Innsbruck, Austria: ACTA Press; 2010: 230– 236. [Google Scholar]
- 20. Vázquez S, Cancela B, Barreira N,et al. Improving retinal artery and vein classification by means of a minimal path approach. Mach Vis Appl. 2013; 24: 919– 930. [Google Scholar]
- 21. Kagemann L, Wollstein G, Wojtkowski M,et al. Spectral oximetry assessed with high-speed ultra-high-resolution optical coherence tomography. J Biomed Opt. 2007; 12: 041212. [DOI] [PMC free article] [PubMed] [Google Scholar]
- 22. Kondermann C, Kondermann D, Yan M. . Blood vessel classification into arteries and veins in retinal images. Proc SPIE Med Imag. 2007; 6512: 651247. [Google Scholar]
- 23. Narasimha-Iyer H, Beach JM, Khoobehi B, Roysam B. . Automatic identification of retinal arteries and veins from dual-wavelength images using structural and functional features. IEEE Trans Biomed Eng. 2007; 54: 1427– 1435. [DOI] [PubMed] [Google Scholar]
- 24. Gao X, Bharath A, Stanton A, Hughes A, Chapman N, Thom S. . A method of vessel tracking for vessel diameter measurement on retinal images. Proceedings 2001 International Conference on Image Processing. Piscataway, NJ: IEEE; 2001: 881– 884.
- 25. Roberts DA. . Analysis of vessel absorption profiles in retinal oximetry. Med Phys. 1987; 14: 124– 130. [DOI] [PubMed] [Google Scholar]
- 26. Huang K, Yan M. . A region based algorithm for vessel detection in retinal images. International Conference on Medical Image Computing and Computer-Assisted Intervention. New York, NY: Springer; 2006: 645– 653. [DOI] [PubMed] [Google Scholar]
- 27. Walter T, Massin P, Erginay A, Ordonez R, Jeulin C, Klein J-C. . Automatic detection of microaneurysms in color fundus images. Med Image Anal. 2007; 11: 555– 566. [DOI] [PubMed] [Google Scholar]
- 28. Gharabaghi S, Daneshvar S, Sedaaghi MH. . Retinal image registration using geometrical features. J Digit Imaging. 2013; 26: 248– 258. [DOI] [PMC free article] [PubMed] [Google Scholar]
- 29. Daniel E, Anitha J. . Optimum green plane masking for the contrast enhancement of retinal images using enhanced genetic algorithm. Optik. 2015; 126: 1726– 1730. [Google Scholar]
- 30. Walter T, Klein J-C. . Automatic analysis of color fundus photographs and its application to the diagnosis of diabetic retinopathy. Handbook of Biomedical Image Analysis. New York, NY: Springer; 2005: 315– 368. [Google Scholar]
- 31. Robles FE, Chowdhury S, Wax A. . Assessing hemoglobin concentration using spectroscopic optical coherence tomography for feasibility of tissue diagnostics. Biomed Opt Express. 2010; 1: 310– 317. [DOI] [PMC free article] [PubMed] [Google Scholar]
- 32. Wyszecki G, Stiles WS. . Color Science. New York, NY: John Wiley; 1982. [Google Scholar]
- 33. Chaudhuri S, Chatterjee S, Katz N, Nelson M, Goldbaum M. . Detection of blood vessels in retinal images using two-dimensional matched filters. IEEE Trans Med Imaging. 1989; 8: 263– 269. [DOI] [PubMed] [Google Scholar]
- 34. Haddad RA, Akansu AN. . A class of fast Gaussian binomial filters for speech and image processing. IEEE Trans Signal Process. 1991; 39: 723– 727. [Google Scholar]
- 35. Nixon MS, Aguado AS. . Feature Extraction and Image Processing for Computer Vision. Cambridge, MA: Academic Press; 2008; 88. [Google Scholar]
- 36. Shapiro LG, Stockman GC. . Computer Vision. Upper Saddle River, NJ: Prentice Hall; 2001: 150. [Google Scholar]
- 37. Kong TY, Rosenfeld A. . Topological Algorithms for Digital Image Processing. New York, NY: Elsevier Science; 1996. [Google Scholar]
- 38. Lam L, Seong-Whan Lee, Ching Y. . Suen. Thinning methodologies-a comprehensive survey. IEEE Trans Pattern Anal Mach Intel. 1992; 14: 879. [Google Scholar]
- 39. Reese AB. . Pigmentation of the optic nerve. Arch Ophthalmol. 1933; 9: 560– 570. [PMC free article] [PubMed] [Google Scholar]
- 40. Türksever C, Orgül S, Todorova MG. . Reproducibility of retinal oximetry measurements in healthy and diseased retinas. Acta Ophthalmol. 2015; 93. [DOI] [PubMed] [Google Scholar]
- 41. Hardarson SH, Harris A, Karlsson RA,et al. Automatic retinal oximetry. Invest Ophthalmol Vis Sci. 2006; 47: 5011– 5016. [DOI] [PubMed] [Google Scholar]
- 42. Goldbaum MH. . Retinal depression sign indicating a small retinal infarct. Am J Ophthalmol. 1978; 86: 45– 55. [DOI] [PubMed] [Google Scholar]
- 43. Hart WE, Goldbaum M, Cote B, Kube P, Nelson MR. . Measurement and classification of retinal vascular tortuosity. Int J Med Inform. 1999; 53: 239– 252. [DOI] [PubMed] [Google Scholar]
- 44. Alam M, Thapa D, Lim JI, Cao D, Yao X. . Quantitative characteristics of sickle cell retinopathy in optical coherence tomography angiography. Biomed Opt Express. 2017; 8: 1741– 1753. [DOI] [PMC free article] [PubMed] [Google Scholar]
- 45. Li H, Hsu W, Lee ML, Wong TY. . Automatic grading of retinal vessel caliber. IEEE Trans Biomed Eng. 2005; 52: 1352– 1355. [DOI] [PubMed] [Google Scholar]
- 46. Chu Z, Lin J, Gao C,et al. Quantitative assessment of the retinal microvasculature using optical coherence tomography angiography. J Biomed Opt. 2016; 21: 66008. [DOI] [PMC free article] [PubMed] [Google Scholar]
- 47. Joshi VS, Garvin MK, Reinhardt JM, Abramoff MD. . Automated artery-venous classification of retinal blood vessels based on structural mapping method. Proc. SPIE Med Imag. 2012: 83151C.
- 48. Relan D, MacGillivray T, Ballerini L, Trucco E. . Retinal vessel classification: sorting arteries and veins. Engineering in Medicine and Biology Society (EMBC), 2013 35th Annual International Conference of the IEEE. Piscataway, NJ: IEEE; 2013: 7396– 7399. [DOI] [PubMed] [Google Scholar]
- 49. Vázquez S, Cancela B, Barreira N, Penedo MG, Saez M. . On the automatic computation of the arterio-venous ratio in retinal images: using minimal paths for the artery/vein classification. 2010 International Conference on Digital Image Computing: Techniques and Applications (DICTA). Piscataway, NJ: IEEE; 2010: 599– 604. [Google Scholar]
- 50. Vazquez SG, Cancela B, Barreira N,et al. Improving retinal artery and vein classification by means of a minimal path approach. Mach Vis Appl. 2013; 24: 919– 930. [Google Scholar]


