Abstract
Purpose
To study the effects of acute optic nerve damage on the reflectance of the retinal nerve fiber layer (RNFL) and to compare the time courses of changes of RNFL reflectance and thickness.
Methods
A rat model of optic nerve crush (ONC) was compared with previously studied normal retinas. The reflectance and thickness of the RNFL were studied at 1 to 5 weeks after ONC. Reflectance spectra from 400 to 830 nm were measured for eyes with ONC, their contralateral untreated eyes, and eyes with sham surgery. Directional reflectance was studied by varying the angle of light incidence. RNFL thickness was measured by confocal microscopy.
Results
After ONC, the RNFL reflectance remained directional. At 1 week, RNFL reflectance decreased significantly at all wavelengths (P < 0.001), whereas there was no significant change in RNFL thickness (P = 0.739). At 2 weeks, both RNFL reflectance and thickness decreased significantly, and by 5 weeks they declined to approximately 40% and 30%, respectively, of the normal values. Although RNFL reflectance decreased at all wavelengths, there was a greater reduction at short wavelengths. Spectral shape at long wavelengths was similar to the normal. Some of these changes were also found in the contralateral untreated eyes, but none of these changes were found in eyes with sham surgery.
Conclusions
Decrease of RNFL reflectance after ONC occurs prior to thinning of the RNFL and the decrease is more prominent at short wavelengths. Direct measurement of RNFL reflectance, especially at short wavelengths, may provide early detection of axonal damage.
Keywords: retinal nerve fiber layer, optic nerve crush, optical properties, directional reflectance, thinning of the RNFL
Glaucoma is an optic neuropathic disease characterized by progressive degeneration and eventual death of retinal ganglion cells (RGCs) and their axons, which results in irreversible vision loss. Various animal models have been used to study the response of RGCs and their axons to optic nerve insults.1 Often-used models include ocular hypertension (OHT), optic nerve crush (ONC), and optic nerve transection (ONT). The axotomy model (ONC and ONT) subjects the optic nerve to acute injury, whereas the model of OHT uses elevation of intraocular pressure (IOP) to gradually damage the optic nerve. Both models show progressive loss of RGCs and thinning of the retinal nerve fiber layer (RNFL).2–17 Both models also show that change of RGCs occurs prior to thinning of the RNFL. Details of the RGC response to damage caused by axotomy and OHT are different, however. For instance, loss of axons is substantially greater and more rapid in the axotomy model than in the OHT model, and decrease in the dendritic structure of the RGCs is seen in axotomy retinas, but not in OHT eyes.6,11,15 These results suggest that the damage mechanisms of RGCs and their axons in the models of axotomy and OHT are not identical.
Clinical studies find that thinning of the RNFL in glaucoma may precede perimetric visual field change, and optical methods that provide analysis of the RNFL have become increasingly popular in clinical diagnosis of glaucoma.18–24 Optical measurement of the RNFL relies on the optical properties of the tissue; hence, knowledge of RNFL optical properties can improve measurement sensitivity to axonal damage and enhance understanding and interpretation of measured features of the RNFL. Studies with human glaucoma and animal models of OHT have found that elevation of IOP causes not only thinning of the RNFL but also decrease of the RNFL reflectance.25–29 Importantly, decrease of RNFL reflectance precedes thinning of the RNFL. Studies by our group further demonstrate that the decrease of RNFL reflectance is not uniform across wavelengths (400–830 nm); rather, RNFL reflectance at short wavelengths responds earlier to OHT damage than that at long wavelengths.30 Thus direct measurement of RNFL reflectance, especially at short wavelengths, may provide more sensitive detection of axonal damage than RNFL thickness measurement.
Although the response of RNFL reflectance and thickness to axonal insults has been explored in animal models of OHT, there is limited knowledge of the optical properties of the RNFL after axotomy. In one example, however, Fortune et al.31 found that RNFL birefringence in four nonhuman primate eyes decreased after ONT and the decrease preceded thinning of the RNFL. In this study, we used a rat model of ONC to investigate the effects of axotomy on RNFL reflectance and the reflectance spectrum and compared the time courses of RNFL reflectance and thickness changes.
Materials and Methods
Animals and Experimental Design
Female Wistar rats, 6 to 10 months old and weighing approximately 250 g, were used in this study. Animals were housed under a 12-hour light and 12-hour dark cycle with standard food and water provided ad libitum. For surgical procedures, rats were anesthetized by intramuscular injection with a mixture of 60 mg/kg ketamine (KetaVed by VEDCO, Inc., Saint Joseph, MO, USA) and 7 mg/kg xylazine (TranquiVed, by VEDCO, Inc.). All experimental methods and animal care procedures adhered to the ARVO Statement for the Use of Animals in Ophthalmic and Vision Research. The protocol for the use of animals was approved by the Animal Care and Use Committee of the University of Miami.
Forty-three rats were used for the study of the ONC model, with each animal allocated to one of two groups. Thirty rats had unilateral ONC in the left eye. Thirteen rats had unilateral sham surgery in the left eye (see detailed methods below). After ONC or sham surgery, both eyes of a rat were used in the study.
To compare measured RNFL optical properties with normal retinas, we used data from previous studies. Data for normal retinas were from 33 retinas of 20 rats without any operation on either eye; 7 retinas were excluded due to either preparation damage or poor quality of confocal imaging.
Optic Nerve Crush
After a rat was in deep sedation, an incision was made in the superior conjunctiva to allow gentle outward retraction of the globe using fine forceps.32 The muscle cone was entered and the optic nerve was exposed. The exposed optic nerve was grasped approximately 2 mm from the eye with a self-closing forceps (Dumont #N7 cross-action forceps by Roboz Surgical Instrument Co., Gaithersburg, MD, USA) for 10 seconds. The forceps was then removed, allowing the eye to resume its natural location in the orbit.
In the sham group, the surgical procedure was identical except for not applying the self-closing forceps to the optic nerve.
Retina Preparation and Measurement of RNFL Reflectance
At 1 to 5 weeks after ONC, both retinas of a rat were removed and prepared for reflectance measurements followed by immunohistochemical staining and confocal imaging. Tissue preparation followed previously developed procedures.33 Briefly, an eye cup of 5-mm diameter was excised and placed in a dish of warm (33°–35°C) oxygenated physiological solution. After removal of the vitreous, the retina was dissected free of the retinal pigment epithelium and choroid and then flat-mounted between two membranes.33 The preparation was carried out with intense white illumination, which thoroughly bleached the visual pigment in the photoreceptors. The mounted retina was then placed in a chamber perfused with warm physiological solution to maintain the tissue in a living state. Tissue preparation took 5 to 10 minutes and the optical measurements were completed within 30 minutes.
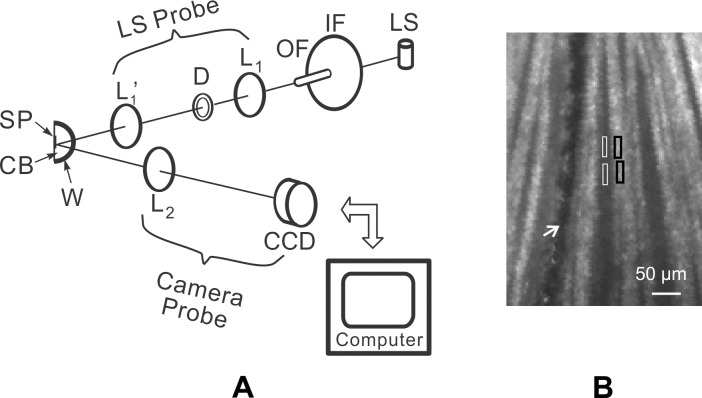
Reflectance of the RNFL was measured by a multispectral imaging microreflectometer (Fig. 1A). The device and measurement of retinal reflectance have been described in detail previously.33,34 Briefly, the fluid-filled perfusion chamber held a piece of retina at the center of curvature of a spherical window. The retina was illuminated by a tungsten–halogen light source and interference filters (bandwidth at half-height of 10 nm). The retina was imaged by a cooled charge-coupled device (CCD camera, U47+ Digital Imaging System; Apogee Instruments, Inc., Roseville, CA, USA). Black images, taken with the same exposure duration but with the light source off, were subtracted from each image to compensate for the dark current and bias level of the CCD. The resulting pixel values were directly proportional to reflected intensity. To calculate relative reflectance, images were also taken of a diffuse white reflector (Kodak 6080 White Reflectance Coating; Eastman Kodak Company, Rochester, NY, USA). Pixel values of retinal images were then converted to relative reflectance Rλ by:
 |
where  is the known reflectance coefficient of the white reflector at wavelength
  , V and Vw are pixel values of the tissue and white reflector, respectively, and t and tw are their corresponding exposure durations. In this study the relative reflectance Rλ, expressed in units of percent incident light reflected, is simply called reflectance.
Figure 1.
(A) Schematic diagram of the multispectral imaging microreflectometer. LS, light source; IF, interference filter; OF, optic fiber; D, diaphragm; L1, L1′, and L2, lenses; SP, specimen; CB, specimen chamber; W, spherical window; and CCD, charge-coupled device. The light source and camera axes intersected at the center of the spherical window. The light source (LS) probe could be moved in both azimuth and elevation. The camera probe could be moved in azimuth with elevation fixed. (B) Reflectance image of normal RNFL. Bundles appear as bright stripes against a dark background. Wavelength: 500 nm; black boxes: bundle areas; white boxes: gap areas; white arrow: blood vessel.
Figure 1B shows a typical retinal image taken with the imaging microreflectometer. Reflectance measured on bundle areas (black boxes, Fig. 1B) includes light reflected from the RNFL and its underlying tissue. Because the weak scattering of the RNFL causes little attenuation to an incident beam, we assumed that the reflectance from deep layers was approximately the same as that from nearby gap areas (white boxes, Fig. 1B) between bundles. To calculate RNFL reflectance, areas were chosen both on bundles and on nearby gaps, and the average reflectance of gap areas (Rgap) was then subtracted from the total reflectance (Rtotal) measured on the bundle areas to get an estimate of the bundle reflectance alone, that is, R = Rtotal − Rgap.
Measurement of the Directionality of RNFL Reflectance
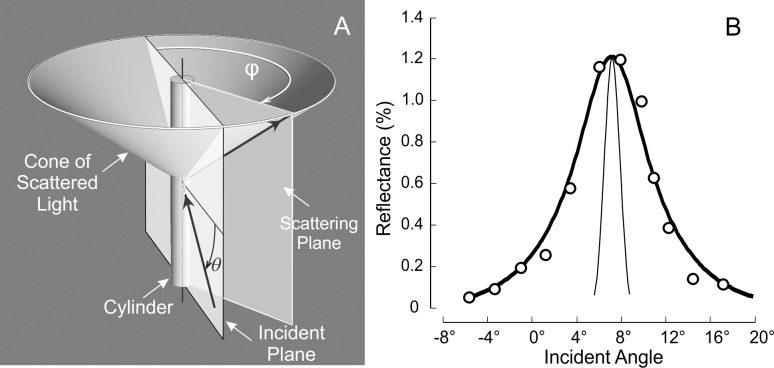
The RNFL reflectance arises from light scattering by cylindrical structures,34,35 resulting in a very directional reflectance confined to a conical sheet centered on the axes of the cylinders.36 Figure 2A shows the theoretical geometry of light scattering by a single cylinder, an infinitesimally thin conical sheet. For RNFL reflectance, however, misalignment of cylinders in bundles will broaden the scattered sheet, and the finite apertures of the light source and camera will also spread the measured cone. Because the geometry of Figure 2A also works in reverse, in the experiments the light source was moved to probe the scattered cone while the camera position was fixed to achieve a constant relationship between the camera and the retina.
Figure 2.
(A) Geometry of light scattering by a cylinder. The light scattered by a cylinder is confined to a conical sheet coaxial with the cylinder axis. The apex angle of the cone is twice the angle between the cylinder axis and the incident ray. The incident angle (θ) of a bundle is defined as the angle between the incident ray and a plane perpendicular to the bundle; the scattering angle (φ) is defined as the angle between incident and scattering planes, where the incident plane contains the incident ray and the bundle and the scattering plane contains the reflected ray and the bundle. Values for θ and φ of a bundle are calculated from the positions of the light source and camera and the bundle orientation and position in the retina. (B) Illustration of the angular spread function (ASF) of the RFNL reflectance. Circles are the measured ASF of a normal nerve fiber bundle (500 nm). The thick curve is the fitted ASF (Equation 2), which is the convolution of the angular response function of the instrument (thin curve) and a symmetric decaying exponential.
Figure 2B shows a typical angular spread function (ASF) of the reflectance of normal nerve fiber bundles. To quantitatively describe the measured ASF, the measured data were fit with a symmetrical decaying exponential function convolved with the angular response function of the instrument (thin curve in Fig. 2B). The function had the following form:
 |
where θ is the incident angle of a bundle (Fig. 2A), H is the amplitude of the exponential, ε is the location of its peak, W is the half-width to 1/e of its peak,  is the instrument's angular response function, * denotes convolution, and O is a vertical offset.
Comparison of RNFL Reflectance and Its Spectrum
In this study, reflectance was measured at 17 wavelengths between 400 and 830 nm. To characterize the short (S), medium (M), and long (L) wavelength ranges, respectively, average reflectances at 400 and 420 nm (R400–420), 560, 580, and 600 nm (R560–600), and 780 and 830 nm (R780–830) were calculated. Because R depends on measurement geometry (Fig. 2),34,37 R was calculated only for those bundle areas with R measured at maximum (on-peak) reflectance. Because R is also proportional to RNFL thickness (T),38 reflectance per unit thickness (σ) provides a measure that does not depend on T. σ has units of percent incident light reflected per micrometer thickness (%/μm). Quantitative comparison of RNFL reflectance used σ calculated for different wavelength ranges, that is, σS = R400–420/T, σM = R560–600/T, and σL = R780–830/T.
To compare the shape of reflectance spectra measured on different bundles, each spectrum was normalized to its R560–600. For quantitative comparison, reflectance ratios at short and long wavelengths, ρS = R400–420/R560–600 and ρL = R780–830/R560–600, or ρS = σS/σM and ρL = σL/σM, were calculated. Because the shape of the RNFL reflectance spectrum is not strongly affected by the property of directional reflectance,37 calculation and comparison of reflectance spectra were not limited to those bundles measured at on-peak reflectance.
Measurement of RNFL Thickness
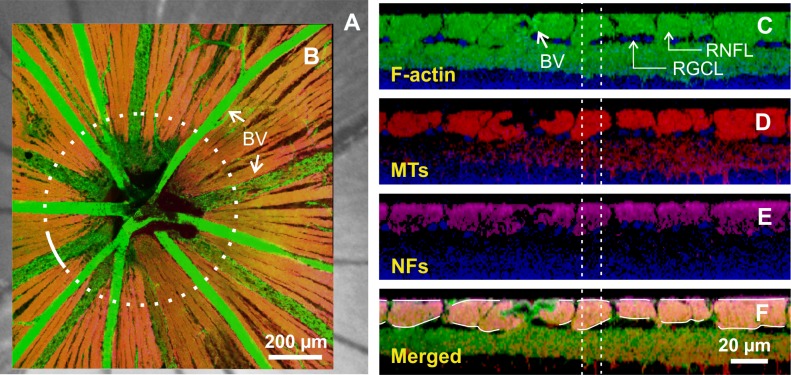
After reflectance measurements, the mounted retina was fixed in 4% paraformaldehyde for 30 minutes at room temperature and rinsed thoroughly in 1× phosphate-buffered saline (PBS) followed by immunohistochemical staining of F-actin, microtubules (MTs), neurofilaments (NFs), and nuclei. F-actin was stained with 1:100, Alexa Fluor 488 Phalloidin (A12379; Invitrogen Corp., Carlsbad, CA, USA); MTs were stained with 1:100, anti-β-tubulin antibody with Cy3 conjugated (C4585; Sigma-Aldrich Corp., St. Louis, MO, USA); NFs were stained with a primary antibody solution (1:500, rabbit anti-neurofilament 200 kD, N4142; Sigma-Aldrich Corp.) and a secondary antibody (1:250, Alexa Fluor 647 goat anti-rabbit IgG, A21245; Invitrogen); and nuclei was counterstained with 4′,6-diamidino-2-phenylindole (DAPI, D21490; Invitrogen). The detailed staining procedures have been published previously.39 The fluorescently stained retina was placed on a glass slide and covered with mounting medium (VectaShield H-1000; Vector Laboratory, Burlingame, CA, USA). A coverslip was then gently floated on top without contacting the retinal surface. The mounted retina was imaged by a confocal laser scanning microscope (Leica TCS SP5; Leica Microsystems, Wetzlar, Hesse, Germany). A ×40 oil objective provided en face images of a retina with a field of view of 389 × 389 μm and a resolution limited to the sampling density of 0.76 μm per pixel. To cover all bundles emerging from the ONH, at least a 3 × 3 tiled array of images was taken that covered a retinal area of 1.2 × 1.2 mm with the ONH at the center (Fig. 3B). For each array position, en face images were collected at evenly spaced positions in depth (1 μm apart in tissue) starting from the RNFL surface through the retina to a depth at least including the ganglion cell layer. The retina was then reconstructed in three dimensions and cross-sectional (CS) images were synthesized from the reconstruction with customized software (Figs. 3C–E).
Figure 3.
Confocal images of a whole-mounted normal retina. (A) Retinal image in reflectance. (B) Merged en face image of the same retina with F-actin, MT, and NF stain. Dotted circle: a path (r = 300 μm) used for getting cross-sectional images and calculating RNFL thickness. (C–E) Cross-sectional images of F-actin, MTs, and NFs along the white arc in (B). Nerve fiber bundles on the top layer are intensely stained and separated from the deeper layers by the retinal ganglion cell layer (RGCL). Images are merged with stained nuclei (blue). (F) Merged cross-sectional image used for measuring RNFL thickness. Dashed vertical lines: a window used for calculating bundle thickness. BV, blood vessel.
To identify the location of an individual nerve fiber bundle measured optically, the en face confocal image of a retina was registered onto the optical images of the same retina by matching the blood vessel patterns (Figs. 3A, 3B). The registered images allow assessment of the optical properties and axonal structure of the same nerve fiber bundles. The RNFL was identified as an intensely stained structure in the top layer of the retina (Figs. 3C–E). To measure RNFL thickness, a merged CS image of stained F-actin, MTs, and NFs (Fig. 3F) was used to trace the overall extent of the RNFL (white curves in Fig. 3F).
The thickness of an individual bundle was measured as the average thickness within a window centered on the bundle and half as wide (dashed lines in Figs. 3C–F). In this study, measurement uncertainty of the RNFL thickness did not exceed 2 μm, limited by the step of the depth scan.
To compare change of RNFL thickness between retinas, RNFL thickness of each bundle along a circular path (radius of 300 μm) around the ONH was measured and averaged.
Data Analysis
Measurements were compared with a two-tailed t-test and, when necessary, a linear mixed-model (LMM) analysis accounting for the correlation between multiple measurements made on the same retina and bundles. Post hoc least-significant difference (LSD) tests were used to compare measured parameters. The influence of treatment group on the measured parameters was studied with the analysis of covariance formulation of the general linear model (IBM SPSS Statistics 22; IBM Corporation, Somers, NY, USA). The significance level was set at P < 0.05.
Image reconstruction and data analysis were implemented with customized software programmed in Matlab (Matlab Version 2012b; The MathWorks, Inc., Natick, MA, USA).
Results
For the ONC group, the RNFL reflectance and thickness were studied for both retinas of a total of 30 rats. For the sham group, only the eyes with sham surgery were studied. The number of rats and studied time points are given in Table 1.
Table 1.
Number of Rats Studied at Different Time Points After Optic Nerve Surgery
RNFL Thickness Decreases After ONC
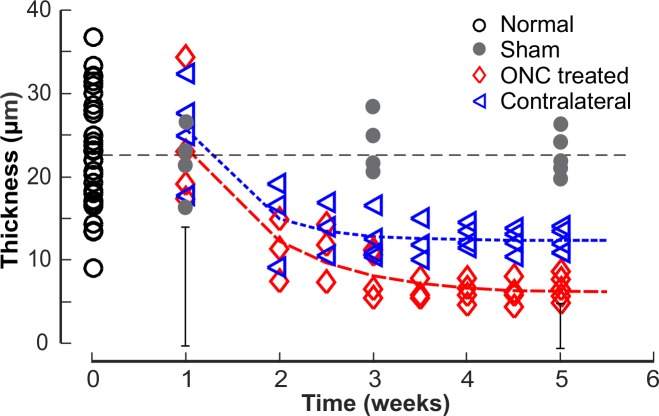
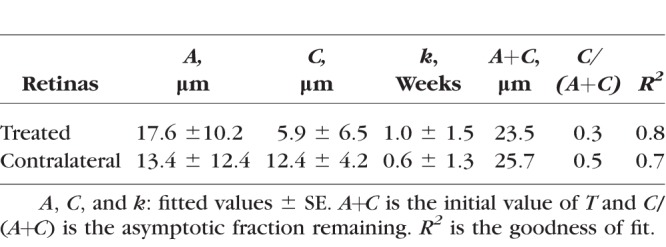
Figure 4 shows the time courses of the mean RNFL thickness (T) that was measured at r = 300 μm around the ONH. At 1 week after ONC, there was no effect of ONC treatment on T of the treated retinas (P = 0.739, two-sample t-test). After 2 weeks, there was a highly significant decrease in T compared with the normal (P < 0.001, LMM). Interestingly, T in the contralateral untreated eyes also decreased significantly after 2 weeks of ONC (P < 0.001). The difference between T at week 5 and the mean of the normal in the contralateral eyes, however, was less than that of the treated eyes (P < 0.001, paired t-test). The decaying T over time can be described by an exponential function that started at week 1,  + C, where t is time (Fig. 4). The fitting parameters are in Table 2. The fitting estimates that T decreased to 52% and 59% of the normal value at week 2 for the treated and the contralateral eyes, respectively, and further decreased to 35% and 50% at week 3. On the other hand, T in the eyes with sham surgery did not show change over time (P = 0.351) and was similar to the normal (P = 0.334).
Figure 4.
Thinning of the RNFL after ONC. Each symbol: the average RNFL thickness (T) along a circle around the ONH with a radius (r) of 300 μm. Curves: fitting with an exponential function. Horizontal line: the mean T of 33 normal retinas. Vertical bars: maximum 2 × SD of the T measured along the circle for the treated eyes at 1 and 5 weeks.
Table 2.
Exponential Function Fitting of the RNFL Thickness: 
RNFL Reflectance Remains Directional After ONC
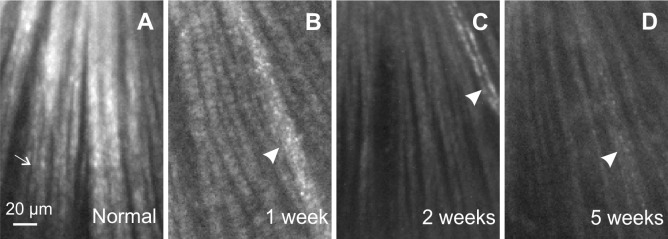
Normal nerve fiber bundles appear as bright stripes against a darker background (Fig. 5A).33 In retinas with ONC, the contrast of nerve fiber bundles in reflectance images decreased as shown in Figures 5B through 5D. Although bundles became dimmer with time after ONC, the reflectance of nerve fiber bundles remained directional. Figure 6 demonstrates the directional reflectance of nerve fiber bundles after ONC. RNFL reflectance (R) was measured at different incident angles of the illumination beam. For the defined bundle area, a change of 5.8° in the incident angle led to a 66% decrease of R from the on-peak (Fig. 6A) to the off-peak reflectance (Fig. 6B). Figure 6C shows the ASF of the bundle's reflectance, that is, the dependence of measured R on the incident angle. The solid curve in Figure 6C shows the fitting of the ASF with Equation 2.
Figure 5.
Reflectance images of a normal retina and retinas with ONC. All images were taken at 500 nm and are displayed with the same contrast setting. Most of the bundles were measured at near maximum (on-peak) reflectance, except for a few bundles (thin arrow in A) with off-peak reflectance where the tissue curved. (A) Normal bundles appear as bright stripes against a dark background. (B–D) Bundles in retinas with ONC appear dimmer. Arrowheads: blood vessels.
Figure 6.
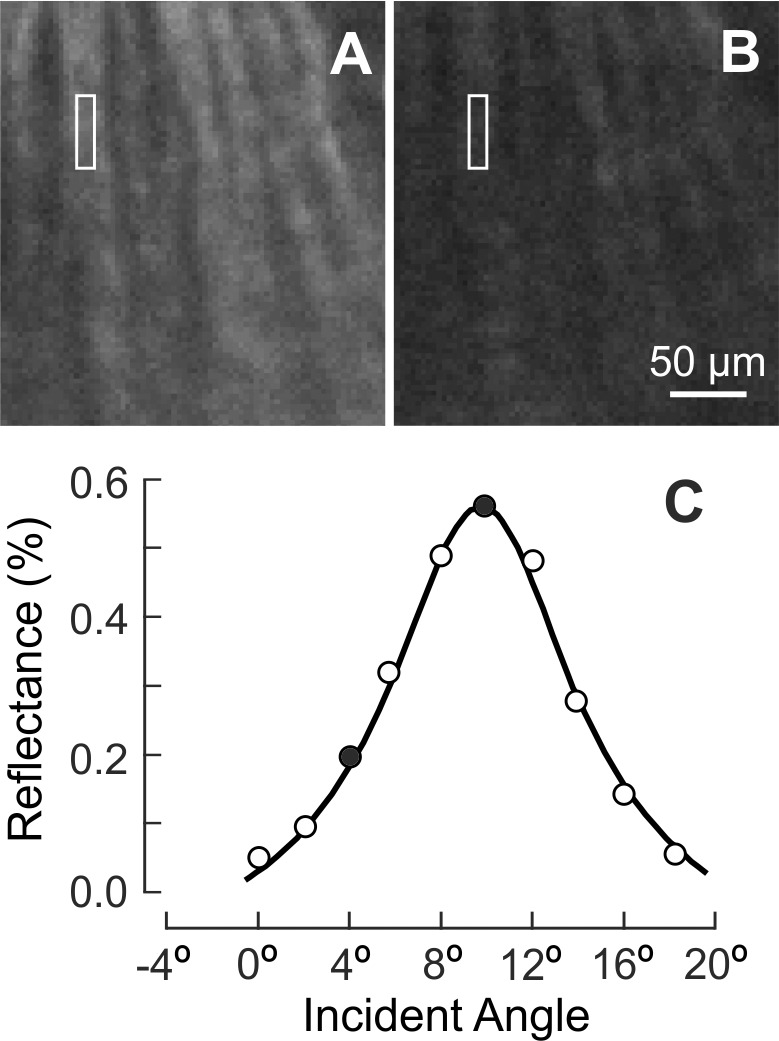
The property of directional reflectance was retained in the RNFL with ONC (4.5 weeks). (A, B) The same nerve fiber bundles imaged at on-peak and off-peak reflectance at 500 nm and displayed with the same contrast setting. (C) Measured angular spread function of the bundle reflectance (white box in A, B). Reflectance strongly depends on incident angle. Solid circles: measured reflectances in (A, B). Curve: fitting with Equation 2.
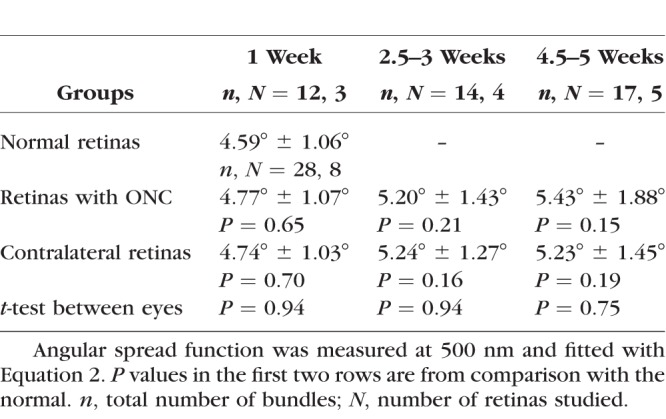
Directional reflectance was studied for a subgroup of 12 retinas at 400, 500, 660, and 830 nm. For each retina, the ASF from at least three bundles imaged at near-direct backscattering was measured and the data were fitted with Equation 2. The fitted amplitudes depend on the reflectance and thickness of bundles and are not compared. The fitted width (W) of the ASF measured at 500 nm is summarized in Table 3. There was no significant difference among the W of normal retinas, the retinas with ONC, and the ONC contralateral retinas. At each of 400, 660, and 830 nm, the fitted W of the ASF was also not significantly different among groups (data not shown).
Table 3.
Fitted Width (W) of the Angular Spread Function of the RNFL Reflectance
The retention of directional reflectance throughout the temporal changes after ONC requires that quantitative comparisons of reflectance be made at the peak of the ASF.37
RNFL Reflectance Decreases After ONC
To quantitatively compare changes of bundle reflectance, the reflectance independent of thickness, that is, reflectance per thickness (σ = R/T), was calculated, where R is the maximum (on-peak) reflectance. Because ONC causes diffuse damage of the RGCs and their axons across the retina,6,17 the mean σ of all bundles (at least four bundles) analyzed within the same retina was used to represent σ of the tissue. Twelve out of 30 rats with ONC were excluded from the comparison for one of the following reasons: No bundles were measured at on-peak, or bundles were too thin to define bundle areas for reliable calculation of σ.
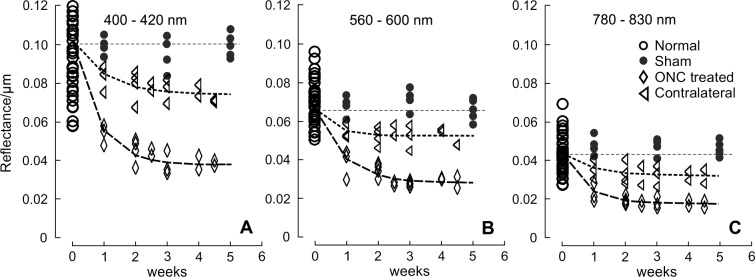
For all eyes with ONC, σ calculated in different wavelength ranges (σS, σM, and σL) showed significant decline (Fig. 7, P < 0.001, LMM), even for the retinas studied at 1 week after ONC when bundle thickness was still within the normal range (Fig. 4). Decline of σ progressed with time. Fitting with an exponential function shows that σS, σM, and σL decreased to 54%, 60%, and 50% of the normal values, respectively, at week 1 and further decreased to 42%, 48%, and 46% at week 2. The asymptotic fraction remaining was around 40%, as shown by the fitting (Table 4).
Figure 7.
RNFL reflectance per thickness (σ) in retinas with ONC and contralateral untreated retinas. σ decreased over time and at all studied wavelengths for the ONC treated and untreated groups. Curves: fitting with the exponential function  + C, where t is time with the normal data used for t = 0. The fitting results are in Table 4. Horizontal dashed lines: the mean σ of normal RNFL.
Table 4.
Exponential Function Fitting of the RNFL Reflectance: 
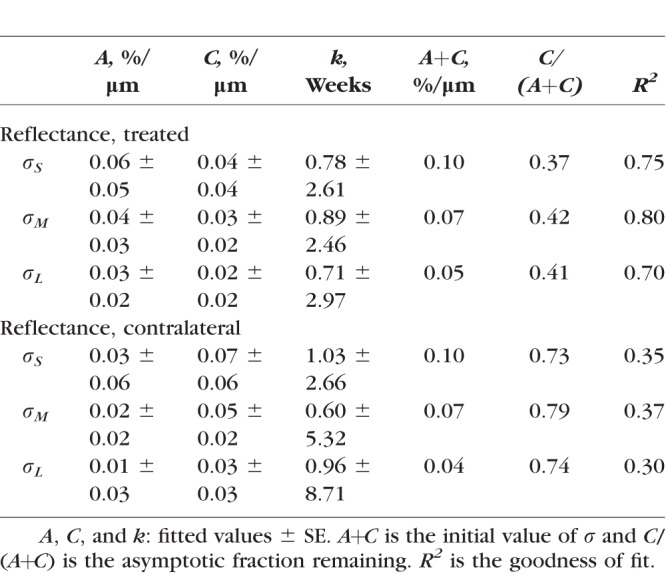
For the untreated contralateral eyes, each of σS, σM, and σL also showed a significant decline at all measured time points (P < 0.03) except for week 1 (P > 0.12), although the decline was less than in the corresponding treated eyes (P < 0.001, paired t-test). The exponential fitting shows 73% to 79% of the initial reflectance remaining (Table 4). On the other hand, σ of bundles in the retinas with sham surgery was similar to the normal (P = 0.76).
RNFL Reflectance Spectrum After ONC
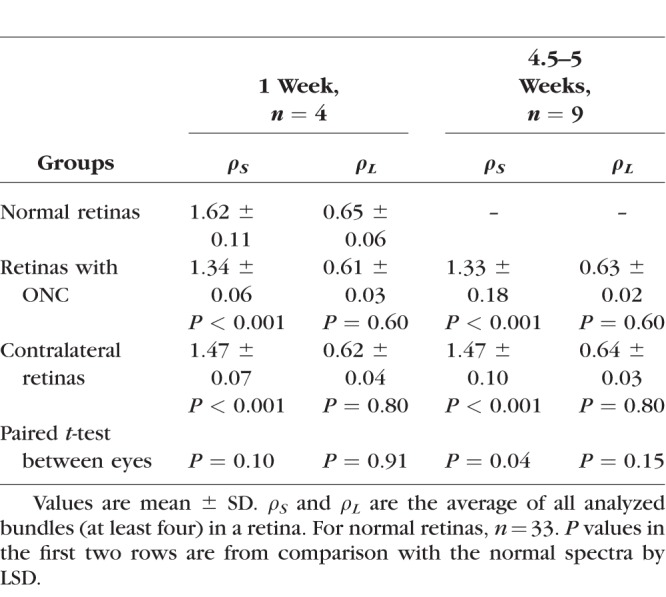
The reflectance of normal RNFL is wavelength dependent (Zhou and Knighton. IOVS 1993;34:ARVO Abstract 1504)34,40; R decreases monotonically with increase of wavelength (gray circles in Fig. 8). Similar to the comparison of σ, the mean reflectance ratios at short and long wavelengths, ρS and ρL, of all bundles (at least four bundles) analyzed within the same retina were used to represent the tissue. In retinas with ONC, the shape of the RNFL reflectance spectrum changed at short wavelengths as demonstrated by the normalized reflectance spectra (Figs. 8A, 8B). Change of the shape was similar along bundles (Fig. 8C). At all measured time points, ρS was significantly lower than the normal while ρL did not show significant change (Table 5). There was no significant difference of ρS measured at different time points (P = 0.90, LSD). In the contralateral untreated retinas, the reflectance spectra also showed significant decrease of ρS compared with the normal at all measured time points, but the decrease was less than in the treated eyes (Table 5).
Figure 8.
RNFL reflectance spectra in retinas with ONC. Spectra were normalized to the mean reflectance at 560 to 600 nm. (A, B) Spectra changed at short wavelengths both in eyes with ONC and in contralateral untreated eyes. n = 4 and 9 retinas for (A, B), respectively. (C) Spectral shape was similar along bundles after ONC. Each spectrum is the mean of 16 spectra from four retinas with the maximum SD shown in the lower right (vertical bar). Gray circles and thin curves: the mean ± 2 SD of normalized reflectance spectra of 33 normal retinas.
Table 5.
Reflectance Ratios at Short and Long Wavelengths
Discussion
Numerous studies on the response of the RNFL and RGCs to axotomy show that either ONC or ONT results in progressive loss of RGCs and loss of RGCs precedes thinning of the RNFL.2,4,6,9–15,17 This study used an in vitro ONC model to investigate the effects of acute optic nerve injury on the reflectance of the RNFL. Use of the in vitro approach to study the optical properties of the RNFL eliminates the confounding effects of the ocular media (primarily cornea and lens) on the measurements and provides well-controlled settings for the measurement geometry. Furthermore, the in vitro retina can be transferred directly to the processing steps for immunohistology, allowing precise comparisons between in vitro optical properties and confocal microscopic measurements of RNFL thickness on the same nerve fiber bundles.
As expected from other studies of axotomy,6,10,12–15 in this study ONC caused RNFL thickness to decrease over time. This decrease began after a delay; at week 1 the thickness was no different from normal. At week 2, however, thickness had decreased by 48%. Other studies with the RNFL measured by optical coherence tomography (OCT) showed similar delay of thinning, and their authors have speculated that it is caused by transient RNFL swelling after axotomy or the contribution of activated microglia to the thickness measurement.12,14,15 In the present study, the RNFL thickness was measured from immunohistologically stained axonal cytoskeleton, which limits the measurement to tissue that actually contains axons. After 2 weeks the RNFL thickness continued to decline to an asymptotic value of approximately 30% of normal (Fig. 4; Table 2). It is perhaps surprising that ONC leaves any axons to form the RNFL, but studies with immunohistologic staining of NFs show axonal survival after a few months of ONC and even ONT.6,15
Although the RNFL reflectance decreased after ONC, the property of directionality did not change (Fig. 6), which implies that whatever structures are left to scatter light still have cylindrical geometry. The result also demonstrates that directional reflectance can cause significant variability in measured RNFL reflectance regardless of damage. Studies with an in vitro preparation can reduce this variability by setting an appropriate scattering geometry to obtain all reflectance measurements on-peak (Fig. 2A). In clinical studies of RNFL reflectance, however, the bundle orientation varies as determined by anatomy and the measurement angles are constrained by the pupil. All measurements cannot be made at the peak of the ASF, so measurements of RNFL reflectance must account for and control the effect of measurement geometry.37,41
The RNFL reflectance observed with the imaging microreflectometer is proportional to its thickness,38 so reflectance per unit thickness (σ = R/T) is used to compare reflectance change in bundles of different thickness. The same measure provides a direct comparison to the internal reflectance of the RNFL seen in OCT of humans. For brevity, in what follows, the term reflectance should be understood to mean reflectance per unit thickness.
We found that the RNFL reflectance decreased significantly after ONC, with a rapid decline in the first 2 weeks and a slow decline thereafter (Fig. 7). The time course of RNFL reflectance shows exponential decay, a feature that also has been found for the loss of RGCs and change of ganglion cell morphology after axotomy.2,5,9,12,14,17,42 In addition to the overall decrease in reflectance, the RNFL reflectance spectrum also changed after ONC, as shown by the normalized reflectance spectrum (Fig. 8).
Change of the RNFL reflectance and spectral shape is also found in the OHT model,29,30 but with striking differences from the ONC model. First, in the ONC model the decrease of the RNFL reflectance occurred immediately at all wavelengths (Fig. 7), whereas in the OHT model with early signs of axonal alteration the RNFL reflectance decreases at short wavelengths but not at long wavelengths. Second, in the ONC model the normalized RNFL reflectance changed at short wavelengths (ρS) but not at long wavelengths (ρL) (Table 5). In contrast, both ρS and ρL change in the OHT model when the RNFL exhibits apparent ultrastructural alteration and/or decrease of thickness.29,30 Third, in the ONC model the change of spectrum was similar along bundles (Fig. 8C), whereas in the OHT model the change of spectrum can differ along the same bundle. Finally, in the ONC model the change of the RNFL reflectance spectrum was similar over time although loss of RGCs and axons is progressive,5–7,12 whereas, importantly, in the OHT model the spectral change depends on the damage severity of the axonal cytoskeleton.29,30
The results of Figures 4 and 7 combine to suggest a lag of approximately 1 week between the decrease of RNFL reflectance and thickness. In the present study, the RNFL thickness was measured from immunohistologically stained axonal cytoskeleton; hence, the result supports the conclusion that decrease of the RNFL reflectance precedes loss of axonal content and thinning of the RNFL. The lag between the decrease of RNFL reflectance and thickness is consistent with the time delay between RGC loss and RNFL thinning found in other studies with ONC and ONT.6,12,14,15 Because this study did not assess RGCs, it is unclear whether the decrease of RNFL reflectance is also associated with loss of RGCs. It is worth noting that the changes in reflectance that precede thinning do not necessarily imply loss of axons or RGCs, but can result solely from a change in ultrastructure. Also worth noting is that in a clinical setting, even if some RGCs are lost, early detection allows early intervention to prevent the loss of more.
Decrease of the RNFL reflectance prior to thinning of the RNFL also is found in the rat model of OHT,25 and several studies with nonhuman primates and human glaucoma demonstrate that measurements of the RNFL reflectance provide more sensitive detection of RNFL damage than RNFL thickness.27,28,43 Thus, experimental evidence shows that direct measurement of RNFL reflectance provides early detection of RNFL damage caused by ONC, OHT, and clinical disease and justifies future efforts to develop a routine clinical measurement of RNFL reflectance.
RNFL reflectance directly depends on the ultrastructure of the tissue.44–47 Under one model, light scattering from thin cylinders dominates the reflectance at short wavelengths, while thick cylinders contribute more to the reflectance at long wavelengths.34 ONC directly injures the optic nerve and likely damages, to more or less the same degree, all cylindrical scatterers that contribute to the RNFL reflectance, perhaps causing the observed decrease of the RNFL reflectance at all wavelengths. In contrast, OHT causes selective damage of axonal ultrastructure, and different structural components respond differently to the OHT damage,39,48–52 which may explain the nonuniform change of the RNFL reflectance across wavelength. The scatterers that contribute to the RNFL reflectance at short wavelengths may be more sensitive to OHT damage, resulting in a decrease of ρS but not ρL at early stages of damage. With the progression of OHT damage, other structures respond and result in a decrease of ρS and an increase of ρL. The above may also explain the observed uniformity of spectral change along bundles and over time in the ONC model and the differences of the spectrum with cytostructural damage severity in the OHT model. Different mechanisms of axonal damage after axotomy and OHT have been suggested by differential changes of RGC morphology and retinal gene expression.11,17,53,54 Differential changes of the RNFL reflectance spectrum in the models of ONC and OHT provide additional evidence to support this suggestion.
This study used 30 pairs of retinas with ONC in one eye and found that the contralateral eye also exhibited a decrease of RNFL reflectance and thinning of the RNFL, although the degree of change was less than in the eye with ONC. Findings by others of contralateral effects after unilateral axotomy are mixed and even contradictory.13–16,55,56 For instance, Nadal-Nicolas et al.16 found no loss of RGCs in the contralateral eye at 6 months after ONC or at 15 months after ONT, whereas Choe et al.14 showed that the density of RGCs in the contralateral retinas decreased by 20% at week 3 after ONT while the RNFL thickness increased significantly. The optical changes in the contralateral RNFL found in the present study add to the confusion, but they are robust results and must be reported. On the other hand, the mechanism of these changes is unclear. One possible explanation is that the change is related to an activation, through the retinoretinally projecting RGCs, of astrocytes and microglial cells in the contralateral untreated retina.13,14,57–64 The activated microglial cells can both phagocytose RGCs and affect the stability of their axons,62,65–67 which may subsequently result in the observed change of the RNFL reflectance and thickness. It is reported that the number of retinoretinal RGCs is small in rats, however.68–70 Nevertheless, the appropriate controls when the ONC model is used are nontreated or sham-treated animals.
A recent study by Nadal-Nicolas et al.71 shows that T declines with age, so it is important to consider whether aging can account for our results. For normal albino rats, T decreased 21% over 9 months (from 6 to 15 months).71 In the present study, the age of studied rats ranged from 6 to 10 months, so differences in age could have added to the variance of the measurements. As shown in Figure 4, the mean T ± SD for the normal control was 23.6 ± 6.5 μm, and the mean T for the treated and contralateral retinas at 2 weeks were 13.8 ± 1.8 and 17.1 ± 3.2 μm, respectively, with corresponding changes of 42% and 28%. The exponential asymptote shows 30% and 50%, respectively, of T remaining after ONC (Table 2). Because these losses are much greater than the effect of age, the thinning of the RNFL in both treated and contralateral groups was due to ONC.
In conclusion, this study has three important limitations. First, although the in vitro approach provides for quantitative measurements, it is an inherently CS design, with one time point from each animal. It also incurs the unknown effects of the surgery required to produce the preparation. The results found here must be pursued in vivo to follow longitudinal changes of RNFL reflectance and thickness within animals. Second, the study did not identify RGCs. Because both decrease of RNFL reflectance and loss of RGCs occur prior to thinning of the RNFL, future studies should include assessment of RGCs and study the relationship between changes of the RNFL reflectance and RGCs after axotomy. Third, the details of the changes found in this study may not be directly applicable to the human due to differences of optic nerve structure and RGC morphology in rats and human, but the knowledge gained provides guidance for conducting studies on the optical properties of the RNFL of human eyes. Assessment of the optic neuropathic diseases by optical methods is popularly used in clinical practice. Knowledge of the optical properties of ocular tissues is essential to understand and interpret the measurements.
Acknowledgments
The authors thank Robert W. Knighton, PhD, for providing useful suggestions and reviewing the manuscript and William J. Feuer, MS, for providing statistical analysis and consultation.
Supported by National Institutes of Health Grant R01-EY019084, National Institutes of Health Center Grant P30-EY014801, and an unrestricted grant from Research to Prevent Blindness, Inc.
Disclosure: X.-R. Huang, None; W. Kong, None; J. Qiao, None
References
- 1. Levkovitch-Verbin H. . Animal models of optic nerve diseases. Eye. 2004; 18: 1066– 1074. [DOI] [PubMed] [Google Scholar]
- 2. Villegas-Perez MP, Vidal-Sanz M, Rasminsky M, Bray GM, Aguayo AJ. . Rapid and protracted phases of retinal ganglion cell loss follow axotomy in the optic nerve of adult rats. J Neurobiol. 1993; 24: 23– 36. [DOI] [PubMed] [Google Scholar]
- 3. Chauhan BC, Pan J, Archibald ML, LeVatte TL, Kelly MEM, Tremblay F. . Effect of intraocular pressure on optic disc topography, electroretinography, and axonal loss in a chronic pressure-induced rat model of optic nerve damage. Invest Ophthalmol Vis Sci. 2002; 43: 2969– 2976. [PubMed] [Google Scholar]
- 4. Kawaguchi I, Higashide T, Ohkubo S, Takeda H, Sugiyama K. . In vivo imaging and quantitative evaluation of the rat retinal nerve fiber layer using scanning laser ophthalmoscopy. Invest Ophthalmol Vis Sci. 2006; 47: 2911– 2916. [DOI] [PubMed] [Google Scholar]
- 5. Leung CK, Lindsey JD, Crowston JG, Lijia C, Chiang S, Weinreb RN. . Longitudinal profile of retinal ganglion cell damage after optic nerve crush with blue-light confocal scanning laser ophthalmoscopy. Invest Ophthalmol Vis Sci. 2008; 49: 4898– 4902. [DOI] [PMC free article] [PubMed] [Google Scholar]
- 6. Parrilla-Reverter G, Agudo M, Nadal-Nicolás F,et al. . Time-course of the retinal nerve fibre layer degeneration after complete intra-orbital optic nerve transection or crush: a comparative study. Vis Res. 2009; 49: 2808– 2825. [DOI] [PubMed] [Google Scholar]
- 7. Nadal-Nicolas FM, Jimenez-Lopez M, Sobrado-Calvo P,et al. . Brn3a as a marker of retinal ganglion cells: qualitative and quantitative time course studies in naive and optic nerve-injuries retinas. Invest Ophthalmol Vis Sci. 2009; 50: 3860– 3868. [DOI] [PubMed] [Google Scholar]
- 8. Salinas-Navarro M, Alarcon-Martinez L, Valiente-Soriano RJ,et al. . Ocular hypertension impairs optic nerve axonal transport leading to progressive retinal ganglion cell degeneration. Exp Eye Res. 2010; 90: 168– 183. [DOI] [PubMed] [Google Scholar]
- 9. Galindo-Romero C, Aviles-Trigueros M, Jimenez-Lopez M,et al. . Axotomy-induced retinal ganglion cell death in adult mice: quantitative and topographic time course analyses. Exp Eye Res. 2011; 92: 377– 387. [DOI] [PubMed] [Google Scholar]
- 10. Chauhan BC, Stevens KT, Levesque JM,et al. . Longitudinal in vivo imaging of retinal ganglion cells and retinal thickness changes following optic nerve injury in mice. PLoS One. 2012; 7: e40352. [DOI] [PMC free article] [PubMed] [Google Scholar]
- 11. Kalesnykas G, Oglesby EN, Zack DJ,et al. . Retinal ganglion cell morphology after optic nerve crush and experimental glaucoma. Invest Ophthalmol Vis Sci. 2012; 53: 3847– 3857. [DOI] [PMC free article] [PubMed] [Google Scholar]
- 12. Munguba GC, Galeb S, Liu Y,et al. . Nerve fiber layer thinning lags retinal ganglion cell density following crush axonopathy. Invest Ophthalmol Vis Sci. 2014; 55: 6505– 6513. [DOI] [PMC free article] [PubMed] [Google Scholar]
- 13. Liu Y, McDowell CM, Zhang Z, Tebow HE, Wordinger RJ, Clark AF. . Monitoring retinal morphologic and functional changes in mice following optic nerve crush. Invest Ophthalmol Vis Sci. 2014; 55: 3766– 3774. [DOI] [PubMed] [Google Scholar]
- 14. Choe T, Abbott C, Piper C, Wang L, Fortune B, Chidlow G. . Comparison of longitudinal in vivo measurements of retinal nerve fiber layer thickness and retinal ganglion cell density after optic nerve transection in rat. PLoS One. 2014; 9: e113011. [DOI] [PMC free article] [PubMed] [Google Scholar]
- 15. Rovere G, Nadal-Nicolás FM, Agudo-Barriuso M,et al. . Comparison of retinal nerve fiber layer thinning and retinal ganglion cell loss after optic nerve transection in adult albino rats. Invest Ophthalmol Vis Sci. 2015; 56: 4487– 4498. [DOI] [PubMed] [Google Scholar]
- 16. Nadal-Nicolas FM, Sobrado-Calvo P, Jimenez-Lopez M, Vidal-Sanz M, Agudo-Barriuso M. . Long-term effect of optic nerve axotomy on the retinal ganglion cell layer. Invest Ophthalmol Vis Sci. 2015; 56: 6095– 6112. [DOI] [PubMed] [Google Scholar]
- 17. Vidal-Sanz M, Galindo-Romero C, Valiente-Soriano FJ,et al. . Shared and differential retinal responses against optic nerve injury and ocular hypertension. Front Neurosci. 2017; 11: 1– 14. [DOI] [PMC free article] [PubMed] [Google Scholar]
- 18. Quigley HA, Addicks EM, Green WR. . Optic nerve damage in human glaucoma. III. Quantitative correlation of nerve fiber loss and visual field defect in glaucoma, ischemic neuropathy, papilledema, and toxic neuropathy. Arch Ophthalmol. 1982; 100: 135– 146. [DOI] [PubMed] [Google Scholar]
- 19. Sommer A, Katz J, Quigley HA,et al. . Clinically detectable nerve fiber atrophy precedes the onset of glaucomatous field loss. Arch Ophthalmol. 1991; 109: 77– 83. [DOI] [PubMed] [Google Scholar]
- 20. Bowd C, Zangwill LM, Berry CC,et al. . Detecting early glaucoma by assessment of retinal nerve fiber layer thickness and visual function. Invest Ophthalmol Vis Sci. 2001; 42: 1993– 2003. [PubMed] [Google Scholar]
- 21. Ajtony C, Balla Z, Somoskeoy S, Kovacs B. . Relationship between visual field sensitivity and retinal nerve fiber layer thickness as measured by optical coherence tomography. Invest Ophthalmol Vis Sci. 2007; 48: 258– 263. [DOI] [PubMed] [Google Scholar]
- 22. Horn FK, Mardin CY, Laemmer R,et al. . Correlation between local glaucomatous visual field defects and loss of nerve fiber layer thickness measured with polarimetry and spectral domain OCT. Invest Ophthalmol Vis Sci. 2009; 50: 1971– 1977. [DOI] [PubMed] [Google Scholar]
- 23. Wollstein G, Kagemann L, Bilonick RA,et al. . Retinal nerve fibre layer and visual function loss in glaucoma: the tipping point. Br J Ophthalmol. 2012; 96: 47– 52. [DOI] [PMC free article] [PubMed] [Google Scholar]
- 24. Alasil T, Wang K, Yu F,et al. . Correlation of retinal nerve fiber layer thickness and visual fields in glaucoma: a broken stick model. Am J Ophthalmol. 2014; 157: 953– 959. [DOI] [PMC free article] [PubMed] [Google Scholar]
- 25. Huang X-R, Zhou Y, Kong W, Knighton RW. . Reflectance decreases before thickness changes in the retinal nerve fiber layer in glaucomatous retinas. Invest Ophthalmol Vis Sci. 2011; 52: 6737– 6742. [DOI] [PMC free article] [PubMed] [Google Scholar]
- 26. Vermeer KA, van der Schoot J, Lemij HG, de Boer JF. . RPE-normalized RNFL attenuation coefficient maps derived from volumetric OCT imaging for glaucoma assessment. Invest Ophthalmol Vis Sci. 2012; 53: 6102– 6108. [DOI] [PubMed] [Google Scholar]
- 27. van der Schoot J, Vermeer KA, de Boer JF, Lemij HG. . The effect of glaucoma on the optical attenuation coefficient of the retinal nerve fiber layer in spectral domain optical coherence tomography images. Invest Ophthalmol Vis Sci. 2012; 53: 2424– 2430. [DOI] [PubMed] [Google Scholar]
- 28. Dwelle J, Liu S, Wang B,et al. . Thickness, phase retardation, birefringence, and reflectance of the retinal nerve fiber layer in normal and glaucomatous non-human primates. Invest Ophthalmol Vis Sci. 2012; 53: 4380– 4395. [DOI] [PMC free article] [PubMed] [Google Scholar]
- 29. Huang X-R, Knighton RW, Spector YZ, Qiao J, Kong W, Zhao Q. . Reflectance spectrum and birefringence of the retinal nerve fiber layer with hypertensive damage of axonal cytoskeleton. Invest Ophthalmol Vis Sci. 2017; 58: 2118– 2129. [DOI] [PMC free article] [PubMed] [Google Scholar]
- 30. Huang X-R, Zhou Y, Knighton RW, Kong W, Feuer WJ. . Wavelength-dependent change of retinal nerve fiber layer reflectance in glaucomatous retinas. Invest Ophthalmol Vis Sci. 2012; 53: 5869– 5876. [DOI] [PMC free article] [PubMed] [Google Scholar]
- 31. Fortune B, Cull GA, Burgoyne CF. . Relative course of retinal nerve fiber layer (RNFL) birefringence, RNFL thickness and retinal function changes after optic nerve transection. Invest Ophthalmol Vis Sci. 2008; 49: 4444– 4452. [DOI] [PMC free article] [PubMed] [Google Scholar]
- 32. Templeton JP, Geisert EE. . A practical approach to optic nerve crush in the mouse. Mol Vis. 2012; 18: 2147– 2152. [PMC free article] [PubMed] [Google Scholar]
- 33. Knighton RW, Huang X-R. . Visible and near-infrared imaging of the nerve fiber layer of the isolated rat retina. J Glaucoma. 1999; 8: 31– 37. [PubMed] [Google Scholar]
- 34. Knighton RW, Huang X-R. . Directional and spectral reflectance of the rat retinal nerve fiber layer. Invest Ophthalmol Vis Sci. 1999; 40: 639– 647. [PubMed] [Google Scholar]
- 35. Knighton RW, Baverez C, Bhattacharya A. . The directional reflectance of the retinal nerve fiber layer of the toad. Invest Ophthalmol Vis Sci. 1992; 33: 2603– 2611. [PubMed] [Google Scholar]
- 36. Bohren CF, Huffman DR. . Absorption and Scattering of Light by Small Particles. New York: John Wiley & Sons; 1983. [Google Scholar]
- 37. Huang X-R, Knighton RW, Feuer WJ, Qiao J. . Retinal nerve fiber layer reflectometry must consider directional reflectance. Biomed Opt Express. 2016; 7: 22– 33. [DOI] [PMC free article] [PubMed] [Google Scholar]
- 38. Knighton RW, Zhou Q. . The relation between reflectance and thickness of the retinal nerve fiber layer. J Glaucoma. 1995; 4: 117– 123. [PubMed] [Google Scholar]
- 39. Huang X-R, Kong W, Zhou Y, Gregori G. . Distortion of axonal cytoskeleton: an early sign of glaucomatous damage. Invest Ophthalmol Vis Sci. 2011; 52: 2879– 2888. [DOI] [PMC free article] [PubMed] [Google Scholar]
- 40. Knighton RW, Jacobson SG, Kemp CM. . The spectral reflectance of the nerve fiber layer of the macaque retina. Invest Ophthalmol Vis Sci. 1989; 30: 2392– 2402. [PubMed] [Google Scholar]
- 41. Knighton RW, Qian C. . An optical model of the human retinal nerve fiber layer: implications of directional reflectance for variability of clinical measurements. J Glaucoma. 2000; 9: 56– 62. [DOI] [PubMed] [Google Scholar]
- 42. Leung CK, Weinreb RN, Li ZW,et al. . Long-term in vivo imaging and measurement of dendritic shrinkage of retinal ganglion cells. Invest Ophthalmol Vis Sci. 2011; 52: 1539– 1547. [DOI] [PubMed] [Google Scholar]
- 43. Vermeer KA, van der Schoot J, Lemij HG, de Boer JF. . Comparison of RNFL thickness and RPE-normalized RNFL attenuation coefficient for glaucoma diagnosis. Proc SPIE 8567, Ophthalmic Technologies XXIII; 2013: 85671D.
- 44. Zhou Q, Knighton RW. . Light scattering and form birefringence of parallel cylindrical arrays that represent cellular organelles of the retinal nerve fiber layer. Appl Optics. 1997; 36: 2273– 2285. [DOI] [PubMed] [Google Scholar]
- 45. Knighton RW, Huang X-R, Zhou Q. . Microtubule contribution to the reflectance of the retinal nerve fiber layer. Invest Ophthalmol Vis Sci. 1998; 39: 189– 193. [PubMed] [Google Scholar]
- 46. Huang X-R, Knighton RW, Cavuoto LN. . Microtubule contribution to the reflectance of the retinal nerve fiber layer. Invest Ophthalmol Vis Sci. 2006; 47: 5363– 5367. [DOI] [PubMed] [Google Scholar]
- 47. Fortune B, Wang L, Cull G, Cioffi GA. . Intravitreal colchicine causes decreased RNFL birefringence without altering RNFL thickness. Invest Ophthalmol Vis Sci. 2008; 49: 255– 261. [DOI] [PubMed] [Google Scholar]
- 48. Quigley HA, Addicks EM, Green WR, Maumenee AE. . Optic nerve damage in human glaucoma. II. The site of injury and susceptibility to damage. Arch Ophthalmol. 1981; 99: 635– 649. [DOI] [PubMed] [Google Scholar]
- 49. Glovinsky Y, Quigley HA, Dunkelberger GR. . Retinal ganglion cell loss is size dependent in experimental glaucoma. Invest Ophthalmol Vis Sci. 1991; 32: 484– 491. [PubMed] [Google Scholar]
- 50. Quigley HA, Nickells RW, Kerrigan LA, Pease ME, Thibault DJ, Zack DJ. . Retinal ganglion cell death in experimental glaucoma and after axotomy occurs by apoptosis. Invest Ophthalmol Vis Sci. 1995; 36: 774– 786. [PubMed] [Google Scholar]
- 51. Shou T, Liu J, Wang W, Zhou Y, Zhao K. . Differential dendritic shrinkage of alpha and beta retinal ganglion cells in cats with chronic glaucoma. Invest Ophthalmol Vis Sci. 2003; 44: 3005– 3010. [DOI] [PubMed] [Google Scholar]
- 52. Fu CT, Sretavan D. . Laser-induced ocular hypertension in albino CD-1 mice. Invest Ophthalmol Vis Sci. 2010; 51: 980– 990. [DOI] [PMC free article] [PubMed] [Google Scholar]
- 53. Agapova OA, Kaufman PL, Lucarelli MJ, Gabelt BT, Hernandez MR. . Differential expression of matrix metalloproteinases in monkey eyes with experimental glaucoma or optic nerve transection. Brain Res. 2003; 967: 132– 143. [DOI] [PubMed] [Google Scholar]
- 54. Yang Z, Quigley HA, Pease ME,et al. . Changes in gene expression in experimental glaucoma and optic nerve transection: the equilibrium between protective and detrimental mechanisms. Invest Ophthalmol Vis Sci. 2007; 48: 5539– 5548. [DOI] [PubMed] [Google Scholar]
- 55. Macharadze T, Goldschmidt J, Marunde M,et al. . Interretinal transduction of injury signals after unilateral optic nerve crush. Neuroreport. 2009; 20: 301– 305. [DOI] [PubMed] [Google Scholar]
- 56. Qu J, Jakobs TC. . The time course of gene expression during reactive gliosis in the optic nerve. PLoS One. 2013; 8: e67094. [DOI] [PMC free article] [PubMed] [Google Scholar]
- 57. Bodeutsch N, Siebert H, Dermon C, Thanos S. . Unilateral injury to the adult rat optic nerve causes multiple cellular responses in the contralateral site. J Neurobiol. 1999; 38: 116– 128. [DOI] [PubMed] [Google Scholar]
- 58. Salvador-Silva M, Vidal-Sanz M, Villegas-Perez MP. . Microglial cells in the retina of Carassius auratus: effects of optic nerve crush. J Comp Neurol. 2000; 417: 431– 447. [DOI] [PubMed] [Google Scholar]
- 59. Panagis L, Thanos S, Fischer D, Dermon CR. . Unilateral optic nerve crush induces bilateral retinal glial cell proliferation. Eur J Neurosci. 2005; 21: 2305– 2309. [DOI] [PubMed] [Google Scholar]
- 60. Ramirez AI, Salazar JJ, de Hoz R,et al. . Quantification of the effect of different levels of IOP in the astroglia of the rat retina ipsilateral and contralateral to experimental glaucoma. Invest Ophthalmol Vis Sci. 2010; 51: 5690– 5696. [DOI] [PubMed] [Google Scholar]
- 61. Gallego BI, Salazar JJ, de Hoz R,et al. . IOP induces upregulation of GFAP and MHC-II and microglia reactivity in mice retina contralateral to experimental glaucoma. J Neuroinflammation. 2012; 9: 92. [DOI] [PMC free article] [PubMed] [Google Scholar]
- 62. Galindo-Romero C, Valiente-Soriano FJ, Jimenez-Lopez M,et al. . Effect of brain-derived neurotrophic factor on mouse axotomized retinal ganglion cells and phagocytic microglia. Invest Ophthalmol Vis Sci. 2013; 54: 974– 985. [DOI] [PubMed] [Google Scholar]
- 63. Rojas B, Gallego BI, Ramirez AI,et al. . Microglia in mouse retina contralateral to experimental glaucoma exhibit multiple signs of activation in all retinal layers. J Neuroinflammation. 2014; 11: 133. [DOI] [PMC free article] [PubMed] [Google Scholar]
- 64. Cen LP, Han M, Zhou L,et al. . Bilateral retinal microglial response to unilateral optic nerve transection in rats. Neuroscience. 2015; 311: 56– 66. [DOI] [PubMed] [Google Scholar]
- 65. Sobrado-Calvo P, Vidal-Sanz M, Villegas-Pérez MP. . Rat retinal microglial cells under normal conditions, after optic nerve section, and after optic nerve section and intravitreal injection of trophic factors or macrophage inhibitory factor. J Comp Neurol. 2007; 501: 866– 878. [DOI] [PubMed] [Google Scholar]
- 66. Ma W, Cojocaru R, Gotoh N,et al. . Gene expression changes in aging retinal microglia: relationship to microglial support functions and regulation of activation. Neurobiol Aging. 2013; 34: 2310– 2321. [DOI] [PMC free article] [PubMed] [Google Scholar]
- 67. Wang X, Zhao L, Zhang J,et al. . Requirement for microglia for the maintenance of synaptic function and integrity in the mature retina. J Neurosci. 2016; 36: 2827– 2842. [DOI] [PMC free article] [PubMed] [Google Scholar]
- 68. Muller M, Hollander H. . A small population of retinal ganglion cells projecting to the retina of the other eye. An experimental study in the rat and the rabbit. Exp Brain Res. 1988; 71: 611– 617. [DOI] [PubMed] [Google Scholar]
- 69. Nadal-Nicolas FM, Valiente-Soriano FJ, Salinas-Navarro M, Jimenez-Lopez M, Vidal-Sanz M, Agudo-Barriuso M. . Retino-retinal projection in juvenile and young adult rats and mice. Exp Eye Res. 2015; 134: 47– 52. [DOI] [PubMed] [Google Scholar]
- 70. Avellaneda-Chevrier VK, Wang X, Hooper ML, Chauhan BC. . The retino-retinal projection: tracing retinal ganglion cells projecting to the contralateral retina. Neurosci Lett. 2015; 591: 105– 109. [DOI] [PubMed] [Google Scholar]
- 71. Nadal-Nicolas FM, Vidal-Sanz M, Agudo-Barriuso M. . The aging rat retina: from function to anatomy. Neurobiol Aging. 2018; 61: 146– 168. [DOI] [PubMed] [Google Scholar]


