
Figure 17.
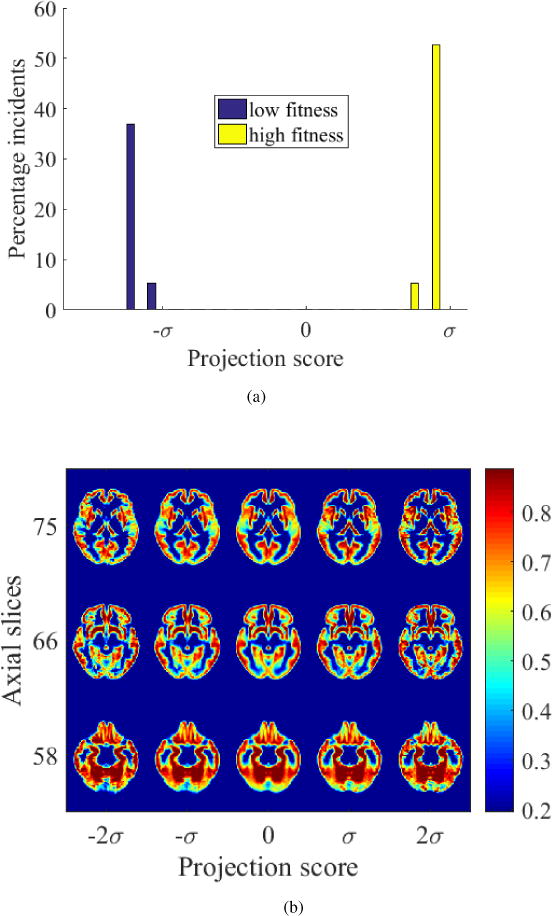
(a) High-fit and low-fit individuals can be perfectly separated based on transport maps of gray matter when projected onto the most discriminant direction computed by PLDA, (b) modulated images generated by TBM depicting the gray matter differences between high-fit and low-fit individuals showing loss of tissue from temporal lobe in slice 75 with low fitness.