Abstract
Purpose
To develop an accurate T1 measurement method for short T2 tissues using a combination of a three-dimensional ultrashort echo time Cones actual flip angle imaging technique and a variable repetition time technique (3D UTE-Cones AFI-VTR) on a clinical 3T scanner.
Methods
First, the longitudinal magnetization mapping function of the excitation pulse was obtained with the 3D UTE-Cones AFI method, which provided information about excitation efficiency and B1 inhomogeneity. Then, the derived mapping function was substituted into the VTR fitting to generate accurate T1 maps. Numerical simulation and phantom studies were carried out to compare the AFI-VTR method with a B1-uncorrected VTR method, a B1-uncorrected variable flip angle (VFA) method, and a B1-corrected VFA method. Finally, the 3D UTE-Cones AFI-VTR method was applied to bovine bone samples (n=6) and healthy volunteers (n=3) to quantify the T1 of cortical bone.
Results
Numerical simulation and phantom studies showed that the 3D UTE-Cones AFI-VTR technique provides more accurate measurement of the T1 of short T2 tissues than the B1-uncorrected VTR and VFA methods or the B1-corrected VFA method. The proposed 3D UTE-Cones AFI-VTR method showed a mean T1 of 240±25 ms for bovine cortical bone and 218±10 ms for the tibial midshaft of human volunteers, respectively, at 3T.
Conclusion
The 3D UTE-Cones AFI-VTR method can provide accurate T1 measurements of short T2 tissues such as cortical bone.
Keywords: ultrashort echo time, actual flip angle imaging, variable TR, cortical bone
INTRODUCTION
Variable flip angle (VFA) and variable repetition time (VTR) methods based on three-dimensional spoiled gradient recalled echo (3D SPGR) sequences have been widely used for volumetric T1 measurement (1–5). However, both the VFA and VTR methods are very sensitive to inhomogeneity in the transmitted B1 field. As a result, the first step for accurate T1 measurement usually requires obtaining spatial B1 field maps (6–15). These are then used for accurate T1 calculation (16–21).
The Actual Flip angle Imaging (AFI) technique has been proposed for fast 3D B1 mapping (15). It utilizes interleaved acquisitions of dual-TR steady state signals that are formed by alternately changing the TR of a conventional SPGR sequence. The robustness of the AFI technique has been demonstrated for mapping the B1 of long T2 tissues of the human body (15, 20, 21). However, the typical AFI sequence cannot be used for mapping the B1 of short T2 tissues, such as cortical bone, calcified cartilage, menisci, ligaments, tendons, etc. (18, 19). This is because these tissues have short T2 values ranging from several hundred of microseconds to a few milliseconds, and show little or no signal when imaged with conventional SPGR sequences which have TEs of several milliseconds. Ultrashort echo time (UTE) sequences with TEs less than 100 μs have been developed for imaging of short T2 tissues, and produce detectable signals (4, 22, 23). Combination of the UTE and AFI techniques (UTE-AFI) would therefore appear to be an appropriate way to map flip angles for short T2 tissues (18, 19).
However, there are technical challenges in accurately mapping flip angles when imaging short T2 tissues such as cortical bone because of transverse relaxation during the radio frequency (RF) excitation pulse. This is typically ignored for long T2 tissues, but becomes significant when imaging short T2 tissues. Large flip angles (>40°) are typically required to make the AFI technique sensitive (15, 18). With conventional peak power limitations on the RF amplifiers of clinical scanners, the RF pulse duration must be increased in order to produce such large flip angle excitations. However, excitation efficiency is decreased when imaging short T2 tissues with longer RF excitation pulses due to transverse relaxation during the pulse and this leads to actual flip angles that are lower than the nominal flip angles (i.e. the expected flip angles) (23–26). This causes B1 estimation errors when the UTE-AFI method is used for imaging short T2 tissues (as detailed in the Theory section below). It can result in inaccurate T1 values for short T2 tissues.
To overcome this problem, we propose a new T1 measurement method for short T2 tissues which combines a 3D UTE-Cones AFI technique with a 3D UTE-Cones VTR technique (3D UTE-Cones AFI-VTR). In this method, the same RF pulses and flip angles are used for signal excitation in the AFI and VTR sequences. As a result, B1 maps are no longer required for T1 correction. Instead, the longitudinal magnetization mapping function of the RF excitation pulse is obtained by the 3D UTE-Cones AFI method, and this is subsequently used for VTR-based T1 fitting. Simulation, phantom, and in vivo studies were used to investigate the accuracy of the proposed method for measuring the T1 of cortical bone, utilizing parameters appropriate for a clinical 3T scanner.
THEORY
Features of the conventional 3D UTE-Cones pulse sequence with a single TR (Figure 1A) have been described before (27–29). AFI can be achieved with the 3D dual TR UTE-Cones sequence (Figure 1B). A series of conventional 3D UTE-Cones sequences with variable TRs or variable flip angles can then be used for T1 measurement. For both the UTE-Cones AFI and the UTE-Cones VTR/VFA sequences, a short rectangular pulse (e.g. 150 μs) was used for non-selective signal excitation (Figure 1C). This was followed by a spiral trajectory data acquisition with conical view ordering (Figure 1D).
Figure 1.
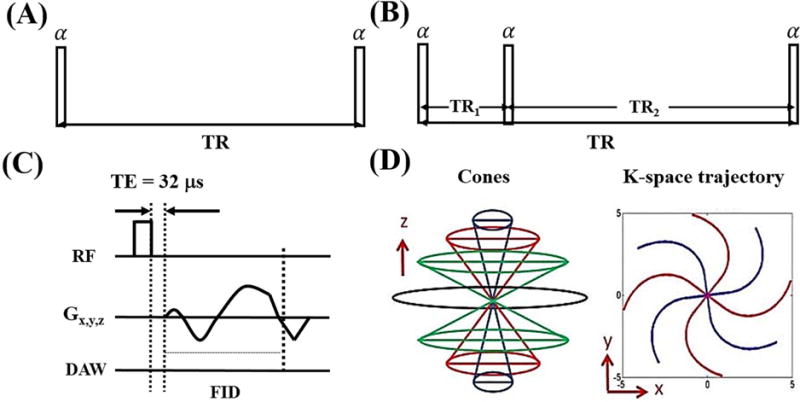
The conventional 3D UTE-Cones sequence with a single TR is used for T1 measurement with the variable flip angle (VFA) or variable TR (VTR) method (A). The 3D UTE-Cones actual flip angle imaging (AFI) sequence employs a pair of interleaved TRs for accurate B1 mapping (B), which together with a VFA or VTR method provides T1 measurements. In these two UTE-Cones sequences, a short rectangular pulse is used for signal excitation followed by 3D spiral sampling with a very short TE of 32 μs (C). The spiral trajectories are arranged with conical view ordering (D).
The steady state signals acquired in TR1 and TR2 of the 3D UTE-Cones AFI sequence can be expressed as follows (15, 25):
| [1] |
| [2] |
with
| , |
| . |
is the equilibrium magnetization. and are the respective transverse and longitudinal magnetization mapping functions generated by the RF pulse, with and . is the longitudinal magnetization before RF excitation. and are the transverse and longitudinal magnetizations after the RF excitation. is the flip angle and is the duration of the rectangular excitation pulse. Since the RF pulse duration is much shorter than the tissue T1, T1 relaxation during the excitation can be neglected in the mapping functions.
For short T2 tissues with T2 values of the same order as the RF duration , and are determined not only by , but also by and the tissue . Analytical expressions of these two terms can be described as follows (24):
| [3] |
| [4] |
For long T2 tissues with T2s >> , and simplify to sin( ) and cos( ), respectively. Eqs. [1] and [2] then become identical to the conventional expression for AFI in Eq. [3] as shown in Ref. 30.
The general AFI method relies on two fundamental assumptions: (i) that complete spoiling of the transverse magnetization occurs during TR1 and TR2, and (ii) that TR1s and TR2s are short compared to T1. Perfect spoiling during each TR is very difficult to achieve since high flip angles and relatively short TRs are used in AFI (15). Yarnykh has suggested the use of an optimized combination of RF spoiling with an extremely strong gradient crusher pair to provide additional spoiling (17). However, in this study the heavy gradient spoiler and phase cycling to provide RF spoiling may not be necessary for complete spoiling due to the fast decay of the transverse magnetization of short T2 tissues. With TRs that are short relative to T1, the signal ratio r of and can be simplified using a first-order approximation for the exponential terms such that (15):
| [5] |
where n = TR2/TR1. The ratio r can then be used as a T1-independent measure of :
| [6] |
For long T2 tissues, becomes cos( ). So the actual flip angle can be estimated with the following equation (15):
| [7] |
Then, the B1 scaling factor (B1s) is obtained by dividing the measured by the nominal flip angle , which is expressed as follows:
| [8] |
B1s is used to quantify the RF inhomogeneity. B1s = 1 corresponds to an unaltered RF field.
For short T2 tissues, the measurement of or B1s is more complicated. With knowledge of the RF pulse duration and tissue T2, can be calculated from the analytical expression for or through Bloch equation simulation. However, it is very challenging to measure short T2 values using the traditional spin echo (SE) or Carr-Purcell-Meiboom-Gill (CPMG) method due to the rapid tissue signal decay as well as the limited RF peak power and gradient strength available on clinical MR scanners. Furthermore, these methods may require extra sequences to measure short T2 values, which subsequently suffer from errors caused by magnetization transfer (when the 2D multi-slice SE or the CPMG sequence is used to measure T2), potential motion artifacts associated with the increased scan time and limited signal to noise ratio (SNR) when imaging short T2 tissues. To cope with these issues, we propose a new approach which avoids the calculation of required in standard approaches. The value of is used directly as input for T1 calculation under the VTR method. The description of our method follows.
The 3D UTE-Cones sequence is a free induction decay (FID) sequence characterized by an ultrashort echo time (TE = 32 μs) and a 3D non-Cartesian center-out k-space encoding scheme. The detected magnetization Sspgr follows the same steady state behavior as the signal acquired with a SPGR sequence and is expressed as follows (25, 30):
| [9] |
with
is the repetition time of the UTE-Cones sequence. and are the RF pulse induced transverse and longitudinal mapping functions, respectively. Analogous to and in Eqs. [1] and [2]. and become sin( ) and cos( ) for long T2 tissues.
Fitting of Eq. [9] can be used for T1 quantification of short T2 tissues from VTR or VFA UTE-Cones data. For long T2 tissues, VTR and VFA data are processed with the actual flip angles, which can be calculated by applying the B1 scaling factor B1s to the nominal flip angles. Since it is complicated to measure B1s for short T2 tissues, we propose a new T1 measurement technique which combines the UTE-AFI method and the UTE VTR method, and employs identical RF excitation pulses. As a result, in Eq. [9] is identical to in Eq. [6]. In the T1 fitting procedure with the VTR method, the coefficients and in Eq. [9] can be combined into a single unknown parameter (e.g., g), since and are both not functions of TR. After the measured from Eq. [6] is substituted into Eq. [9], there are only two unknown parameters including g and T1. Therefore, robust T1 measurements can be achieved by fitting the data with variable TRs.
MATERIALS AND METHODS
In our study, the 3D UTE-Cones AFI and conventional UTE-Cones sequences (see Figure 1) were implemented on a 3T Signa TwinSpeed scanner (GE Healthcare Technologies, Milwaukee, WI). An 8-channel transmit/receive knee coil was used for both RF transmission and signal reception. The sequences used unique k-space trajectories that sampled data along evenly spaced twisted paths in the form of multiple cones (27–29). Data sampling began from the center of k-space and continued outwards. It began as soon as practical after the RF excitation with a minimal nominal delay time of 32 μs. Both RF and gradient spoiling were used to crush the remaining transverse magnetizations. In 3D UTE-Cones AFI, the areas of gradient crushers in TR1 and TR2 were 180 and 900 mT·ms/m respectively, and the RF phase increment was (17). In 3D VTR or VFA UTE-Cones, the area of the gradient crushers was 180 mT·ms/m and the RF phase increment was (17). The 3D UTE-Cones sequence allowed anisotropic resolution (e.g., high in-plane resolution and thicker slices) to provide an improved SNR and a reduced scan time relative to isotropic imaging (28, 29).
Simulation
Numerical simulation was performed to investigate the accuracy of the proposed T1 measurement for short T2 tissues. Identical simulated rectangular RF pulses were used for signal excitation in both the 3D UTE-Cones AFI and VTR sequences and had durations from 0.1 to 500 μs. T2 values of simulated short T2 tissues ranged from 0 to 1 ms. The T1 value was set to 500 ms. The sequence parameters for the 3D UTE-Cones AFI and VTR sequences were adjusted as follows: 1) 3D UTE-Cones AFI: TR1/TR2 = 20/100 ms and flip angle = 45°; 2) VTR UTE-Cones: TR = 10, 50, 100, 150, and 200 ms, and flip angle = 45°. For comparison, the VFA UTE-Cones sequence was also used for T1 measurement with the following sequence parameters: TR = 20 ms and flip angles = 7°, 14°, 22°, 30°, and 38° (31). Three simulated nominal B1 scaling factors (B1n) were used and set to values of 0.8, 1, and 1.2.
Phantom and Sample Study
An agarose phantom was prepared by adding 3.0 g agarose powder and 7.2 mg MnCl2·4H2O to 400 ml distilled water. The mixture was brought to a boil in a microwave oven and then cooled in a refrigerator, allowing the solution to gel. The T2 value of the agarose phantom was approximately 80 ms. This was designed to simulate long T2 tissue. Another agarose phantom was prepared by mixing 300 ml distilled water with the same concentrations of agarose and MnCl2 as in the previous phantom. After bringing the solution to a boil, the solution was cooled to 40°, and a fresh bovine cortical bone section which had been stripped of soft tissue was suspended within it. The phantom was then allowed to cool until the agarose gelled with the suspended bone section immobilized within it. In addition, five fresh bovine cortical bone sections were stripped of soft tissue and submerged in Fomblin (perfluoropolyether) within a cylindrical container of suitable size for MR scanning. These phantoms were scanned with the 3D UTE-Cones AFI, VTR, and VFA sequences and the sequence parameters can be found in “Phantom” section in Table 1.
Table 1.
Sequence parameters of phantom, bovine cortical bone sample and in vivo tibial cortical bone studies.
| 3D UTE-Cones AFI | 3D UTE-Cones VTR | 3D UTE-Cones VFA | |
|---|---|---|---|
|
|
|||
| Phantom | FOV = 15×15×12.8 cm3, Matrix = 128×128×32, TR1/TR2 = 20/100 ms, flip angle = 45°, bandwidth = 125 kHz, scan time = 8 min 55 sec |
FOV = 15×15×12.8 cm3, Matrix = 128×128×32, TR = 20, 40, 60, 80 and 120 ms, flip angle = 45°, bandwidth = 125 kHz, total scan time = 21 min 20 sec |
FOV = 15×15×12.8 cm3, Matrix = 128×128×32, TR = 24 ms, flip angle = 8°, 26° and 45°, bandwidth = 125 kHz, total scan time = 5 min 21 sec |
|
| |||
| Bovine cortical bone | 3D UTE-Cones AFI | 3D UTE-Cones VTR | |
|
| |||
| FOV = 15×15×6.4 cm3, Matrix = 128×128×16, TR1/TR2 = 20/100 ms, flip angle = 45°, bandwidth = 125 kHz, scan time = 4 min 40 sec |
FOV = 15×15×6.4 cm3, Matrix = 128×128×16, TR = 15, 30, 50 and 80 ms, bandwidth = 125 kHz, total scan time = 6 min 41 sec |
||
|
| |||
| In vivo tibial cortical bone | 3D UTE-Cones AFI | 3D UTE-Cones VTR | |
|
| |||
| FOV = 15×15×16.8 cm3, Matrix = 128×128×24, TR1/TR2 = 20/100 ms, flip angle = 45°, bandwidth = 250 kHz, scan time = 7 min 5 sec |
FOV = 15×15×16.8 cm3, Matrix = 160×160×24, TR = 15, 30, 50, and 80 ms, flip angle = 45°, bandwidth = 250 kHz, total scan time = 12 min 24 sec |
||
A bovine cortical bone sample was used to compare the two VTR T1 measurement techniques using two different excitation flip angles of 20° and 45° with RF pulse durations of 60 μs and 150 μs, respectively. The power of the RF pulses was near to the maximum available on the clinical scanner. The UTE-Cones AFI method was used to obtain the mapping function magnetization, , which was subsequently used to correct T1 measurement errors induced by both B1 inhomogeneity and loss of magnetization during the 45° excitation pulse. The 20° pulse with a duration of 60 μs was more effective than the 45° pulse in generating transverse magnetization for materials with short T2s since the pulse duration was much shorter than the typical T2* value for bovine cortical bone, which is approximately 300 μs (4). The error in T1 measurement with a 20° pulse was expected to come mainly from B1 inhomogeneity. Other sequence parameters can be found in “Bovine cortical bone” section in Table 1.
Another bovine cortical bone sample was used to investigate the T1 measurement accuracy of the proposed 3D UTE-Cones AFI-VTR method using three different RF pulse durations of 150 μs, 200 μs, and 300 μs with the same flip angle of 45°. Identical excitation pulses were used for the UTE-Cones AFI and VTR sequences. The AFI and VTR sequences were each scanned three times using the RF excitation pulses of different duration mentioned above. Other sequence parameters were identical to the above bovine cortical bone study.
In Vivo Study
The 3D UTE-Cones AFI-VTR method was tested in vivo on three healthy male volunteers (ages 29, 35, and 40 yr). Informed consent was obtained from all subjects in accordance with local Institutional Review Board guidelines. Sequence parameters can be found in “In vivo tibial cortical bone” section in Table 1. A higher bandwidth was used for in vivo imaging of cortical bone to minimize chemical shift artifacts from bone marrow fat, which are manifest as ring shaped artifacts with 3D UTE-Cones imaging. Other
Data Analysis
The Levenberg-Marquardt algorithm in Matlab (The MathWorks Inc., Natick, MA, USA) was used to solve the non-linear fitting of Eq. [9] for both VTR and VFA methods. The analysis algorithms written in Matlab were applied to the DICOM images obtained from the 3D UTE-Cones AFI and VTR/VFA UTE-Cones protocols described above. After each fitting calculation, B1s scaling factor and T1 maps were generated. The mean value and standard deviation of T1 for both in vitro bovine cortical bone (n = 6) and in vivo human tibial midshaft cortical bone (n = 3) were also calculated.
RESULTS
Figure 2 shows the simulation results. The top two rows show the theoretical longitudinal ( ) and transverse ( ) magnetizations generated by the rectangular RF pulses with variable durations for a variety of short T2s. In actual scanning, and observed magnetizations correspond to and , which were obtained using Eqs. [3] and [4]. From the color maps (Figure 2), it can be seen that longer RF pulses are less effective than shorter pulses in generating Mxy for shorter T2 tissue components. As expected, more is generated when the excitation pulse power is increased, i.e. when the nominal B1 scaling factor B1n is increased from 0.8 to 1.2. The bottom two rows in Figure 2 provide the estimated B1 scaling factors B1s and computed using the AFI method with Eqs. [8] and [6]. The measured B1 scaling factors B1s are more accurate when using shorter RF pulses and when imaging longer T2 species. Otherwise, the estimated B1 scaling factors B1s are smaller than the nominal values. The calculated values of were nearly identical to the theoretical values of (i.e. shown in the first row), which demonstrates the accuracy of Eq. [6].
Figure 2.
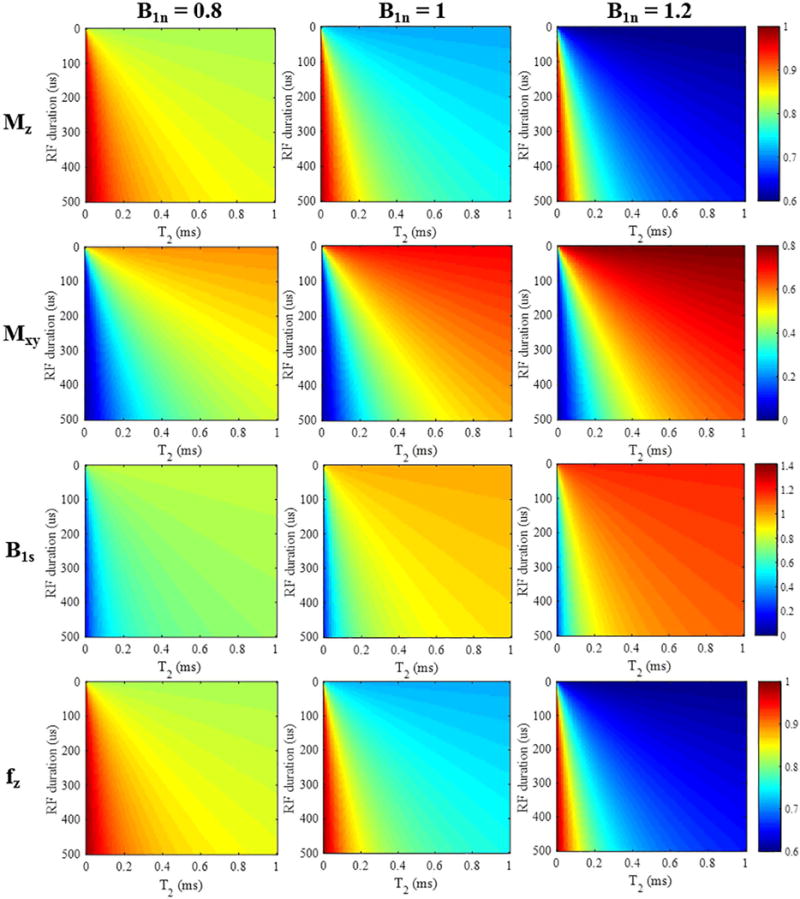
Simulation results for short T2 tissues (T2s from 0 to 1 ms) with a rectangular RF pulse excitation (durations from 0.1 to 500 μs). The top two rows show color maps corresponding to the longitudinal and transverse magnetizations (i.e. and ) calculated from Eqs. [3] and [4]. The third row shows the resulting B1s scaling factors, and the bottom row shows the mapping function obtained by the AFI method. The columns represent simulation results with nominal B1 scaling factors B1n of 0.8, 1, and 1.2, respectively.
Figure 3 presents the simulation results of T1 measurements using both VFA and VTR methods, with and without AFI correction. As seen in the bottom left corners of all images in the first and third rows, T1s from B1-uncorrected VFA and VTR methods are both subject to underestimation caused by the imperfect excitation when employing a longer RF pulse or when imaging shorter T2 species. Additionally, the estimated T1 values increase with larger values of the nominal B1 scaling factor B1n. The second row presents the VFA results using the conventional B1 correction method (appropriate for long T2 tissues). The calculated B1s maps used for correction are displayed in the third row of Figure 3. Overall, the B1-corrected VFA method is more accurate than the B1-uncorrected VFA method. However, T1 estimation errors still exist – especially for tissues with T2s shorter than 0.5 ms, and the errors become larger with increased B1 inhomogeneity. In contrast, the proposed AFI-VTR T1 measurements presented in the last row are nearly accurate for all short T2s, independent of the duration of the excitation pulses. Additionally, identical T1 values are obtained with different values of the nominal B1 scaling factor B1n. The proposed AFI-VTR T1 measurement method can eliminate errors induced by B1 inhomogeneity, and is also immune to the imperfect signal excitation encountered with short T2 species.
Figure 3.
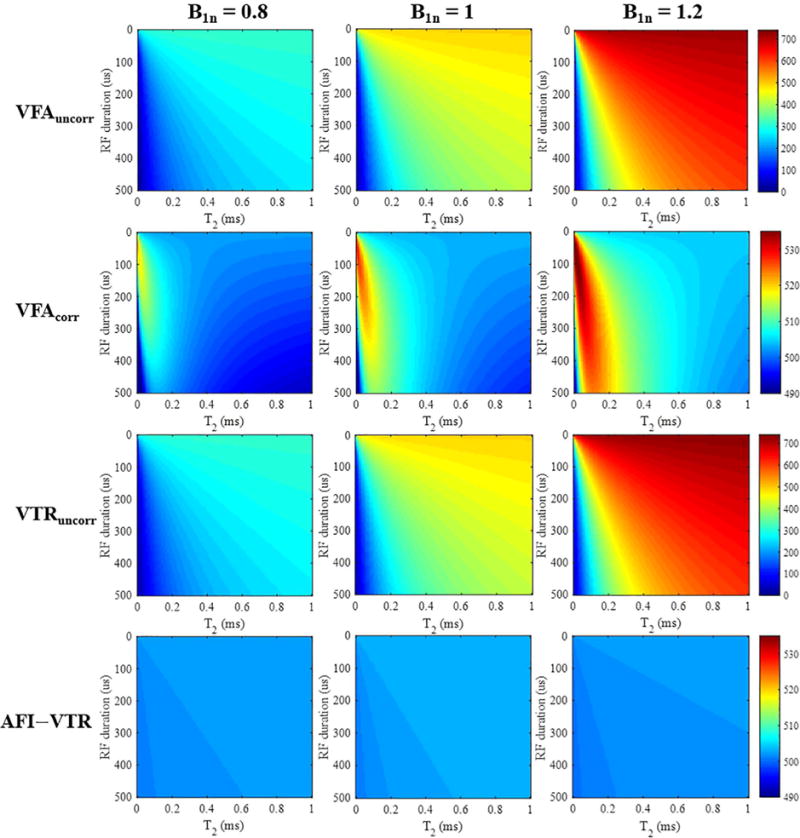
T1 mapping results (units of ms) generated by the VFA method without (1st row) and with B1 correction (2nd row), as well as results using the VTR method without (3rd row) and with B1 correction (4th row). The columns show simulation results with nominal B1 scaling factors B1n of 0.8, 1, and 1.2, respectively. The AFI-VTR method provides the most consistent T1 values over the range of short T2 tissues (T2s from 0 to 1 ms).
Figure 4 shows the phantom results obtained using the UTE-Cones AFI method. A smooth continuous spatial distribution is observed in the agarose phantom maps, corresponding to the measured B1 inhomogeneity (calculated from Eqs. [7] and [8]) and distribution (calculated from Eq. [6]). High flip angles tend to appear in the central region of the knee coil. Similar results are seen in the pure agarose region of the agarose bone phantom. There are clear sharp boundaries between the bone and agarose regions in both the B1s and maps. The measured B1s values in the bone region are lower than those in the agarose region due to inefficient excitation of cortical bone with its extremely short T2. The experimental results agree well with the simulation results presented in Figure 2. The sharp discontinuities in the B1s map suggest that the B1 measurement is inaccurate for cortical bone, whereas the values in the bone region are reasonable and are consistent.
Figure 4.
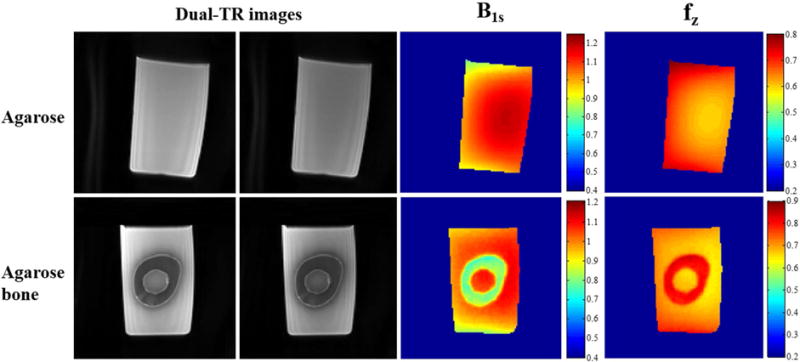
Phantom results using the 3D UTE-Cones-AFI technique and an 8-channel knee coil. The first two columns show dual-TR UTE-Cones images (left: first TR images; right: second TR images) of an agarose phantom and an agarose bone phantom, who’s B1s and maps are shown in right two columns, respectively. As can be seen from the results of agarose phantom, higher B1s is observed in the center area of the knee coil. However, the bone region in the agarose bone B1s map shows a much reduced B1s values due to inefficient excitation of the short T2 tissue.
Figure 5 demonstrates the effect of short tissue T2s on the T1 map calculation. Panels 5A and 5B are regions of interest (ROIs) extracted from Figures 4E and 4F which show the spatial distribution of B1s and . B1 inhomogeneity and excitation inefficiency lead to complicated distributions in the bone region of the agarose-suspended bone phantom. The VFA T1 map in the bone region still suffers from signal inhomogeneity even with B1 correction. The bone T1 map measured with the proposed UTE-Cones AFI-VTR method is far more uniform than the T1 map measured with the B1-corrected VFA method or the B1-uncorrected VTR method. For the long T2 agarose phantom, the T1 map obtained with the UTE-Cones AFI-VTR method was much more uniform than the T1 map measured with the B1-uncorrected VTR method. These results demonstrate that the proposed UTE-Cones AFI-VTR method can obtain consistent T1 measurements for both short and long T2 tissues.
Figure 5.
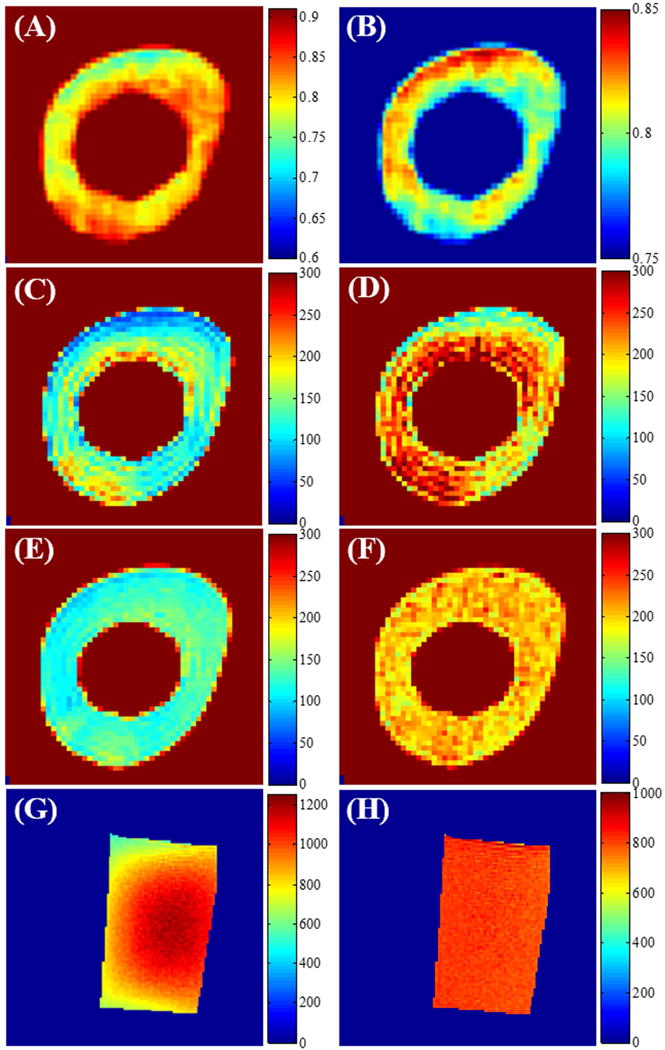
Phantom T1 related maps using 3D UTE-Cones VFA and VTR based methods. Cropped B1s and maps from the bone region of the agarose bone phantom are shown in Panels A and B (these agarose bone phantom maps are also shown in Figs. 4G and 4H with different scaling). Panels C through F are bone T1 maps (units of ms) obtained using VFA without B1 correction (C), VFA with B1 correction (D), VTR without B1 correction (E) and the proposed AFI-VTR method (F). The bottom row shows the T1 maps of the agarose phantom corresponding to B1s and maps of the agarose phantom shown in Figs. 4A-D, without B1 correction (G), and with B1 correction (H). The maps are most uniform in (F) and (H) when the AFI-VTR method is used.
Figure 6 shows the effect of RF pulse duration on bovine cortical bone T1 measurement using the regular VTR and AFI-VTR methods. The bovine cortical bone T1 measurements were obtained from the UTE-Cones VTR method with an excitation pulse of 45° and duration of 150 μs (6E and 6F), and with an excitation pulse of 20° and duration of 60 μs (6G) (5). As shown in Figures 6E and 6G, the T1 map measured with the conventional B1-uncorrected VTR method shows a higher average T1 value when using a shorter excitation pulse (60 μs vs 150 μs) because of its higher excitation efficiency. Figure 6F is the same T1 measurement as Figure 6E, but displayed with a narrower color bar range for better comparison with Figure 6G. The same color distribution can be found in Figures 6F and 6G, which suggests that they were subject to the same B1 inhomogeneity modulation. These results demonstrate that T1 measurements using a longer RF pulse with a lower excitation efficiency underestimate T1 values without affecting the B1 inhomogeneity modulation. Figure 6H shows the T1 map measured with the proposed UTE-Cones AFI-VTR method, which is more uniform than that shown in Figure 6G, demonstrating that the proposed UTE-Cones AFI-VTR T1 measurement method can correct for the effect of both B1 inhomogeneity and excitation inefficiency.
Figure 6.
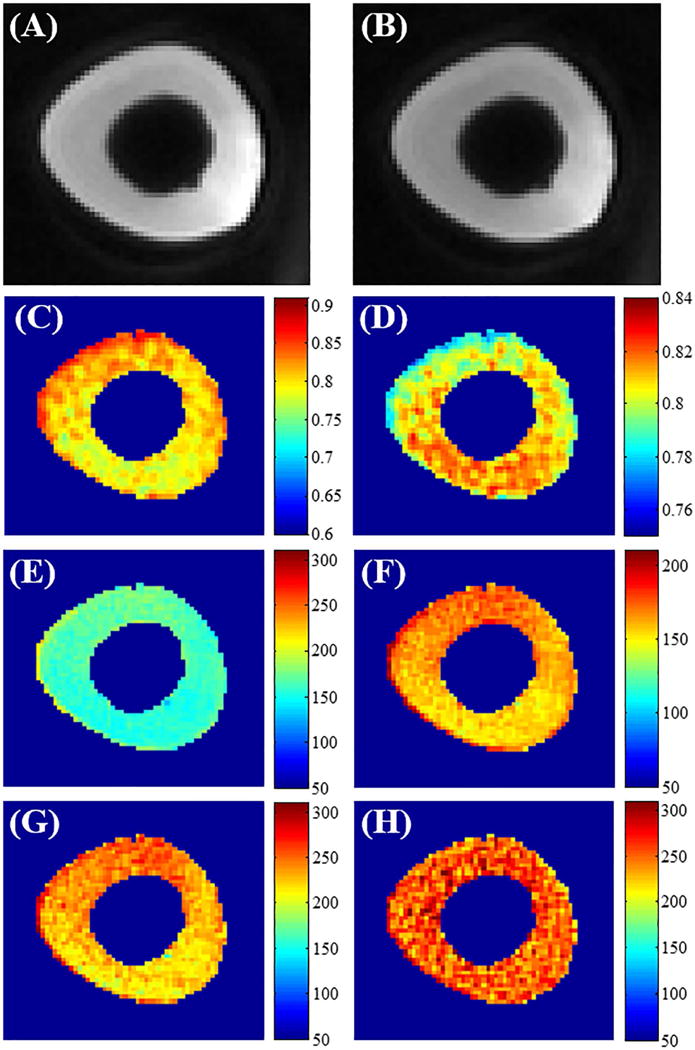
The effect of RF pulse duration on bovine cortical bone T1 measurement using the VTR method. A longer rectangular RF pulse duration of 150 μs with a flip angle of 45° was used in panels A to F. Panels A and B are cropped sections from the 3D UTE-Cones AFI images with a TR of 20 ms (A) and a TR of 100 ms (B). The B1s map (C) and the map (D) were calculated from these dual TR images. Panels E and F show the T1 maps obtained using the regular VTR method. The panels display a different color range. Panel G shows the T1 map generated with the regular VTR method using a shorter RF pulse of 60 μs and flip angle of 20°. This shows increased T1 values relative to E but a similar T1 spatial distribution similar to F. Panel H is the T1 map obtained by the 3D UTE-Cones AFI-VTR method. This shows a much more homogeneous T1 distribution.
Figure 7 further demonstrates the robustness of the proposed UTE-Cones AFI-VTR method for T1 measurement of bovine cortical bone using rectangular RF excitation pulses with three different durations of 150, 200 and 300 μs. The mapping values increases with longer RF duration, which is consistent with the simulation results in Figure 2. However, the measured T1 maps are almost identical showing that the UTE-Cones AFI-VTR method can provide accurate T1 measurement of short T2 tissues with different excitation pulse durations.
Figure 7.
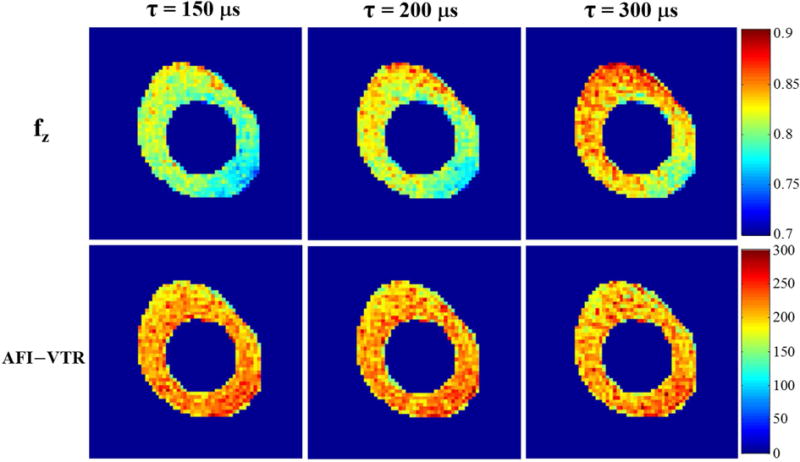
Effect of RF pulse durations ( = 150, 200 and 300 μs) with the same flip angle of 45° on bovine cortical bone T1 maps using the proposed 3D UTE-Cones AFI-VTR method. The first row shows maps generated with the 3D UTE-Cones AFI method. The second row shows the 3D UTE-Cones AFI-VTR T1 maps. These maps are uniform and consistent across each of the three RF pulse durations.
Figure 8 shows in vivo T1 mapping of the tibial midshaft in a healthy volunteer. The VTR T1 map without correction shows lower T1 values and more B1 spatial modulation than the T1 map generated with the proposed UTE-Cones AFI-VTR method, consistent with the simulation and phantom results.
Figure 8.
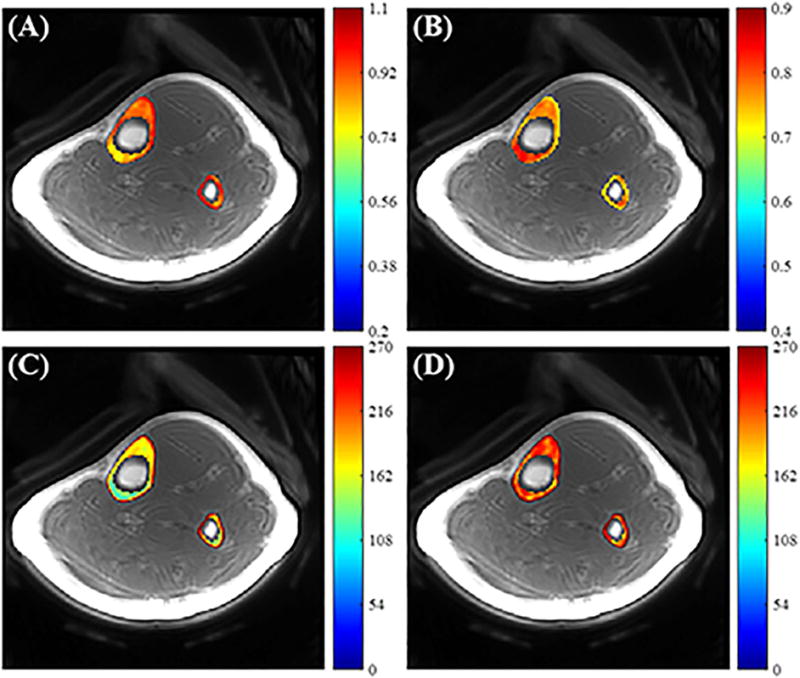
In vivo tibial cortical bone results. Panels A and B show the B1s and maps calculated from 3D UTE-Cones dual-TR images, respectively. Panels C and D show the T1 maps generated using the uncorrected VTR method (C) and using the proposed UTE-Cones AFI-VTR method (D), respectively. The T1 map appears more uniform in (D).
Table 2 summarizes T1 measurements for the bovine cortical bone samples (n = 6) and tibial midshaft cortical bone in the healthy volunteers (n = 3). The mean T1 value and standard deviation obtained with the proposed 3D UTE-Cones AFI-VTR method for the six bovine cortical bone samples and the three in vivo human volunteer tibial cortical bones were 240±25 ms and 218±10 ms, respectively.
Table 2.
T1 values and the fitting standard error (units of ms) obtained by the proposed 3D UTE-Cones AFI-VTR method for in vitro bovine cortical bone samples (n = 6) and in vivo human tibial midshaft cortical bone in healthy volunteers (n = 3).
| #1 | #2 | #3 | #4 | #5 | #6 | |
|---|---|---|---|---|---|---|
|
|
||||||
| In vitro bovine cortical bone sample | 257±7 | 251±6 | 211±5 | 206±8 | 256±6 | 259±7 |
|
| ||||||
| In vivo human tibial cortical bone | #1 | #2 | #3 | |||
|
| ||||||
| 229±12 | 215±11 | 209±9 | ||||
DICUSSION
We have demonstrated that the proposed 3D UTE-Cones AFI-VTR method can quantify the T1s of short T2 tissues more accurately by dealing with the problems created by RF excitation inefficiency and B1 inhomogeneity. Numerical simulations show that T1 measurements using the B1-uncorrected VTR and VFA methods are subject to errors from both B1 inhomogeneity and excitation inefficiency. The B1 maps obtained from Eqs. [7] and [8] are no longer accurate due to the complex relationship between the flip angle and the mapping functions shown in Eqs. [3] and [4] when imaging short T2 species, due to the significant transverse magnetization loss during the relatively long RF excitation process. Simulation shows that the proposed 3D UTE-Cones AFI-VTR method provides accurate T1 measurements for tissues with a wide range of T2 values. The technique is relatively insensitive to the duration of the excitation pulse. Phantom and sample studies demonstrate that the 3D UTE-Cones AFI-VTR method generates uniform T1 maps for both short (i.e. bovine cortical bone) and long (i.e. agarose phantom) T2 tissues. In addition, the bovine cortical bone T1 maps are nearly identical with the three different RF durations (see Figure 7), demonstrating the robustness of the proposed method. Finally, uniform T1 maps were obtained using the proposed method to provide in vivo tibial cortical bone measurements in healthy volunteers.
Many T1 measurement techniques have been proposed including inversion recovery (IR), saturation recovery (SR), and SPGR-based VFA and VTR methods (32–34). The IR method is generally regarded as the gold standard for T1 mapping of long T2 tissues (32). However, this IR method is not useful for T1 measurement of short T2 tissues because the typical inversion pulse available on clinical scanners is too long to provide complete inversion of the short T2 magnetization. The SR method provides accurate and precise T1 measurements for short T2 tissues (34); however, this technique is often too slow to be used clinically. SPGR-based VFA or VTR methods can provide fast volumetric T1 mapping (4, 5, 19), but they suffer from high sensitivity to B1 inhomogeneity (16–21). Obtaining an accurate B1 map is crucial with VFA and VTR T1 measurement approaches. AFI is a fast 3D B1 mapping technique which fits very well with VFA and VTR based T1 corrections. It has been used for volumetric B1 mapping of brain, body, and MSK tissues (15, 20, 21, 35). Uniform T1 maps can be derived using the B1 correction. Kobayashi proposed a B1 mapping method for short T2s based on an implementation of the AFI technique using a 3D radial sequence called Concurrent Dephasing and Excitation (CODE) on a 9.4T 31-cm bore MRI system (18). The sequence shows potential for in vivo imaging on clinical scanners. Han et al. proposed a 3D radial-UTE based AFI approach for B1 mapping of cortical bone (19). However, this group did not consider the B1 measurement errors induced by the imperfect excitation resulting from the use of a 200 μs rectangular pulse which could produce discontinuities in the B1 maps at the bone-marrow boundary (19).
In contrast to these studies our method does not require B1 maps for T1 correction. Instead, the longitudinal magnetization mapping function of the excitation pulse is obtained by the 3D UTE-Cones AFI method which effectively reduces the impact of B1 inhomogeneity. When identical RF pulses and flip angles are used with both the UTE-Cones AFI and UTE-Cones VTR sequences, the derived can be substituted in the VTR function directly for T1 fitting. This method avoids the complex B1 estimation from Eq. [4] and corrects for both B1 inhomogeneity and excitation inefficiency simultaneously.
As shown in the original VFA images of the agarose bone phantom (Supporting Figure S1), ringing artifacts were present in the bone regions due to the relatively low image resolution used and high signal intensity difference between bone and agarose. The ringing artifacts then transferred to the calculated VFA T1 maps (Figures 5C and 5D). The VFA T1 map with B1s correction has a higher average T1 value than the uncorrected VFA T1 map. However, the spatial B1s variation (Figure 5A) still existed in the corrected VFA T1 map (Figure 5D) due to the inaccurate B1s map which was used, and the complicated relationships between the excitation flip angles in the VFA sequences and mapping functions (Eqs. [3] and [4]). Therefore, the VFA T1 maps did not show much improvement after B1 correction, which was similar to the simulation results in Figure 3.
The proposed UTE-Cones AFI-VTR method could be used to measure T1 in a variety of short T2 tissues, including ligaments, menisci, the deep layers of articular cartilage and myelin. In the case of myelin, the proposed 3D UTE-Cones AFI-VTR method may be used to accurately measure myelin T1 with an extra IR pulse to suppress signals from the long T2 water components (36). Accurate T1 measurements may also be crucial as input for other quantitative MRI techniques such as quantitative MT modeling and UTE-Cones imaging. These produce tissue characterizing parameters such as macromolecular proton fraction and low frequency exchange information in short T2 tissues (37, 38).
There are several limitations of this study. First, the total data acquisition time is relatively long, in part due to the selected parameters for high accuracy, high image resolution and broad spatial coverage. A number of strategies can be employed to reduce the total scan time, including decreasing the total number of TRs, using lower resolution for mapping and advanced techniques for image reconstruction. For instance, other authors have found that T1 can be calculated from VTR data using only two different TRs (39, 40), suggesting that the total scan time of the UTE-Cones VTR sequences can be reduced (four TRs were used in the in vivo portion of our study). In addition, the scan time of UTE-Cones AFI sequence can be reduced by decreasing the image resolution for measurement, and acquiring fewer slices. Furthermore, the scan time may be reduced by employing advanced parallel imaging and compressed sensing reconstruction (41). With a combination of the above strategies to greatly reduce the total scan time, our proposed 3D UTE-Cones AFI-VTR method should be acceptable in clinical applications. Second, fat and chemical shift artifacts (which produce ring artifacts in 3D UTE-Cones imaging) may lead to errors in T1 estimation, necessitating some form of fat-water signal separation to improve accuracy (42). Third, the clinical application of the 3D UTE-Cones AFI-VTR method remains to be investigated. However, considering the importance of accurate T1 measurement, the new technique is expected to be useful in the diagnosis and treatment monitoring of many diseases such as osteoporosis, osteoarthritis and multiple sclerosis where short T2 tissues or tissue components are involved in the disease process.
CONCLUSION
The 3D UTE-Cones AFI-VTR method provides a robust technique for the measurement of T1 of short T2 tissues such as cortical bone in acceptable scan times using a clinical 3T scanner.
Supplementary Material
Supporting Figure S1 The original VFA images with flip angle α = 8° (left), 26° (middle) and 45° (right) in the agarose bone phantom study. There are ringing artifacts inside the bone region.
Acknowledgments
The authors acknowledge grant support from GE Healthcare, NIH (1R01 AR062581 and 1R01 AR068987), and the VA Clinical Science Research & Development Service (1I01CX001388).
References
- 1.Fram EK, Herfkens RJ, Johnson GA, Glover GH, Karis JP, Shimakawa A, Perkins TG, Pelc NJ. Rapid calculation of T1 using variable flip angle gradient refocused imaging. Magn Reson Imaging. 1987;5:201–208. doi: 10.1016/0730-725x(87)90021-x. [DOI] [PubMed] [Google Scholar]
- 2.Deoni SC, Peters TM, Rutt BK. High-resolution T1 and T2 mapping of the brain in a clinically acceptable time with DESPOT1 and DESPOT2. Magn Reson Med. 2005;53:237–241. doi: 10.1002/mrm.20314. [DOI] [PubMed] [Google Scholar]
- 3.Cheng HL, Wright GA. Rapid high-resolution T(1) mapping by variable flip angles: accurate and precise measurements in the presence of radiofrequency field inhomogeneity. Magn Reson Med. 2006;55:566–574. doi: 10.1002/mrm.20791. [DOI] [PubMed] [Google Scholar]
- 4.Du J, Bydder GM. Qualitative and quantitative ultrashort-TE MRI of cortical bone. NMR Biomed. 2013;26:489–506. doi: 10.1002/nbm.2906. [DOI] [PMC free article] [PubMed] [Google Scholar]
- 5.Chen J, Chang EY, Carl M, Ma Y, Shao H, Chen B, Wu Z, Du J. Measurement of bound and pore water T1 relaxation times in cortical bone using three‐dimensional ultrashort echo time cones sequences. Magn Reson Med. 2017;77:2136–45. doi: 10.1002/mrm.26292. [DOI] [PMC free article] [PubMed] [Google Scholar]
- 6.Insko E, Bolinger L. Mapping of the radiofrequency field. J Magn Reson Ser A. 1993;103:82–85. [Google Scholar]
- 7.Cunningham CH, Pauly JM, Nayak KS. Saturated double-angle method for rapid B1 mapping. Magn Reson Med. 2006;55:1326–1333. doi: 10.1002/mrm.20896. [DOI] [PubMed] [Google Scholar]
- 8.Stollberger R, Wach P. Imaging of the active B1 field in vivo. Magn Reson Med. 1996;35:246–251. doi: 10.1002/mrm.1910350217. [DOI] [PubMed] [Google Scholar]
- 9.Morrell GR. A phase-sensitive method of flip angle mapping. Magn Reson Med. 2008;60:889–894. doi: 10.1002/mrm.21729. [DOI] [PubMed] [Google Scholar]
- 10.Jiru F, Klose U. Fast 3D radiofrequency field mapping using echoplanar imaging. Magn Reson Med. 2006;56:1375–1379. doi: 10.1002/mrm.21083. [DOI] [PubMed] [Google Scholar]
- 11.Wang D, Zuehlsdorff S, Larson AC. Rapid 3D radiofrequency field mapping using catalyzed double-angle method. NMR Biomed. 2009;22:882–890. doi: 10.1002/nbm.1403. [DOI] [PMC free article] [PubMed] [Google Scholar]
- 12.Dowell NG, Tofts PS. Fast, accurate, and precise mapping of the RF field in vivo using the 180 degrees signal null. Magn Reson Med. 2007;58:622–630. doi: 10.1002/mrm.21368. [DOI] [PubMed] [Google Scholar]
- 13.Chavez S, Stanisz G. A simple and fast flip angle calibration method. Proceedings of the 17th Annual Meeting of ISMRM; Honolulu, Hawaii, USA. 2009. p. 375. [Google Scholar]
- 14.Sacolick LI, Wiesinger F, Hancu I, Vogel MW. B1 mapping by Bloch-Siegert shift. Magn Reson Med. 2010;63:1315–1322. doi: 10.1002/mrm.22357. [DOI] [PMC free article] [PubMed] [Google Scholar]
- 15.Yarnykh VL. Actual flip-angle imaging in the pulsed steady state: a method for rapid three-dimensional mapping of the transmitted radiofrequency field. Magn Reson Med. 2007;57:192–200. doi: 10.1002/mrm.21120. [DOI] [PubMed] [Google Scholar]
- 16.Deoni SC. High-resolution T1 mapping of the brain at 3T with driven equilibrium single pulse observation of T1 with high-speed incorporation of RF field inhomogeneities (DESPOT1-HIFI) J Magn Reson Imaging. 2007;26:1106–1111. doi: 10.1002/jmri.21130. [DOI] [PubMed] [Google Scholar]
- 17.Yarnykh VL. Optimal radiofrequency and gradient spoiling for improved accuracy of T1 and B1 measurements using fast steadystate techniques. Magn Reson Med. 2010;63:1610–1626. doi: 10.1002/mrm.22394. [DOI] [PubMed] [Google Scholar]
- 18.Kobayashi N, Garwood M. B1 mapping of short T2* spins using a 3D radial gradient echo sequence. Magn Reson Med. 2014;71:1689–99. doi: 10.1002/mrm.24817. [DOI] [PMC free article] [PubMed] [Google Scholar]
- 19.Han M, Larson PEZ, Krug R, Rieke V. Actual flip angle imaging to improve T1 measurement for short T2 tissues. Proceedings of the 23rd Annual Meeting of ISMRM; Toronto, Ontario, Canada. 2015. p. 501. [Google Scholar]
- 20.Sinclair CD, Samson RS, Thomas DL, Weiskopf N, Lutti A, Thornton JS, Golay X. Quantitative magnetization transfer in in vivo healthy human skeletal muscle at 3 T. Magn Reson Med. 2010;64:1739–48. doi: 10.1002/mrm.22562. [DOI] [PMC free article] [PubMed] [Google Scholar]
- 21.Baudrexel S, Nürnberger L, Rüb U, Seifried C, Klein JC, Deller T, Steinmetz H, Deichmann R, Hilker R. Quantitative mapping of T1 and T2* discloses nigral and brainstem pathology in early Parkinson’s disease. Neuroimage. 2010;51:512–20. doi: 10.1016/j.neuroimage.2010.03.005. [DOI] [PubMed] [Google Scholar]
- 22.Gatehouse PD, Bydder GM. Magnetic resonance imaging of short T2 components in tissue. Clin Radiol. 2003;58:1–19. doi: 10.1053/crad.2003.1157. [DOI] [PubMed] [Google Scholar]
- 23.Robson MD, Gatehouse PD, Bydder M, Bydder GM. Magnetic resonance: an introduction to ultrashort TE (UTE) imaging. J Comput Assist Tomogr. 2003;27:825–846. doi: 10.1097/00004728-200311000-00001. [DOI] [PubMed] [Google Scholar]
- 24.Sussman MS, Pauly JM, Wright GA. Design of practical T2-selective RF excitation (TELEX) pulses. Magn Reson Med. 1998;40:890–899. doi: 10.1002/mrm.1910400615. [DOI] [PubMed] [Google Scholar]
- 25.Du J, Carl M, Bydder M, Takahashi A, Chung CB, Bydder GM. Qualitative and quantitative ultrashort echo time (UTE) imaging of cortical bone. J Magn Reson. 2010;207:304–11. doi: 10.1016/j.jmr.2010.09.013. [DOI] [PubMed] [Google Scholar]
- 26.Carl M, Bydder M, Du J, Takahashi A, Han E. Optimization of RF excitation to maximize signal and T2 contrast of tissues with rapid transverse relaxation. Magn Reson Med. 2010;64:481–90. doi: 10.1002/mrm.22433. [DOI] [PubMed] [Google Scholar]
- 27.Ma YJ, Zhu Y, Lu X, Carl M, Chang EY, Du J. Short T2 imaging using a 3D double adiabatic inversion recovery prepared ultrashort echo time cones (3D DIR-UTE-Cones) sequence. Magn Reson Med. 2017 doi: 10.1002/mrm.26908. [DOI] [PMC free article] [PubMed] [Google Scholar]
- 28.Gurney PT, Hargreaves BA, Nishimura DG. Design and analysis of a practical 3D cones trajectory. Magn Reson Med. 2006;55:575–582. doi: 10.1002/mrm.20796. [DOI] [PubMed] [Google Scholar]
- 29.Carl M, Bydder GM, Du J. UTE imaging with simultaneous water and fat signal suppression using a time-efficient multispoke inversion recovery pulse sequence. Magn Reson Med. 2016;76:577–582. doi: 10.1002/mrm.25823. [DOI] [PMC free article] [PubMed] [Google Scholar]
- 30.Hurley SA, Yarnykh VL, Johnson KM, Field AS, Alexander AL, Samsonov AA. Simultaneous variable flip angle–actual flip angle imaging method for improved accuracy and precision of three‐dimensional T1 and B1 measurements. Magn Reson Med. 2012;68:54–64. doi: 10.1002/mrm.23199. [DOI] [PMC free article] [PubMed] [Google Scholar]
- 31.Deoni SC, Rutt BK, Peters TM. Rapid combined T1 and T2 mapping using gradient recalled acquisition in the steady state. Magn Reson Med. 2003;49:515–26. doi: 10.1002/mrm.10407. [DOI] [PubMed] [Google Scholar]
- 32.Stanisz GJ, Odrobina EE, Pun J, Escaravage M, Graham SJ, Bronskill MJ, Henkelman RM. T1, T2 relaxation and magnetization transfer in tissue at 3T. Magn Reson Med. 2005;54:507–12. doi: 10.1002/mrm.20605. [DOI] [PubMed] [Google Scholar]
- 33.Stikov N, Boudreau M, Levesque IR, Tardif CL, Barral JK, Pike GB. On the accuracy of T1 mapping: searching for common ground. Magn Reson Med. 2015;73:514–22. doi: 10.1002/mrm.25135. [DOI] [PubMed] [Google Scholar]
- 34.Techawiboonwong A, Song HK, Leonard MB, Wehrli FW. Cortial bone water: in vivo quantification with ultrashort echo-time MR imaging. Radiology. 2008;248:824–833. doi: 10.1148/radiol.2482071995. [DOI] [PMC free article] [PubMed] [Google Scholar]
- 35.Boudreau M, Tardif CL, Stikov N, Sled JG, Lee W, Pike GB. B1 mapping for bias‐correction in quantitative T1 imaging of the brain at 3T using standard pulse sequences. J Magn Reson Imaging. 2017 doi: 10.1002/jmri.25692. [DOI] [PubMed] [Google Scholar]
- 36.Du J, Sheth V, He Q, Carl M, Chen J, Corey-Bloom J, Bydder GM. Measurement of T1 of the ultrashort T2* components in white matter of the brain at 3T. PloS one. 2014;9:e103296. doi: 10.1371/journal.pone.0103296. [DOI] [PMC free article] [PubMed] [Google Scholar]
- 37.Ma YJ, Chang EY, Carl M, Du J. Quantitative magnetization transfer ultrashort echo time imaging using a time‐efficient 3D multispoke Cones sequence. Magn Reson Med. 2017 doi: 10.1002/mrm.26716. [DOI] [PMC free article] [PubMed] [Google Scholar]
- 38.Ma YJ, Carl M, Shao H, Tadros AS, Chang EY, Du J. Three-dimensional ultrashort echo time cones T1ρ (3D UTE-cones-T1ρ) imaging. NMR Biomed. 2017 doi: 10.1002/nbm.3709. [DOI] [PMC free article] [PubMed] [Google Scholar]
- 39.Rad HS, Lam SCB, Magland JF, Ong H, Li C, Song HK, Love J, Wehrlia FW. Quantifying cortical bone water in vivo by three-dimensional ultra-short echo-time MRI. NMR Biomed. 2011;24:855–864. doi: 10.1002/nbm.1631. [DOI] [PMC free article] [PubMed] [Google Scholar]
- 40.Abbasi-Rad S, Saligheh Rad H. Quantification of Human Cortical Bone Bound and Free Water in Vivo with Ultrashort Echo Time MR Imaging: A Model-based Approach. Radiology. 2017;283:862–872. doi: 10.1148/radiol.2016160780. [DOI] [PubMed] [Google Scholar]
- 41.Lustig M, Donoho D, Pauly JM. Sparse MRI: The application of compressed sensing for rapid MR imaging. Magn Reson Med. 2007;58:1182–95. doi: 10.1002/mrm.21391. [DOI] [PubMed] [Google Scholar]
- 42.Dimov AV, Liu Z, Spincemaille P, Prince MR, Du J, Wang Y. Bone quantitative susceptibility mapping using a chemical species–specific R2* signal model with ultrashort and conventional echo data. Magn Reson Med. 2017 doi: 10.1002/mrm.26648. [DOI] [PubMed] [Google Scholar]
Associated Data
This section collects any data citations, data availability statements, or supplementary materials included in this article.
Supplementary Materials
Supporting Figure S1 The original VFA images with flip angle α = 8° (left), 26° (middle) and 45° (right) in the agarose bone phantom study. There are ringing artifacts inside the bone region.


