Abstract
Objective
We developed image-based electrocardiographic (ECG) quality assessment that mimics how a clinician annotates ECG’s signal quality.
Methods
We adopted the Structural Similarity Measure (SSIM) to compare images of two ECG records that are obtained from displaying ECGs in a standard scale. Then a subset of representative ECG images from a training set was selected as templates through a clustering method. SSIM between each image and all the templates were used as the feature vector for the linear discriminant analysis (LDA) classifier. We also employed three most common ECG signal quality index (SQI) measures: baseSQI, kSQI, and sSQI to compare with the proposed image quality index (IQI) approach. We used 1926 annotated ECG, recorded from patient monitors, and associated with six different types of ECG arrhythmia alarms which were obtained previously from an ECG alarm study at the University of California, San Francisco (UCSF). In addition, we applied the templates from the UCSF database to test the SSIM approach on the publicly available 2011 PhysioNet data.
Results
For the UCSF database, the proposed IQI algorithm achieved an accuracy of 93.1% and outperformed all the SQI metrics, baseSQI, kSQI, and sSQI, with accuracies of 85.7%, 63.7%, and 73.8%, respectively. Moreover, the obtained results using PhysioNet data showed an accuracy of 82.5%.
Conclusion
The proposed algorithm showed better performance for assessing ECG signal quality than traditional signal processing methods.
Significance
A more accurate assessment of ECG signal quality can lead to a more robust ECG-based diagnosis of cardiovascular conditions.
Index Terms: Electrocardiogram (ECG), image quality index (IQI), structural similarity index measure (SSIM), cluster analysis, alarm fatigue, intensive care unit (ICU)
I. Introduction
False Electrocardiogram (ECG) arrhythmia alarms are frequent among the patient monitor alarms contributing to “alarm fatigue” which has been listed as one of the top technology threats that may compromise patient safety in hospitals [1]–[3].
It has been shown that an ECG recording of poor quality due to contaminations with baseline wander, movement, and electrode detachment artifacts are more susceptible to generating false alarms [2], [4]–[6]. Therefore, reliable techniques to detect ECG signals of poor quality can be used to recognize false ECG arrhythmia alarms. Many studies have been conducted to develop different signal quality index (SQI) including entries that participated in a PhysioNet Challenge in 2011. Most of these proposed SQI metrics are based on morphological, statistical, and spectral characteristics of ECG signals. They include root mean square (RMS) values of ECG signals filtered with different low and high cut-off frequencies [7], SQI based on signal skewness and kurtosis (i.e., sSQI, kSQI respectively) [8], [9], relative power in the low frequency components (i.e., baseSQI) [8], SQI based on principal component analysis (pcaSQI) [10], eigenvalues of the ECG signals covariance matrix [11], and basic signal morphological characteristics and QRS complex properties [12], and modulation spectral-based ECG quality index (MS-QI) [13]. Some other studies proposed more complex algorithms by using multiple processing stages to recognize poor quality ECGs [14] – [16].
Although complex and abstract algorithms were developed in the aforementioned studies with a goal of improving the accuracy of recognizing poor signal quality ECGs, they do not resemble the way clinical experts assess ECG quality, which is fundamentally a visual perception of multi-lead ECG signals either plotted on paper or displayed on a screen. Seeing multiple ECG leads plotted together is advantageous in providing a better appreciation of the temporal and amplitude relationship among different ECG leads and can contribute to the better differentiation between poor and good quality ECG signals.
With this insight, in this study, we propose a method that mimics how a human expert visually assesses ECG quality without performing detailed measurement of any of the signal characteristics as has been used by previous approaches. To do so, multiple-lead ECG signals are plotted following the conventional temporal and amplitude scales as used in standard ECG paper with grid marks. Then this plot is captured as a multi-lead ECG image, which is then subjected to a machine learning model to differentiate between images corresponding to good quality ECG signals from those corresponding to poor quality. A key element of our machine learning algorithm is a distance metric that quantifies the similarity between two images. We adopted the structural similarity measure (SSIM), which has been widely used in the image processing field and demonstrated to be a superior metric than some other distance metrics including straightforward Euclidian metric [17]. Briefly, SSIM has been originally developed based on the assumption that human visual system (HVS) is highly associated with the structural information of an image. This metric distinguishes between the structures of the images and obtains the similarities between each pair of the predetermined moving local windows between two images. The total similarity is calculated based on the average of all the SSIM values over all the local windows in the entire image. One of the key element of our approach is the construction of image templates which collectively represent typical images of an annotated database. These templates are found by a clustering procedure based on SSIM method. A matrix comprising the SSIM between each of the template images and the test images is formed as the input features to the classifier, which can be any of the off-shelf models. A preliminary version of this work has been previously reported [18].
In this study, to validate the proposed approach and compare it with the existing SQIs, we selected simple linear discriminant analysis (LDA), which has been widely used in the ECG classification approaches [23]–[24]. To assess the proposed framework, we leveraged a dataset from our previous study, University of California at San Francisco (UCSF) Alarm Study dataset, that investigated and annotated six different types of ECG arrhythmia alarms with regard to their signal qualities and correctness of the alarms (i.e. true alarm and false alarm) [3]. In particular, the ECG signal triggering each alarm was annotated to be one of the following categories: poor, good, or fair. To gain maximal contrast, we only included good and poor recordings in this study, each of which is a 15-second ECG immediately preceding the corresponding arrhythmia alarm. To evaluate the robustness of our algorithm in the standard image template selection regardless of normal and abnormal ECG rhythms, we selected the templates from the UCSF Alarm Study ECG data and developed the proposed framework using publicly available PhysioNet Challenge 2011 data as independent dataset with normal ECG rhythms [19].
The rest of the paper is organized as follows: Section II describes the proposed framework based on the structural similarity measure and cluster analysis. Section III presents the results and discussion, and section IV presents the conclusion.
II. Proposed framework
A. Structural Similarity Measure
SSIM incorporates the luminance, contrast, and structure of images when quantifying the distance between them [17]. Given two images X ={xi | i = 1, …, M} and Y ={yi | i = 1, …, M}, where xi and yi are the ith local rectangular window and M is the total number of windows in an image, the SSIM between each two local windows is summarized as below :
| (1) |
where μx, μy, σx, σy and σxy are the local means, standard deviations, and cross-covariance for images x and y. C1, and C2 are constant values depending on the dynamic range of pixel values, L, as below:
| (2) |
where K1 ≪ 1 and K2 ≫ 1 are small constants. The overall quantified similarity between each two images was obtained by the average local SSIM statistics over all the local windows. SSIM is a symmetric matrix with maximum value of one if and only if x = y.
In this study, all seven available ECG leads were plotted in one image following the grid scales used for standard paper ECG. Because clinicians’ assessment of ECG quality does not rely on the order of each lead being plotted, three images were generated for each alarm with three different random permutations of the orders at which each lead is plotted.
B. SSIM Based Hierarchy Cluster Analysis
Clustering methods including k-means, CW-SSIM, etc., have often been used to extract the most representative images from the training data in many vision and image applications [20]–[22]. However, the proposed ECG-image quality index (IQI) framework in this study is based on template matching, where the similarities between each image and a set of templates are evaluated and used as input to a classifier model, to determine ECG quality. To select the most representative images as templates among the training set, Agglomerative hierarchy cluster analysis was used with two different linkage methods, ‘Complete’, and ‘Single’ to form the new clusters [26]. Cluster analysis was done separately on two groups of data, labeled as good and poor quality, with the same number of clusters for each group. Given N training images for each group, the SSIM was calculated for each pair of images results in a symmetric matrix S, containing the SSIM values, with size N × N and diagonal values of 1. Each element in matrix S is shown as sij = s (Ii, Ij) | i, j = 1, …, N} where (Ii, Ij) is the SSIM value between images Ii and Ij. Each row is being considered as an observation where each column is a feature and representative of SSIM between ith image with all the images in the training set. In the cluster analysis, the dissimilarity between each two clusters, was obtained based on the distance D (Ii, Ij) between each two images. This distance was obtained based on the oneminus transform of the SSIM as below:
| (3) |
For each cluster one image was selected as the most representative image of that cluster to be used as a template for further analysis as below:
| (4) |
where T is the number of templates which is equal to the number of clusters, N1 is the number of images at each cluster and S̃ (Ii, Ij) is the SSIM value between images Ii and Ij within each cluster.
C. Datasets
Two ECG signal databases with annotated signal quality by clinical experts were used in this study. The first database were created in a study that was conducted at UCSF [3]. ECG signals as well as other available physiological signals from patient monitors were reviewed by multiple clinical experts that were associated with six different kinds of critical ECG arrhythmia alarms. These alarms include Accelerated Ventricular Rhythm (ACC), Asystole, Ventricular Tachycardia (Vtach), Pause, Ventricular Fibrillation (Vfib), and Ventricular Bradycardia (VBrady). In total, these experts carefully annotated 12,671 alarms and determined whether an alarm was true or false using a standardized protocol. In addition, the quality of ECG signal during the alarm was categorized by these experts into one of three groups: good, fair, and poor. To create a balanced dataset, we used 1926 randomly selected alarms with total equal numbers of good and poor quality groups, respectively. The distributions of good and poor quality signals in each arrhythmia alarm type are as the follows: ACC (395 good vs. 131 poor), Asystole (49 good vs. 121 poor), Vtach (260 good vs. 236 poor), Pause (135 good vs. 434 poor), Vfib (16 good vs. 6 poor), and Vbrady (108 good vs. 35 poor). Each alarm is associated with a 7-lead ECG recording (leads I, II, III, V [typically V1], AVR, AVL, AVF). These ECG leads were recorded at a sampling frequency of 240 Hz with 12-bit resolution. A 15-second segment of each lead prior to the recorded alarm time was extracted for analysis after being band-pass filtered at 0.7–100 Hz.
The second dataset were obtained from public domain which was used in the 2011 PhysioNet/Computing in Cardiology challenge to compare different ECG-SQI algorithms [19]. In this study, Set-a of this database was used. This dataset consists of 1000 ten second segments of standard 12-lead ECG (leads I, II, III, AVR, AVL, AVF, V1, V2, V3, V4, V5, and V6) recorded at sampling rate of 500 Hz, 0.05–100 Hz bandwidth, and 16-bit resolution because signal quality as assessed by a panel of experts of these segments are disclosed. Excluding 2 segments labeled as ‘indeterminate’ quality, 773 segments were labeled as ‘acceptable’ and 225 as ‘unacceptable’. All the recordings were additionally band-pass filtered (0.7–100 Hz) similar to what we applied to the UCSF Alarm Study.
D. Experiment Design
The UCSF Alarm Study database were first used on its own to develop the classifier by using cross-validation to determine the optimal algorithm parameters and generate a final model to be tested on an independent test dataset in order to obtain the performance metrics. 70% of the data were randomly selected as training and the rest as independent test. To optimize the parameters, 5-fold cross validation was used on the training dataset. To reduce the computation time, we resized each image size to two smaller images indicated with ‘Size 1’ and ‘Size 2’ with 135×180 pixels and 225×300 pixels respectively, resulted into two different image resolutions. The local SSIM statistics were computed within three different rectangular window sizes indicated as ‘Small’, ‘Medium’, and ‘Large’, which moves 2s-by-2s over the x-axis of each image and each window differs in height from each other (i.e. ‘Small’, ‘Medium’, and ‘Large’ window heights are 1/7, 1/4 and 1/2 of each image height in terms of y-axis). Given N number of training samples with the corresponding class labels, (yi ∈ {1, −1}, class 1 as good quality and class −1 as poor quality) the classifier was trained. The proposed algorithm was evaluated by using a different number of templates varied between 10 to 400 with a step of 10. The optimal parameters were obtained based on maximum area under curve (AUC) of sensitivity vs. specificity curve for all the number of templets. Based on the optimal parameters obtained at the training stage, classification performance evaluation was done on the independent test data. For each test query image, we compute the SSIM values between that image and all the templates obtained from training data, resulting in a T length vector of SSIM values that are further fed to the classifier to determine the quality. For the classification performance three standard metrics of accuracy (Acc), sensitivity (Sen), and specificity (Spe) were reported where the positive and negative labels belong to good and poor quality images respectively.
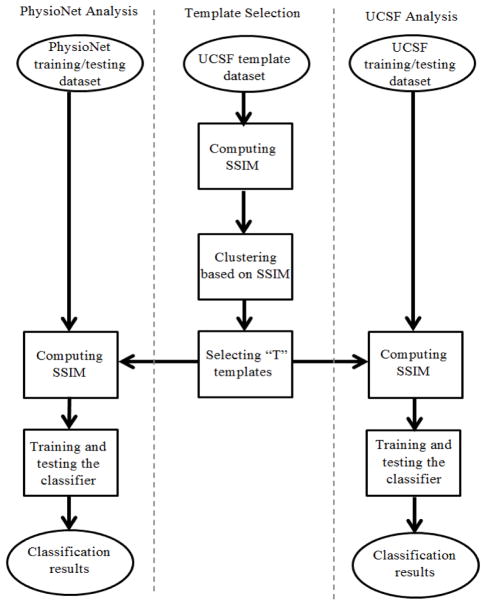
We then adjusted the ECG image templates as determined by using the UCSF Alarm Study database based on the PhysioNet ECG image formats. These image templates were then applied in the second cross-validation experiment to build an optimal model based on training data from PhysioNet database and then tested by using the reserved PhysioNet test dataset to obtain the performance metrics. To be able to use image templates from UCSF Alarm Study database, we selected 7 out of 12 leads (I, II, III, V1, AVR, AVL, and AVF) for the PhysioNet recordings. 70% of the PhysioNet data were randomly selected to use for training and the remaining used for testing. Due to the unbalanced PhysioNet data, we optimized the prior probability required for the LDA classifier by using a 5-fold cross-validation procedure applied on the training set. Then, we used receiver operating characteristic (ROC) generated based on different prior values and the optimum parameters for each number of templates to build the classifier. The optimal number of templates was selected based on the maximum obtained AUC in the training phase. Under the optimal settings, the corresponding classifier was further used in the validation phase. Fig. 1 summarizes the above experimental design adopted in this study to evaluate the proposed ECG quality assessment on both UCSF and PhysioNet data.
Fig. 1.
Diagram of the proposed ECG–IQI assessment. The left column shows the proposed algorithm applied on PhysioNet data; the middle column shows the template selection procedure; the right column shows the proposed algorithm applied on UCSF Alarm Study dataset.
E. Comparison with Several Other Quality Measures
We additionally compared our algorithm with three previously developed SQI metrics, baseSQI, sSQI, and kSQI [8], [9], which use the temporal and spectral statistical information of the whole segments regardless of detecting QRS.
baseSQI: Measure of relative power in baseline assuming low-frequency activities (≤ 1 Hz) are the result of low-quality signals: , where p is the power obtained by using Welch’s method. To analyze based on this metric, we kept all the spectral information of the signal below 40 Hz intact.
sSQI: Measure of skewness (third moment) of the signal assuming high-quality signals are more skewed than low quality: sSQI = E{X − μ}3 / σ3, where μ and σ are the mean and standard deviation of the segment respectively and E is the expected value.
kSQI: Measure of kurtosis (fourth moment) of the signal assuming low-quality signals have more Gaussian distribution: kSQI = E{X − μ}4 / σ4.
The SQI metric for each lead was calculated and the obtained metrics for all the leads were concatenated together as the feature vector to feed the classifier. To keep the SQI analysis consistent with the proposed IQI measure, we used the same channel permuted orders as we used for our proposed framework resulted in the same amount of data for both poor and good quality.
III. Results and discussion
A. Results obtained by using UCSF Alarm Study Dataset
Average performance metrics obtained using 5-fold cross-validation under different combinations of algorithm parameters are shown in Table I. The best performance with a sensitivity of 94.6%, and specificity of 85.3% was obtained by using complete linkage method, large image size, and the largest window size. Fig. 2, presents sensitivity, specificity, and accuracy as achieved by using 30% of the USCF Alarm Study data as an independent testing dataset at a various number of image templates. These performance metrics normally increase with increasing number of template images but at a much lowered pace after the number of template image reaches more than 100. The maximal accuracy of 93.1% was obtained by using 380 template images, which resulted in a sensitivity of 96.3% and specificity of 90.0%, respectively.
TABLE I.
The Average Class Performance with standard deviation obtained from cross validation step for two different linkage methods, three different window sizes, and two different image sizes.
| Window Size | Image Size 1
|
Image Size 2
|
||||||
|---|---|---|---|---|---|---|---|---|
| Acc (%) | Sen (%) | Spe (%) | Acc (%) | Sen (%) | Spe (%) | |||
| Linkage Method | Complete | Small | 87.7 ± 3.7 | 91.9 ± 2.7 | 83.5 ± 4.8 | 89.2 ± 4.0 | 94.2 ± 3.2 | 84.2 ± 4.9 |
| Medium | 87.6 ± 3.7 | 91.9 ± 2.7 | 83.2 ± 4.7 | 89.8 ± 3.0 | 94.3 ± 2.8 | 85.2 ± 3.2 | ||
| Large | 87.7 ± 3.9 | 92.3 ± 2.9 | 83.2 ± 4.5 | 89.9 ± 1.9 | 94.6 ± 1.9 | 85.3 ± 1.8 | ||
|
| ||||||||
| Single | Small | 85.0 ± 4.3 | 89.8 ± 2.6 | 80.2 ± 6.3 | 85.6 ± 4.3 | 90.6 ± 3.2 | 80.5 ± 5.4 | |
| Medium | 85.0 ± 4.3 | 89.7 ± 2.7 | 80.4 ± 6.2 | 85.4 ± 4.2 | 90.3 ± 3.2 | 80.5 ± 5.3 | ||
| Large | 84.7 ± 4.3 | 89.3 ± 2.8 | 80.1 ± 5.9 | 84.9 ± 4.0 | 89.6 ± 3.4 | 80.3 ± 4.7 | ||
Fig. 2.
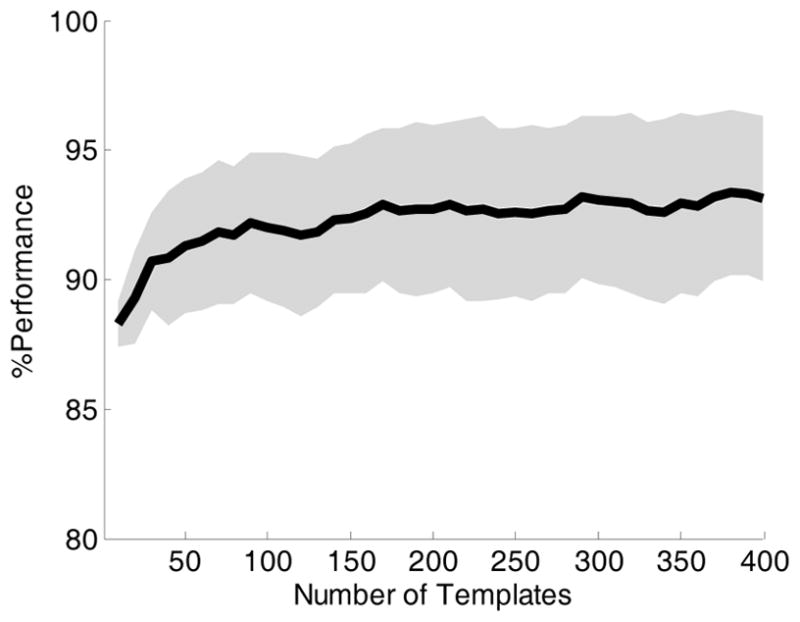
% Classification performance on the UCSF Alarm Study test data. The solid line shows the accuracy with respect to different number of templates selected at the training phase. The upper and lower shaded area show the sensitivity and specificity respectively.
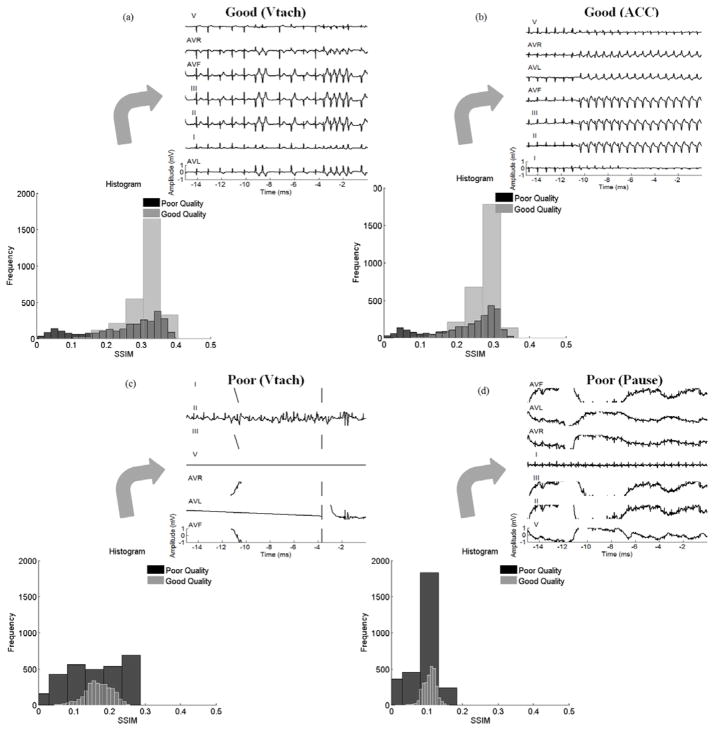
Fig. 3, displays the histograms of SSIM values between all poor and good quality images in the training dataset with template images of two randomly selected good quality and two poor quality ECG recordings, respectively. The alarms are related to VTach and ACC for two good quality templates, and VTach and Pause for two poor quality templates, respectively. However, it can be observed that SSIM values between the poor quality images and template images of poor quality ECGs have a distribution close to uniform with a wide dispersion. On the other hand, SSIM values between images and templates of good quality ECG have a narrower distribution of a single-peak. This observation indicates that it is necessary to have template images of both good quality and poor quality ECG recordings.
Fig. 3.
SSIM histogram between poor and good quality images for two sample templates with good and poor qualities. (a), and (b) show the SSIM histogram between the images from each group with two sample templates annotated as good quality (a) related to VTach alarm and (b) related to ACC alarm. (c), and (d) show the SSIM histogram between the images from each group with two sample templates annotated as poor quality (c) related to VTach alarm and (d) related to Pause alarm.
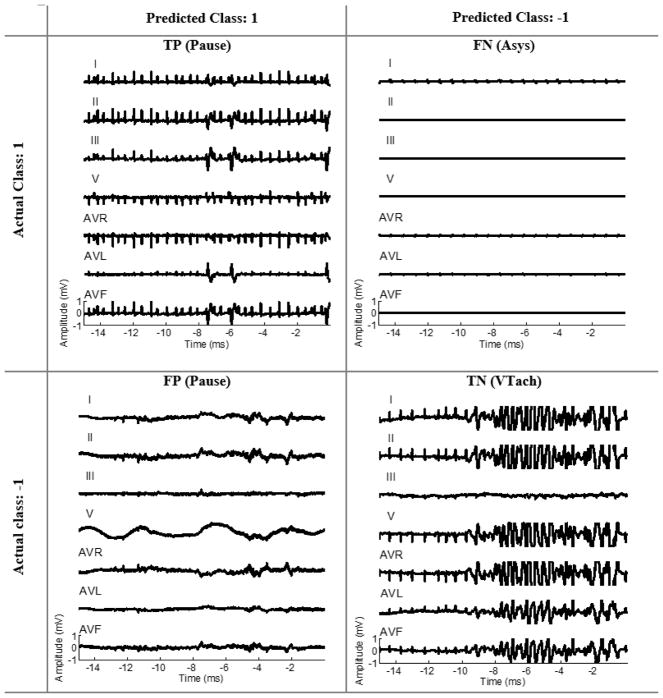
We demonstrate an example of four test samples related to different arrhythmia types predicted as TP, TN, FP, and FN by the optimal classifier shown in Fig. 4. The test image labeled as FN (an image of good quality ECG classified as poor) in this example is one of the challenging cases because the clinical experts focus on a particular lead where ECG QRS was still discernable while the rest of ECG leads were nearly flat. The test image labeled as FP (an image of poor quality ECG classified as good) is also another challenging case because only one ECG lead has larger-than-normal amplitude while the amplitude of the rest of ECG leads is within normal range.
Fig. 4.
Four representative test samples from UCSF Alarm Study dataset representing an example, based on the final classifier, of true postive, true negative, false positive, and false negative, respectively.
The comparison results between our approach and three most basic spectral and statistical ECG-SQI metrics are shown in Table II. As we can see in Table II, the optimal classifier based on SSIM approach considerably outperformed the other three metrics. Among three other metrics, baseSQI performed better than the others with an accuracy of 85.7%. Better performance of the baseSQI than the other two SQI metrics, can also be appreciated by comparing the distribution of baseSQI values from the two ECG groups as shown in Fig. 5. The multivariate SQI approach (i.e. the combination of all three SQI metrics) did not show any considerable improvement in comparison with baseSQI.
TABLE II.
Performance using different ecg quality measures
| Method | Acc (%) | Sen (%) | Spe (%) |
|---|---|---|---|
| SSIM | 93.1 | 96.3 | 90.0 |
| baseSQI | 85.7 | 92.0 | 79.3 |
| kSQI | 63.7 | 52.3 | 75.2 |
| sSQI | 73.8 | 60.6 | 87.0 |
| bSQI, sSQI, kSQI | 86.0 | 91.3 | 80.6 |
Fig. 5.
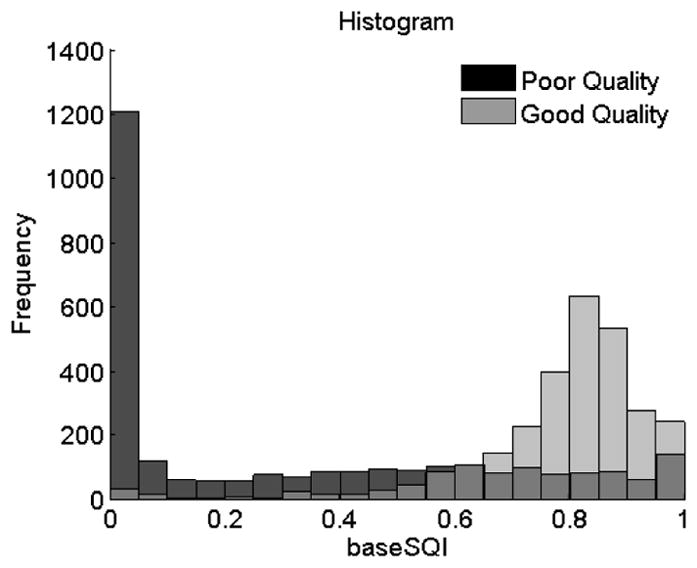
baseSQI histogram for poor and good quality signals.
B. Results from the PhysioNet Data
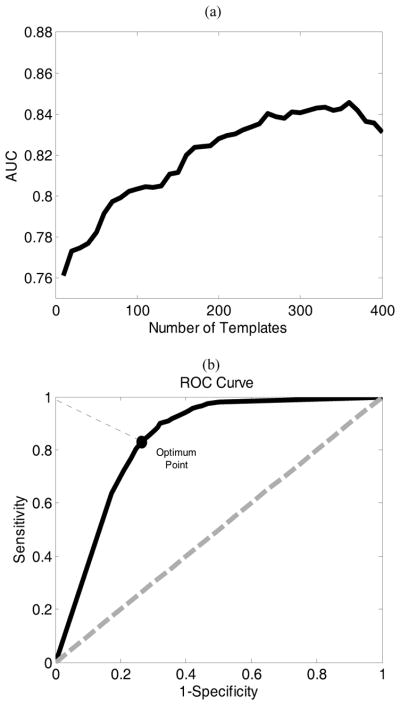
Fig. 6(a) shows the AUC obtained from cross-validating the PhysioNet training data at a different number of template images obtained from the UCSF Alarm Study database. The optimal number of template image is 360, which resulted in an AUC of 0.85. Fig. 6(b) plots ROC curve obtained under the optimal number of the template as determined based on Fig. 6(a). Based on this ROC curve, we selected the optimal threshold for dichotomizing the LDA classifier results which correspond to the point on the ROC curve with the shortest distance to the left upper point on the curve. By using this optimal binary classifier, we could achieve an accuracy of 82.5% (i.e. sensitivity and specificity of 83.9% and 77.7% respectively) based on the testing dataset from PhysioNet.
Fig. 6.
(a) shows AUC obtained from cross validation step on the PhysioNet training data with respect to 400 number of templates. (b) shows the ROC for the optimum number template (i.e. 360) correponsing to the maximum AUC.
C. Discussion
In this study, we proposed and evaluated a novel multi-lead ECG signal quality assessment approach that relies on learning the implicit rules that clinicians adopt when visually assessing ECG signal quality. The main motivation for our approach over the existing SQI based approach is that the image based assessment, which is the critical factor for the human annotation, can capture the regularity and patterns across multiple ECG leads. Indeed, the comparison as done in our study provided experimental evidence that this factor is in fact very important for accurate signal quality assessment. Thus, developing an algorithm that can mimic the human visual perception, can potentially replace the human annotators. Moreover, inter-observer variability does exist when annotating the ECGs. Developing an intelligent machine learning algorithm, not only reduce the errors might happen as a result of natural human mistakes but also can reduce the clinician’s workload in ICUs. The key element of our learning algorithm is the adoption of SSIM to measure the similarity between a test ECG image and those in an ECG image library whose signal quality have been annotated.
In the machine learning step of the proposed algorithm, each feature element is the structural similarity between the test sample and one of the ECG template images. Because both poor and good quality ECG images are included in the templates, an SSIM-based feature vector captures the similarity between a test image and all good and poor templates. Therefore, it can be used as an input to classify ECG into a poor or a good quality category. In addition, structural similarity between two ECG images is not influenced by a particular local aspect of ECG signal that the existing SQIs aim to capture and in fact, it captures global features of two ECG images. Therefore, the superior performance of our SSIM-based approach to some other existing methods, including baseSQI, sSQI, and kSQI, shows that global features based on SSIM approach are more efficient in differentiating between poor and good quality signals.
The associations of poor ECG signal quality with false ECG arrhythmia alarms suggests that alarms with poor signal quality should be suppressed. Indeed, UCSF Alarm Study database would be an ideal dataset for developing such a use case, because ECG signals in the database were from six ECG arrhythmia alarms [3]. Moreover, considering the inter-observer variability among the annotators, and to avoid bias, the annotations for the UCSF Alarm Study was performed by three annotators plus a senior investigator to adjudicate the conflicts. So our templates selected using the proposed SSIM approach is appropriate templates for an ECG arrhythmia study.
Another use case is represented by the objectives of the PhysioNet challenge where the second dataset utilized in this study was obtained. In this case, signal quality assessment is important for ECG signals that are increasingly more often acquired by using wearable and mobile devices from subjects in various activities. Compared to data from patients in the hospital, data from these devices are even more susceptible to artifacts and noises. Therefore, a reliable ECG signal quality assessment approach is critical for subsequent analysis of these kinds of signals. One of our main motivations to test the proposed framework on the PhysioNet data was to test if the selected templates obtained from different arrhythmia data can also be used for another application regardless of normal or abnormal cardiac rhythms. The difference in the normality/abnormality of the rhythms between UCSF and PhsyioNet datasets provides an excellent opportunity to investigate the generalizability of ECG image templates from one source and its importance in determining the overall performance of differentiating between good and poor ECG signals in another source. Although, testing our algorithm based on PhysioNet data showed promising performance with accuracy of 82.5% (i.e. sensitivity and specificity of 83.9% and 77.7% respectively), the performance is inferior to that obtained on the test data set based on UCSF Alarm Study dataset, 93.1% (i.e. sensitivity and specificity of 96.3% and 90.0%, respectively). This observation can be attributed to the choice of only using UCSF Alarm Study dataset to build the templates, as one of the limitations of this study.
Therefore, an enhanced performance of IQI algorithm, on the PhysioNet data, can be further explored by developing the whole proposed IQI approach on the PhysioNet data while constructing the templates from this data source by itself.
Moreover, the obtained 7-lead ECG images in this study were limited to the standard scale used for the ECG papers. Therefore, correcting for the displayed missing traces due to the saturation, can be one of the useful pre-processing steps to enhance the IQI performance in the future work of this study.
It also remains interesting to explore if combining different existing SQIs with the proposed IQI measure, to form a multivariate approach, would improve the performance.
Based on an extensive review of 80 different developed artifact detection (AD) algorithms S. Nizami et al., reported that most of the published algorithms are rarely evaluated in real-time and clinical practice [25]. Therefore, translation of these algorithms to clinical practice remains to be pursued.
IV. CONCLUSION
Our proposed ECG signal quality assessment approach aims to mimic how a human expert visually assesses ECG quality without performing detailed measurement of any of the signal characteristics used by the existing approaches. We tested the proposed approach by using two datasets with annotations of ECG signal quality. The first one is the UCSF annotated ECG dataset that were associated with six different types of ECG arrhythmia alarms and the second one is the dataset that were used in the PhysioNet Challenge 2011. By selecting templates, training, and testing the classifier based on the UCSF Alarm Study dataset, the average accuracy, sensitivity, and specificity were 92.3%, 95.3%, and 89.3% respectively. The accuracy trend achieved a plateau level of 90% only when 30 templates were used in the training phase. Moreover, the best performance obtained by using the combination of baseSQI, kSQI, and sSQI metrics with an accuracy of 86.0%, was considerably inferior to the accuracy of 93.1% obtained by using the SSIM-based approach. Evaluation of our algorithm on an independent PhysioNet data resulted in an accuracy of 82.5%.
Overall, the outcomes of this study suggest a new direction for developing physiological SQ assessment technique based on the integration of clinicians’ visual perception while capturing the dynamic relationship between all the recordings at the same time. The understanding gained by this approcah, on how ECG quality is estimated by clinicians, can be useful for designing effective and practical algorithms applicable to ECG monitoring systems.
Moreover, the broader impact of the outcomes from this study can open a new direction toward enhancement of image-based signal quality techniques applicable to a wide range of bio-signals such as electroencephalography (EEG), intracranial pressure (ICP), and photoplethysmography (PPG).
Acknowledgments
The work is partially supported by R01NHLBI128679-01, UCSF Middle-Career scientist award, and UCSF Institute of Computational Health Sciences.
Contributor Information
Yalda Shahriari, Department of Electrical, Computer & Biomedical Engineering, University of Rhode Island, Kingston, RI 02881, USA, and also with Department of Physiological Nursing, University of California at San Francisco (UCSF), CA 94143, USA.
Richard Fidler, Department of Physiological Nursing, University of California at San Francisco (UCSF), CA 94143, USA.
Michele M Pelter, Department of Physiological Nursing, University of California at San Francisco (UCSF), CA 94143, USA.
Yong Bai, Department of Physiological Nursing, University of California at San Francisco (UCSF), CA 94143, USA.
Andrea Villaroman, Department of Physiological Nursing, University of California at San Francisco (UCSF), CA 94143, USA.
Xiao Hu, Department of Physiological Nursing and Neurosurgery, Institute for Computational Health Sciences, Affiliate, UCB/UCSF Graduate Group in Bioengineering, University of California at San Francisco (UCSF), CA 94143, USA.
References
- 1.JECRI. Alarm safety resource site: Guidance and tools to help healthcare facilities improve alarm safety. [Online]. Available: https://www.ecri.org/Forms/Pages/Alarm_Safety_Resource.aspx.
- 2.Orphanidou C, et al. Signal-quality indices for the electrocardiogram and photoplethysmogram: Derivation and applications to wireless monitoring. IEEE journal of biomedical and health informatics. 2015;19(3):832–838. doi: 10.1109/JBHI.2014.2338351. [DOI] [PubMed] [Google Scholar]
- 3.Drew BJ, et al. Insights into the problem of alarm fatigue with physiologic monitor devices: a comprehensive observational study of consecutive intensive care unit patients. PloS one. 2014 doi: 10.1371/journal.pone.0110274. [Online]. Available: http://journals.plos.org/plosone/article?id=10.1371/journal.pone.011024. [DOI] [PMC free article] [PubMed]
- 4.Behar J, et al. ECG signal quality during arrhythmia and its application to false alarm reduction. IEEE Transactions on Biomedical Engineering. 2013;60(6):1660–1666. doi: 10.1109/TBME.2013.2240452. [DOI] [PubMed] [Google Scholar]
- 5.Tsien CL, Fackler JC. Poor prognosis for existing monitors in the intensive care unit. Crit Care Med. 1997;25(4):614–619. doi: 10.1097/00003246-199704000-00010. [DOI] [PubMed] [Google Scholar]
- 6.Zong W, et al. Reduction of false arterial blood pressure alarms using signal quality assessment and relationships between the electrocardiogram and arterial blood pressure. Medical and Biological Engineering and Computing. 2004;42(5):698–706. doi: 10.1007/BF02347553. [DOI] [PubMed] [Google Scholar]
- 7.Vaglio M, et al. Use of ECG quality metrics in clinical trials. Computing in Cardiology. 2010;37:505–508. [Google Scholar]
- 8.Clifford GD, et al. Signal quality indices and data fusion for determining acceptability of electrocardiograms collected in noisy ambulatory environments. Computing in Cardiology. 2011;38:285–288. [Google Scholar]
- 9.Li Q, et al. Robust heart rate estimation from multiple asynchronous noisy sources using signal quality indices and a Kalman filter. Physiological measurement. 2007;29(1):15–32. doi: 10.1088/0967-3334/29/1/002. [DOI] [PMC free article] [PubMed] [Google Scholar]
- 10.Behar J, et al. A single channel ECG quality metric. Computing in Cardiology. 2012;39:381–384. [Google Scholar]
- 11.Morgado E, et al. Quality estimation of the electrocardiogram using cross-correlation among leads. Biomedical engineering online [Online] 2015;14(1) doi: 10.1186/s12938-015-0053-1. Available: http://biomedical-engineering-online.biomedcentral.com/articles/10.1186/s12938-015-0053-1. [DOI] [PMC free article] [PubMed] [Google Scholar]
- 12.Hayn D, et al. ECG quality assessment for patient empowerment in mHealth applications. Computing in Cardiology. 2011;38:353–356. [Google Scholar]
- 13.Vallejo DT, Falk T. MS-QI: a modulation spectrum-based ECG quality index for telehealth applications. IEEE Transactions on Biomedical Engineering. 2016;63(8):1613–1622. doi: 10.1109/TBME.2014.2355135. [DOI] [PubMed] [Google Scholar]
- 14.Xia H, et al. Computer algorithms for evaluating the quality of ECGs in real time. Computing in Cardiology. 2011;38:369–372. [Google Scholar]
- 15.Moody BE. Rule-based methods for ECG quality control. Computing in Cardiology. 2011;38:361–363. [Google Scholar]
- 16.Johannesen L, Galeotti L. Automatic ECG quality scoring methodology: mimicking human annotators. Physiological measurement. 2012;33(9):1479–1489. doi: 10.1088/0967-3334/33/9/1479. [DOI] [PubMed] [Google Scholar]
- 17.Wang Z, et al. Image quality assessment: from error visibility to structural similarity. IEEE transactions on image processing. 2004;13(4):600–612. doi: 10.1109/tip.2003.819861. [DOI] [PubMed] [Google Scholar]
- 18.Shahriari Y, et al. Perceptual Image Processing Based Ecg Quality Assessment. Journal of Electrocardiology. 2016;49(6):937. [Google Scholar]
- 19.Silva I, et al. Improving the quality of ECGs collected using mobile phones: The Physionet/Computing in Cardiology Challenge 2011. Computing in Cardiology. 2011;38:273–276. [Google Scholar]
- 20.MacQueen JB. Some methods for classification and analysis of multivariate observations. Proceedings of the Fifth Berkeley Symposium on Mathematical Statistics and Probability; University of California Press; 1967. pp. 281–297. [Google Scholar]
- 21.Moghaddam B, Pentland A. Probabilistic visual learning for object detection. International Conference on Computer Vision. [Online]; 1995. Available: http://vismod.media.mit.edu/pub/facereco/papers/TR-326.pdf. [Google Scholar]
- 22.Rehman A, et al. Image classification based on complex wavelet structural similarity. Signal Processing: Image Communication. 2013;28(8):984–992. [Google Scholar]
- 23.De Chazal P, et al. Automatic classification of heartbeats using ECG morphology and heartbeat interval features. IEEE Transactions on Biomedical Engineering. 2004;51(7):1196–1206. doi: 10.1109/TBME.2004.827359. [DOI] [PubMed] [Google Scholar]
- 24.Llamedo M, Martínez JP. Heartbeat classification using feature selection driven by database generalization criteria. IEEE Transactions on Biomedical Engineering. 2011;58(3):616–625. doi: 10.1109/TBME.2010.2068048. [DOI] [PubMed] [Google Scholar]
- 25.Nizami S, et al. Implementation of artifact detection in critical care: A methodological review. IEEE reviews in biomedical engineering. 2013;6:127–142. doi: 10.1109/RBME.2013.2243724. [DOI] [PubMed] [Google Scholar]
- 26.Szekely Gabor J, Rizzo Maria L. Hierarchical clustering via joint between-within distances: Extending Ward’s minimum variance method. Journal of classification. 2005;22(2):151–183. [Google Scholar]


