

Abstract
Cyclin dependent kinase 9 (CDK9), a key regulator of transcriptional elongation, is a promising target for cancer therapy, particularly for cancers driven by transcriptional dysregulation. Here, we report the characterization of NVP-2 (3), a selective ATP-competitive CDK9 inhibitor; and THAL-SNS-032, a selective CDK9 degrader consisting of a CDK-binding SNS-032 ligand linked to a thalidomide derivative which binds the E3 ubiquitin ligase Cereblon (CRBN). Surprisingly, THAL-SNS-032 induces rapid degradation of CDK9 without affecting the levels of other SNS-032 targets. Moreover, the transcriptional changes elicited by THAL-SNS-032 were more like those caused by NVP-2 than those induced by SNS-032. Strikingly, compound washout did not significantly reduce levels of THAL-SNS-032-induced apoptosis, suggesting that CDK9 degradation had prolonged cytotoxic effects compared to CDK9 inhibition. Thus, our findings demonstrate thalidomide conjugation represents a promising strategy for converting multi-targeted inhibitors into selective degraders, and reveal that kinase degradation can induce distinct pharmacological effects compared to inhibition.
Graphical abstract
Introduction
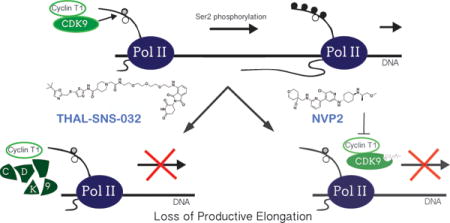
Cyclin-dependent kinases (CDKs) are a family of serine/threonine kinases that are conserved across eukaryotes. In humans, there are 20 members of this family: CDKs 1, 2, 4, and 6 regulate cell cycle progression, while CDKs 7 through 13 regulate gene transcription1, 2. CDKs 14-20 are less understood but have widespread cellular activities varying from Wnt signaling to vesicle transport3, 4. In particular, CDK9 and its partner Cyclin T comprise the positive transcription elongation factor b (P-TEFb), which promotes transcription elongation by at least two mechanisms5. First, P-TEFb phosphorylates Serine-2 of the RNA Polymerase II (Pol II) C-terminal domain (CTD) heptapeptide repeat, which in turn recruits other factors necessary for productive elongation6. Second, P-TEFb phosphorylates subunits of Negative Elongation Factor (NELF) and DRB (5,6-Dichloro-1-β-D-ribofuranosylbenzimidazole) Sensitivity Inducing Factor (DSIF). These phosphorylation events inhibit NELF’s ability to pause Pol II in a non-elongation competent state and convert DSIF into a positive elongation factor7–9. Therefore, CDK9 has a crucial role in promoting transcription.
Several observations have stimulated interest in the development of CDK9 inhibitors for clinical use. First, CDK9 promotes Pol II pause release, a rate-limiting step in normal transcriptional regulation that is frequently dysregulated in cancer10–14. Second, modified natural products, such as Flavopiridol, potently induce apoptosis in cancer cells, due in part to the loss of short-lived anti-apoptotic mRNA transcripts following CDK9 inhibition15–18. Currently, the CDK9 inhibitors that have been advanced to human clinical trials inhibit several different CDKs. Although some second generation CDK inhibitors that exhibit improved selectivity for CDK9, such as i-CDK9, have been reported, their clinical efficacy has yet to be established11. More generally, developing highly selective inhibitors of CDKs is challenging due to homology of the ATP binding pocket19. For example, SNS-032 (1) (originally BMS-387032), an N-acyl-2-aminothiazole originally developed as a selective CDK2 inhibitor, was later discovered to be a potent inhibitor of CDK7 and CDK920. Furthermore, current CDK9 inhibitors are reversible and require continuous target occupancy to maintain CDK9 inhibition. Therefore, an urgent need exists for new strategies to potently and selectively ablate CDK9 activity.
Recently, we and others have pioneered a small molecule-mediated protein degradation strategy exploiting the ability of thalidomide to bind to the E3 ligase CRBN. Specifically, we have designed bivalent compounds where a small molecule ligand of a protein of interest (POI) is linked to thalidomide, which results in the recruitment of CUL4-RBX1-DDB1-CRBN (CRL4CRBN), a ubiquitously-expressed E3 ligase receptor, to the POI, thereby inducing its ubiquitination and subsequent proteasomal degradation. The initial demonstration of this approach involved conjugation of the BRD4 inhibitor JQ1 to a thalidomide derivative to create dBET1, a compound that potently induced the degradation of BRD421. A variety of other targets, including FKBP12, RIPK2 and BCR-ABL have been degraded using this approach as well21–23.
Inducing protein degradation has several potential advantages over inhibition, including a prolonged effect, an ability to abrogate non-enzyme-dependent functions, and the ability to inhibit the activity of proteins for which no ‘druggable’ catalytic activity is known. Such differences in inhibition versus ablation have previously been noted for transcriptional kinases, including Kin28 and CDK824–26. In addition, because these compounds may potentially act catalytically to induce protein degradation, lower intracellular concentrations may be sufficient.
Here we report that THAL-SNS-032 (2), a small molecule formed by conjugation of the multi-targeting kinase inhibitor SNS-032 to thalidomide, induces potent and selective degradation of CDK9 in a CRBN-dependent fashion. Treatment with THAL-SNS-032 results in selective degradation of CDK9 with limited effects on the protein level of other CDKs. Furthermore, THAL-SNS-032 has a prolonged pharmacodynamic effect compared to traditional kinase inhibitors. To the best of our knowledge, this is the first demonstration of selective degradation of a CDK from a multi-targeting parent scaffold, and suggests that thalidomide conjugation could be a promising approach to achieve target selectivity in addition to inducing irreversible inhibition via degradation.
Results
THAL-SNS-032 selectively induces degradation of CDK9
Using structural information gleaned from the SNS-032/CDK2 co-crystal structure (PDB 5D1J20), we designed the bivalent THAL-SNS-032 molecule by derivatizing the solvent-exposed piperidine nitrogen of SNS-032 with a 3 polyethylene glycol (PEG) linker conjugated to thalidomide (Fig. 1a). We first examined the biochemical selectivity of THAL-SNS-032, and determined it maintained nanomolar biochemical inhibition of the reported CDK targets of the parent compound including: CDK1/CycB (171nM), CDK2/CycA (62nM), CDK7/CycH/MNAT1 (398nM), and CDK9/CycT1 (4nM). To further determine selectivity of THAL-SNS-032 for kinases in cell lysates, we employed Kinativ™ chemical proteomics, an approach where target engagement is assessed by measuring the ability of a small molecule to protect kinases from labeling by a kinase-reactive des-thiobiotin ATP probe27. Profiling of the acute lymphoblastic leukemia MOLT4 cell line revealed that SNS-032 and THAL-SNS-032 had similar kinase binding profiles in lysates, indicating that the PEG-imide modification does not interfere with kinase binding (Fig. 1b, Supplementary Results, Supplementary Fig. 1a,1b,1c).
Figure 1. THAL-SNS-032 selectively induces degradation of CDK9.
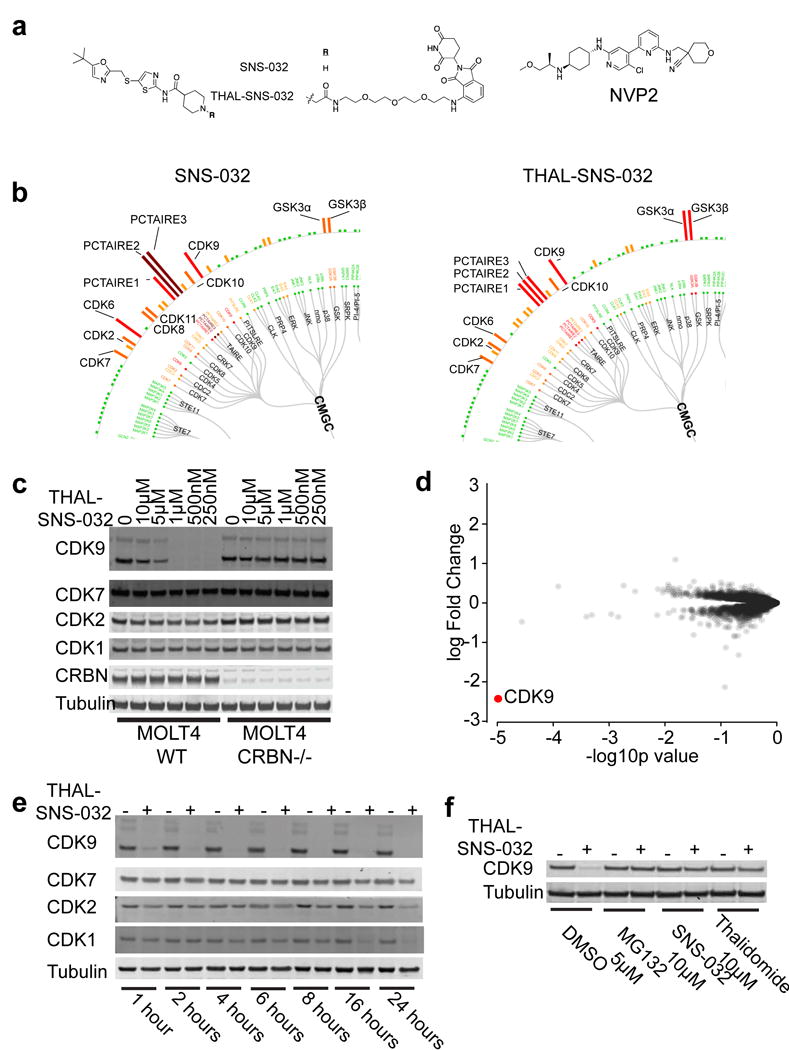
a. Chemical structures of NVP-2, SNS-032, THAL-SNS-032 where R=H for SNS-032 and R is the shown linked thalidomide derivative for THAL-SNS-032. b. Kinativ™ data from MOLT4 lysates showing CMGC family targets engaged by SNS-032 or THAL-SNS-032 at a concentration of 1uM. Full data set in Supplementary Dataset 1. c. Immunoblot of proteins shown after 6-hour treatment with the indicated concentrations of THAL-SNS-032 in wildtype or CRBN −/− MOLT4 cells. d. Log fold-change in abundance of proteins with 2 peptide thresholds as measured using multiplexed quantitative-mass spectrometry-based proteomics following a 2-hour treatment of MOLT4 cells with 250nM THAL-SNS-032 vs p-value (n=3, biological replicates). Full data set in Supplementary Dataset 2. e. Immunoblot for proteins shown after treatment of MOLT4 cells with 250nM THAL-SNS-032 for the indicated times. f. Immunoblot for CDK9 and Tubulin after 4-hour pre-treatment with MG132 (5μM), SNS-032 (10μM), thalidomide (10μM), or DMSO vehicle followed by a 2 hour THAL-SNS-032 treatment (250nM) in MOLT4 cells. Uncut western blots are in Supplementary Figure 6.
Next, we sought to determine whether THAL-SNS-032 could induce degradation of the primary CDK targets of SNS-032 by treating wildtype and CRBN−/− MOLT4 cells28 with increasing concentrations of THAL-SNS-032 for 6 hours. We found that while CDK9 degradation is CRBN-dependent up to a concentration of 5μM, the other known CDK targets of SNS-032 show little-to-no change in protein levels at any of the tested concentrations (Fig. 1c). Although CDK10 was not previously known to be a target of SNS-032, we identified it as a target of SNS-032 and THAL-SNS-032 by Kinativ™ profiling of MOLT4 lysates. As such, we tested whether THAL-SNS-032 was capable of inducing CDK10 degradation, and found that CDK10 demonstrated partial degradation, but required longer exposure to the compound to achieve full degradation (Supplementary Fig. 1d, 1e). Thus, we believe CDK9 is the primary target driving THAL-SNS-032 pharmacology. Interestingly, at concentrations of 5μM and above, we observed a decrease in CDK9 degradation (Fig. 1c). This is consistent with a “hook effect” that has been described for other degraders21, where independent engagement of CDK9 and CRBN by THAL-SNS-032 prevents effective formation of the trimeric complex and subsequent proteasomal degradation.
To more broadly survey the effects of THAL-SNS-032, we used an unbiased, multiplexed quantitative mass spectrometry-based proteomics approach employing tandem mass tag (TMT) reagents29. We performed this proteome-wide analysis on MOLT4 cells at 2 hours following THAL-SNS-032 treatment, a time point at which changes in protein abundance would be primarily due to compound-induced degradation rather than confounding transcriptional or translational changes. This unbiased experiment identified CDK9 as the most depleted protein out of 4512 proteins based on quantification of 2 or more peptides (Fig. 1d). CDK9 was the only CDK to exhibit more than two-log-fold significant downregulation, even though the parent SNS-032 compound and THAL-SNS-032 have nanomolar affinities for CDK1, CDK2 and CDK7.
To investigate the kinetics of THAL-SNS-032-induced effects, we performed a time course of 250nM THAL-SNS-032 treatment and found that substantial CDK9 degradation occurs within one hour and persists for at least 24 hours (Fig. 1e). CDK1, CDK2, and CDK7 showed a modest reduction in protein levels with THAL-SNS-032 treatment after 8 hours. We attribute this to downstream changes in transcription due to loss of CDK9 rather than compound-induced degradation, as CDK1 and CDK7 mRNA levels are reduced to around 20% of DMSO-treated levels at that time (Supplementary Fig 1f), and similar reductions in the abundance of CDK1 and CDK7 protein are observed after CDK9 inhibition with NVP-2 or SNS-032 treatment (Supplementary Fig. 1g, 1h). To determine the dependence of degradation on proteasome activity, we pre-treated MOLT4 cells with the proteasome inhibitor MG132 and found that CDK9 degradation is blunted, indicating that CDK9 degradation requires an active proteasome (Fig. 1f). Furthermore, pre-treatment with excess thalidomide or SNS-032, to compete with THAL-SNS-032 for binding to either target, was also able to block CDK9 degradation, consistent with a requirement for engagement of both CRBN and CDK9 in the same complex to achieve CDK9 degradation (Fig. 1f).
NVP-2 selectively inhibits CDK9
A search of the patent literature revealed that Novartis developed NVP-2, a highly selective aminopyrimidine-derived CDK9 inhibitor30. We performed a detailed characterization of NVP-2 to validate its use as a selective CDK9 probe for comparison with THAL-SNS-032. NVP-2 potently inhibited the kinase activity of CDK9/CycT with an IC50 of less than 0.514 nM and exhibited excellent kinome selectivity when tested against a panel of 468 kinases (Kinomescan), exhibiting an S(1) score of 0.005 (Fig. 2a). The only kinases inhibited greater than 99% were CDK9 and DYRK1B but also showed greater than 90% binding activity on CDK7 and CDK13. Follow-up biochemical evaluation of DYRK1B revealed an IC50 of 350nM, 700-fold higher than that observed for CDK9, and a CDK7 IC50 of greater than 10 μM (Supplementary Table 1). This discrepancy between Kinomescan and biochemical kinase assay likely occurs due to the inclusion of the cyclin in the biochemical kinase assays which may cause a change in the conformation of the ATP binding site. To determine the selectivity of NVP-2 in lysates, we again employed lysate Kinativ™ chemical proteomics. We found that in MOLT4 cell lysate, CDK9 and CDK10 are strongly engaged by NVP-2, while the remainder of the kinome was largely unaffected (Fig. 2b, Supplementary Fig. 1i).
Figure 2. NVP-2 selectively inhibits CDK9.
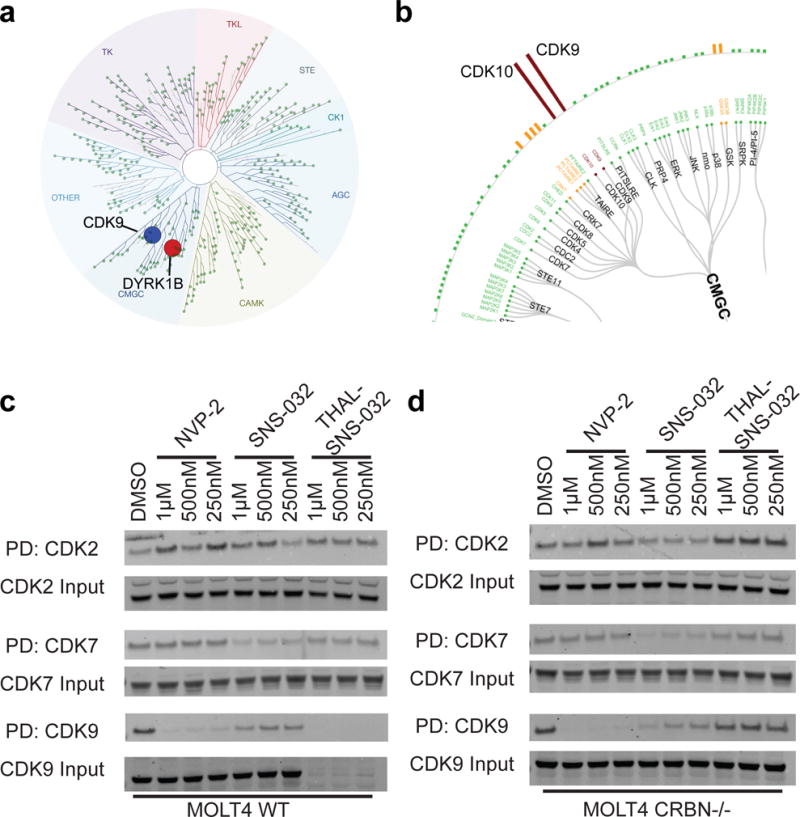
a. Kinase trees represent kinome-wide selectivity at S(1) of NVP-2 through Kinomescan™ profiling at 1μM (CDK9 labeled in blue, while all other inhibited kinases appear in red). S(1) indicates the kinases with binding inhibited 99% or greater by the compound. Full dataset in Supplementary Dataset 3. b. Kinativ™ data from MOLT4 lysates showing CMGC family targets engaged by NVP-2 at a concentration of 1uM c. Bio-AT7519 pulldown of CDK2, CDK7 or CDK9 (PD) or input in MOLT4 wildtype at concentrations indicated for each compound. d. Bio-AT7519 pulldown of CDK2, CDK7 or CDK9 (PD) or input in MOLT4 CRBN−/−) cells at concentrations indicated for each compound. Uncut western blots are in Supplementary Figure 6.
As NVP-2 has sub-nanomolar potency for CDK9 and is significantly more selective than SNS-032, we sought to generate degrader molecules using this scaffold for comparison with THAL-SNS-032. To do so, we synthesized a series of molecules with different linkers (PEG, alkyl) and thalidomide attachment sites (ortho- and meta-) (Supplementary Fig. 2a), and tested each molecule at 250nM treatment for 6 hours. Surprisingly, we found that, in contrast to THAL-SNS-032, none of the NVP-2-based degraders could induce complete CDK9 degradation (Supplementary Fig. 2b). Furthermore, we found that the THAL-NVP-2 compounds had very poor anti-proliferative effects: THAL-NVP-2-02-099 (4) and THAL-NVP-2-03-069 (5) exhibited more potency but both molecules displayed poor rescue in CRBN−/− cells (Supplementary Fig. 2c) indicating that the anti-proliferative effects of these molecules were likely due to kinase inhibition rather than degradation. THAL-NVP-2-03-084 (6) and THAL-NVP-2-03-105 (7) were unable to inhibit proliferation at sub-μM concentrations (Supplementary Fig. 2c).
To further characterize this series of NVP-2-based degraders, we chose to focus on THAL-NVP-2-03-069, the compound with the most potent anti-proliferative activity. We found that over a range of concentrations after 6-hour treatment, we could achieve the greatest degree of CDK9 degradation at 250 nM, but this dose was not sufficient to induce complete degradation (Supplementary Fig. 2d). This is in striking contrast to THAL-SNS-032, which could efficiently induce complete CDK9 degradation at concentrations as low as 250 nM after 6-hour treatment. To examine the kinetics of CDK9 degradation, we treated MOLT4 cells with 250nM THAL-NVP-2-03-069, and found that THAL-NVP-2-03-069 was only able to achieve complete degradation of CDK9 after 24 hours of treatment, a timepoint at which we also observed CDK10 degradation (Supplementary Figure 2e.) Thus, while NVP-2 seemed like an attractive candidate for thalidomide conjugation to induce CDK9 degradation, we were unsuccessful in producing a molecule of equal potency and kinetic acuity to THAL-SNS-032. Further experiments beyond the scope of the present study will be necessary to elucidate the mechanistic rationale for why NVP-2-derived thalidomide conjugates have such poor degradation capabilities.
CDK9 degradation occurs sub-stoichiometrically
To compare the cellular target engagement of NVP-2 and THAL-SNS-032 to SNS-032, we utilized a previously developed affinity competition assay, where the ability of different compounds to prevent kinases from being affinity purified with biotinylated AT7519 (bio-AT7519), a pan-CDK inhibitor able to bind to CDK9, CDK2, and CDK731, was assessed. Using this target engagement assay, we found that in 6 hours, NVP-2 engages CDK9 in wildtype and CRBN−/− MOLT4 cells at all concentrations tested, while CDK2 and CDK7 were unaffected (Fig. 2c, 2d). SNS-032 showed engagement of CDK2, CDK7 and CDK9 in wildtype and CRBN−/− MOLT4 cells in 6 hours (Fig. 2c, 2d). THAL-SNS-032 led to complete degradation of CDK9 in the wild-type MOLT4 cells, but not in the CRBN−/− cells. In the absence of CRBN (and CDK9 degradation), we can visualize the extent to which THAL-SNS-032 engages CDK9. Interestingly, THAL-SNS-032 showed little to no engagement of CDK9 (or any kinase tested). This suggests that THAL-SNS-032 is degrading CDK9 in a catalytic, sub-stoichiometric fashion, since we see degradation in wildtype cells at concentrations where we see little to no target engagement in CRBN−/− cells.
To further investigate how THAL-SNS-032 induced selective degradation of CDK9 and not CDK1/2/7, we compared target engagement of SNS-032 and THAL-SNS-032 in lysates versus live cells using Kinativ™ proteomics. When SNS-032 and THAL-SNS-032 were introduced into MOLT4 lysates, they showed nearly identical binding profiles, as was expected due to the identical kinase binding motif. (Fig. 1b). In contrast, inhibition profiles in live cells were different. SNS-032 reduced the labeling of CDK6, PCTAIRE1, PCTAIRE2, and PCTAIRE3 by more than 50% when live cells were treated at a concentration of 250nM (Table 1). In contrast, these proteins retained more than 75% labeling when live cells were treated with 250nM THAL-SNS-032 (Table 1), indicating that THAL-SNS-032 achieves intracellular concentrations that are lower than SNS-032, consistent with larger size or efflux from cells. Notably, treatment of live cells with THAL-SNS-032 reduced the labeling of CDK9 by greater than 85%. (Table 1). As reduced labeling in the live cell treatment experiment could result from target engagement and/or target degradation, we also performed live cell Kinativ experiment using CRBN−/− cells. (Table 1). In these cells, CDK9 labeling was rescued, indicating that the loss of CDK9 labeling in wildtype cells was due to reduction in protein levels rather than competition between the compound and the labeling probe (Table 1). Contrastingly, NVP-2 treatment in wildtype and CRBN−/− MOLT4 cells showed the same engagement of CDK9 at around 56.9% and 63% respectively (Table 1, Supplementary Dataset 5).
Table 1.
CDK9 degradation occurs at concentrations where CDK9 target engagement is undetectable.
| Wildtype MOLT4 Cells | CRBN−/− MOLT4 Cells | ||||||
|---|---|---|---|---|---|---|---|
|
| |||||||
| Kinase | Labeling Site | SNS-032 0.25μM |
THAL-SNS-032 0.25μM |
NVP-2 0.25μM |
SNS-032 0.25μM |
THAL-SNS-032 0.25μM |
NVP-2 0.25μM |
|
| |||||||
| CDK9 | Lys2 | 34.1 | 85 | 56.9 | 15.9 | 30.7 | 63 |
| CDK6 | Lys2 | 65.3 | 11.1 | −10 | 73.8 | 6.6 | −8.6 |
| PCTAIRE1,PCTAIRE3 | Lys2 | 54.2 | 16.3 | −30.5 | 66.3 | 11.4 | −5.2 |
| PCTAIRE2 | Lys2 | 70.9 | 18.7 | 8.1 | 76.4 | 23.7 | 10.3 |
| PCTAIRE2,PCTAIRE3 | Lys1 | 70.4 | 22.1 | −4.7 | 75.4 | 16 | −15 |
| GSK3A | Lys2 | 31.6 | 41.3 | 5.8 | 40.2 | 33.8 | 10 |
Top targets of SNS-032, THAL-SNS-032, and NVP-2 in wildtype and CRBN−/− MOLT4 cells as percent inhibited. Full datasets in Supplementary Datasets 4 and 5.
NVP-2 and THAL-SNS-032 exhibit anti-proliferative effects
We next wanted to compare the anti-proliferative consequences of CDK9 degradation versus CDK9 inhibition. We found that THAL-SNS-032 inhibits proliferation of MOLT4 cells at lower concentrations (IC50 = 50 nM) than SNS-032 (IC50 = 173 nM) but is less potent than the selective CDK9 inhibitor NVP-2 (IC50 = 9 nM) (Fig. 3a). The antiproliferative activity of THAL-SNS-032 is dependent on the presence of CRBN, with CRBN−/− cells nearly 100-fold less sensitive to the degrader (IC50 = 3.63 μM), whereas the inhibitors show anti-proliferative activity regardless of CRBN status (Fig. 3a). Furthermore, THAL-SNS-032 exhibited more potent inhibition of proliferation as compared to SNS-032 across a panel of eleven different leukemia cancer cell lines (Supplementary Table 2).
Figure 3. THAL-SNS-032 exhibits CRBN-dependent anti-proliferative and pro-apoptotic effects.
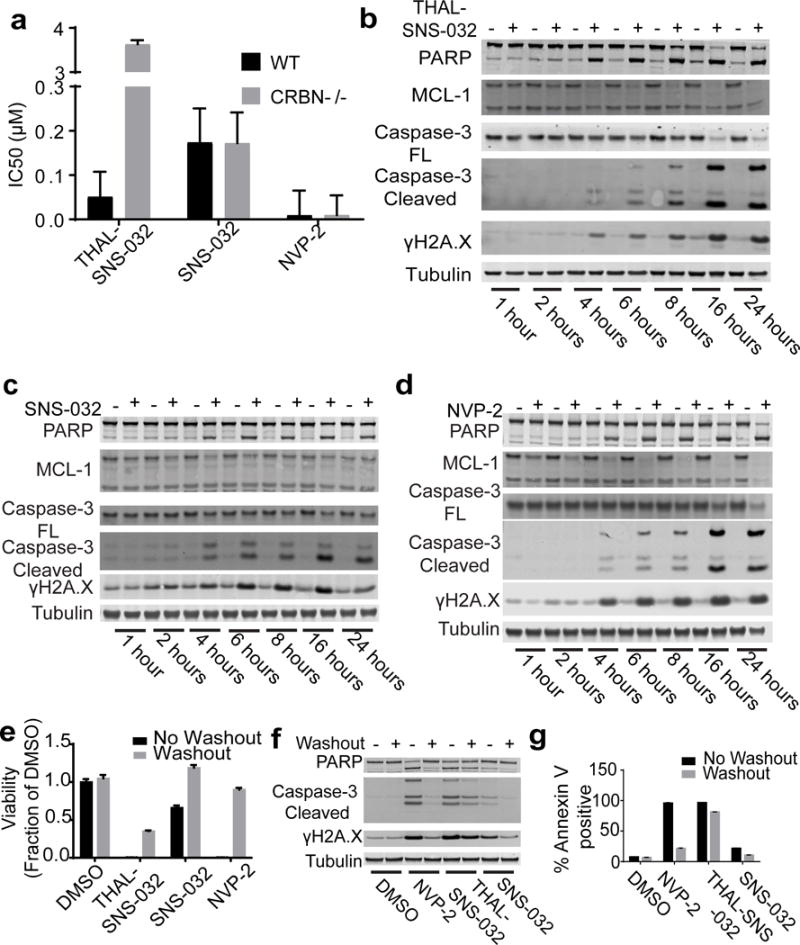
a. Cell viability IC50s for THAL-SNS-032, SNS-032, or NVP-2 on wild-type and CRBN−/− MOLT4 after 72 hours as approximated by using CellTiter Glo (data are presented as means ± s.d. (n=4) biological replicates). b. Immunoblot of proteins shown for the indicated times after treatment with THAL-SNS-032 at 250 nM in wildtype MOLT4 cells. c. Immunoblot of proteins shown for the indicated times after treatment with 250nM NVP-2 in wildtype MOLT4 cells. d. Immunoblot of proteins shown for the indicated times after treatment with 250nM SNS-032 in wildtype MOLT4 cells. e. Viability effect of THAL-SNS-032, SNS-032 or NVP-2 of MOLT4 cells at 250nM concentration of inhibitors comparing 6-hour treatment followed by removal of compound (Washout) or 72 hour of prolonged exposure to compound (no washout) (data are presented as means ± s.d. (n=3) biological replicates) using CellTiter Glo f. Quantification of Annexin V-positive MOLT4 cells treated with compounds at 250 nM after 24 hours with and without washout (data represented as means ± s.d. (n=3) biological replicates). g. Immunoblot of proteins shown after 24-hour treatment of MOLT4 cells with 250nM THAL-SNS-032, NVP-2, or SNS-032 with and without washout after 6 hours. Uncut western blots are in Supplementary Figure 7.
As pharmacological inhibition of CDK9 has been reported to deplete anti-apoptotic proteins to induce apoptosis, we also investigated cleavage of poly(ADP-ribose) polymerase (PARP) and changes in the protein levels of the anti-apoptotic protein MCL-1. Treatment of cells with THAL-SNS-032 resulted in complete CDK9 degradation in 2 hours and induction of apoptosis by 4 hours, as characterized by PARP and Caspase-3 cleavage and loss of MCL-1, which persists for 24 hours (Fig. 3b). Similarly, we found that treatment with NVP-2 or SNS-032 resulted in induction of apoptosis by 4 hours as seen by PARP and Caspase-3 cleavage (Fig. 3c, 3d). MCL-1 loss was observed with NVP-2 treatment, but not SNS-032 treatment (Fig. 3c, 3d).
Next, we performed compound washout experiments to determine the duration of CDK9 degradation. After 6-hour treatment with THAL-SNS-032 and compound washout, we found that CDK9 levels partially rebound by 12 hours after washout, but required a total of 36 hours to return to baseline levels (Supplementary Fig. 3a).
To further investigate the pharmacodynamic effects of this prolonged loss of CDK9 protein, we examined the anti-proliferative effects elicited by THAL-SNS-032. MOLT4 cells were treated with 250nM NVP-2, SNS-032 or THAL-SNS-032 for 6 hours before compound removal by washing cells (Fig. 3e). After 72 hours of growth, THAL-SNS-032 treatment resulted in a more profound decrease in viability after washout compared to NVP-2 or SNS-032 (Fig. 3e). Quantification of apoptotic cells by Annexin V staining revealed that without washout, almost 100% of cells treated with NVP-2 were Annexin V positive, indicating that NVP-2 more potently induced apoptosis than SNS-032. However, while compound washout significantly reduced the degree of apoptosis induced by NVP-2 and SNS-032, this was not the case for THAL-SNS-032 (Fig. 3g), highlighting the prolonged effect of degradation over inhibition.
Consistent with enhanced anti-proliferative effects after CDK9 degradation, we observed increased levels of PARP cleavage, Caspase-3 cleavage and ɣH2A.X activation following compound washout (Fig. 3f). To determine if the loss of CDK9 was responsible for the increase in apoptosis, we treated cells with THAL-SNS-032, NVP-2, or THAL-SNS-032 and NVP-2 in combination, so that NVP-2 will compete with THAL-SNS-032 for the active site of CDK9 and therefore prevent CDK9 degradation. Strikingly, following washout of the co-treatment of THAL-SNS-032 and NVP-2, we observed PARP cleavage and Caspase-3 cleavage analogous to NVP-2 alone following washout, indicating that blocking CDK9 binding site with NVP-2 does indeed ablate THAL-SNS-032 activity (Supplementary Fig. 3b).
THAL-SNS-032 and NVP-2 exhibit transcription inhibition
Due to the important role of CDK9 kinase activity in promoting transcriptional elongation, we asked if small molecule-induced degradation versus inhibition would elicit similar effects on transcription. We first analyzed the effects that THAL-SNS-032 had on phosphorylation of the CTD of RNA Pol II, and found that THAL-SNS-032 inhibited phosphorylation of Serine 2 in a concentration and time-dependent manner, while Serine 5 and Serine 7 phosphorylation were largely unaffected (Fig. 4a, Supplementary Fig. 4a). Additionally, we found that loss of Ser2 was highly dependent on the presence of CRBN, indicating that degradation was necessary for this phenotype (Fig. 4a). These effects were due to degradation of CDK9 and not co-degradation of super-elongation complex members, as we did not observe significant changes in protein levels of Cyclin T1, ELL, AFF4, or ENL until late timepoints (Supplementary Fig. 4b).
Figure 4. THAL-SNS-032 exhibits transcriptional effects consistent with a selective CDK9 inhibitor.
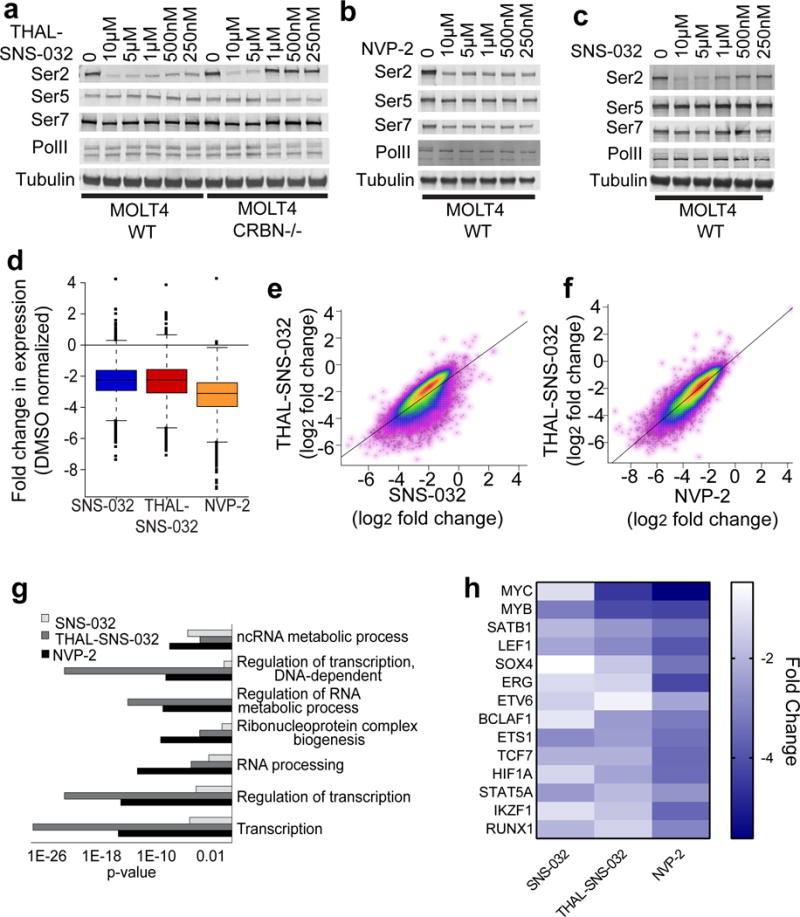
a. Immunoblot of proteins shown after treatment of wildtype and CRBN−/− MOLT4 cells with THAL-SNS-032 at the concentrations indicated for 6 hours. b. Immunoblot of proteins shown after treatment of wildtype MOLT4 cells with NVP-2 at the concentrations indicated for 6 hours. c. Immunoblot of proteins shown after treatment of wildtype MOLT4 cells with SNS-032 at the concentrations indicated for 6 hours. d. Box plot analysis of changes to gene expression levels in MOLT4 cells after treatment with 250nM THAL-SNS-032, SNS-032 or NVP-2 for 6 hours e. Scatter plots showing the correlation of transcriptional changes in MOLT4 cells when treated with THAL-SNS-032 or SNS-032 at concentrations of 250 nM. f. Scatter plots showing the correlation of transcriptional changes in MOLT4 cells when treated with 250nM THAL-SNS-032 or 250nM NVP-2. g. p-value resulting from GO term analysis of genes downregulated by treatment with NVP-2 (1018 genes), THAL-SNS-032 (1026 genes) or SNS-032 (1013 genes). h. Heatmap of gene expression changes to the core regulatory circuitry genes after treatment with NVP-2, THAL-SNS-032, or SNS-032. Uncut western blots are in Supplementary Figure 7.
Like THAL-SNS-032, we found that phosphorylation of RNA Pol II CTD residues serine 2,5, and 7 were inhibited in a concentration dependent manner after treatment with NVP-2 or SNS-032, but that Serine 2 showed the largest decrease in phosphorylation (Fig. 4b, 3c, Supplementary Fig. 4c, 4d). Loss of Ser2 phosphorylation, a mark of transcriptional elongation, likely indicates defects in productive transcriptional elongation and gene expression. To determine the effect of THAL-SNS-032 and NVP-2 on steady-state mRNA levels, we performed RNA-sequencing (mRNA-seq) analysis from MOLT4 cells treated for 6 hours with 250nM THAL-SNS-032, NVP-2 or SNS-032, using synthetic mRNA spike-in for normalization32, 33. Cells treated with any of these compounds exhibited significant downregulation of gene expression in general (Fig. 4d, Supplementary Fig. 4e, 4f, 4g, 4h), with NVP-2 treatment inducing the largest effect on global mRNA levels. To investigate whether treatment with these molecules resulted in differential effects on specific mRNA levels, we examined the correlations between changes in gene expression induced by the three compounds. While THAL-SNS-032 and SNS-032 gene expression changes correlated with an R value of 0.7199, THAL-SNS-032 correlated more strongly with NVP-2 gene expression changes with an R value of 0.866 from Pearson correlation coefficients. (Fig 4e, 4f). Additionally, unsupervised hierarchical clustering analysis also showed that NVP-2 and THAL-SNS-032 cluster together, while SNS-032 clustered further away (Supplementary Fig 4e). Thus, the transcriptional effects of THAL-SNS-032 are more similar to those achieved with a selective CDK9 inhibitor than a pan-CDK inhibitor, consistent with our data showing that THAL-SNS-032 preferentially degrades CDK9 over other kinases and SNS-032 could have contributions from CDK7 inhibition, which would induce a different transcriptional profile. Nevertheless, NVP-2 and THAL-SNS-032 induced some differences in transcriptional response, which merit further investigation.
To better understand the differences between treatment with SNS-032, THAL-SNS-032 and NVP-2, we subjected the 10% most down-regulated genes (1061 genes) to gene ontology (GO) analysis. The top seven GO terms enriched with NVP-2 treatment per p-value are transcription, regulation of transcription, ribonucleoprotein complex biogenesis, regulation of RNA metabolic process, regulation of transcription, DNA-dependent, and ncRNA metabolic process (Fig. 4g). We observed a stronger effect with THAL-SNS-032 than NVP-2 or SNS-032 on several of these GO terms, most notably transcription and regulation of transcription. SNS-032 induced significant changes to all the above gene ontology classes, but to a lesser degree than either NVP-2 or THAL-SNS-032.
We were interested in the core regulatory circuitry (CRC) genes, transcription factors that regulate their own transcription to form a circuitry loop34, 35, due to their central role in driving transcription28. We found that NVP-2 had a profound effect, inducing a 2- to 4- log2-fold change in most CRC genes (Fig. 4h). THAL-SNS-032 also induced changes in most CRC genes, but to a lesser extent than NVP-2. SNS-032 treatment resulted in overall downregulation of the CRC genes, but had the least consistent degree of change. As confirmation, we analyzed mRNA expression levels of MYB and RUNX1 in wildtype and CRBN−/− MOLT4 cells treated with SNS-032, THAL-SNS-032 or NVP-2, as these are genes that are essential for the core regulatory transcription in many leukemia cells10, 35, 36 and make up part of the CRC. Consistent with our mRNA-seq data, we found that THAL-SNS-032, SNS-032 and NVP-2 induced significant reductions in mRNA levels of MYB and RUNX1. Importantly, the transcriptional effects of THAL-SNS-032 were CRBN dependent (Supplementary Fig. 4i).
THAL-SNS-032 and NVP-2 diminish elongating polymerase II
Since CDK9 plays a role in releasing Pol II from paused sites and in promoting elongation, we studied the effects of NVP-2 and THAL-SNS-032 on Pol II localization genome-wide using Pol II ChIP-seq, with spike-in normalization37. We found that both CDK9 degradation and competitive inhibition of CDK9 resulted in comparable increased levels of promoter-proximal paused Pol II with concurrent reductions in the levels of Pol II throughout the gene body (metagene plot in Fig. 5a, Supplementary Fig. 5a, left and PRCC locus in Fig. 5b, left). As a model gene, we examined PRCC, a gene that showed marked mRNA reduction with THAL-SNS-032 treatment. At this gene locus, we observed that Pol II signal was increased at the transcription start site (TSS) but significantly decreased throughout the gene body after THAL-SNS-032 treatment (Fig. 5b, left). This was like the NVP-2 signature at this gene, although NVP-2 treatment caused a more robust decrease in gene body Pol II occupancy. While SNS-032 treatment produced a similar increase in Pol II at the TSS-associated peak at the PRCC locus, levels of Pol II in the gene body were not reduced to the same extent as with THAL-SNS-032 and NVP-2 treatment (Fig. 5b, left). Loss of Pol II signal from the gene body was also observed at the MYC, MYB, and RUNX1 loci (Supplementary Fig. 5c, 5d, 5e, left).
Figure 5. THAL-SNS-032 diminishes elongating polymerase II.
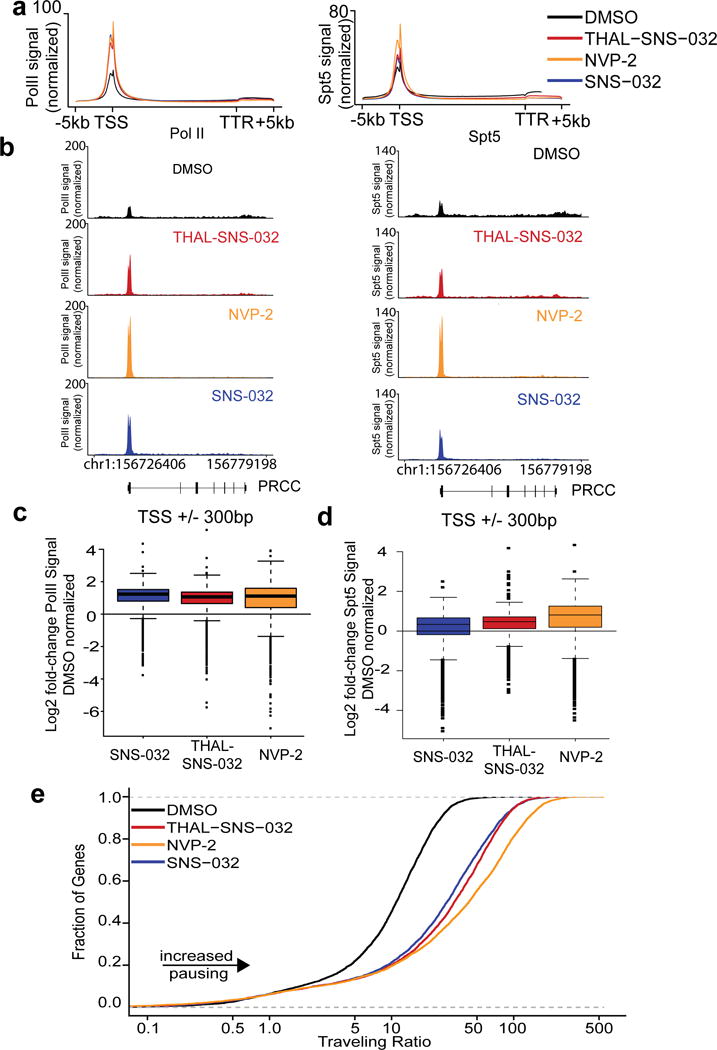
a. Metagene representation of global Pol II (left) or Spt5 (right) occupancy at gene bodies after 250 nM treatment with THAL-SNS-032 (red), SNS-032 (blue), NVP-2 (orange), or DMSO vehicle (black) in MOLT4 cells. b. Pol II (left) or Spt5 (right) occupancy at PRCC gene after treatment with THAL-SNS-032, NVP-2 and SNS-032 normalized to spike-in controls. c. Box plots of Pol II signal at transcriptional start sites (TSS) as normalized to DMSO treatment. Boxes in depicted boxplots represent the first to third quartiles and whiskers represent 1.5X the interquartile range. Data points outside this range are identified by individual points. d. Box plots of Spt5 signal at transcription start sites (TSS) as normalized to DMSO treatment. Boxes in depicted boxplots represent the first to third quartiles and whiskers represent 1.5X the interquartile range. Data points outside this range are identified by individual points. e. Distribution of the Pol II bound genes with a given Traveling Ratio.
We next wanted to compare the impact of CDK9 inhibition and degradation on the genome-wide localization of DSIF7. We performed ChIP-seq for SPT5, a component of the DSIF complex, and found that treatment with THAL-SNS-032, NVP-2, and SNS-032 resulted in modest increases in TSS-associated SPT5, as seen by metagene analysis (Fig. 5a, right, Supplementary Fig. 5b); this was expected, as SPT5 associates with Pol II. We confirmed that the same changes occurred at the PRCC locus (Fig. 5b, right). SPT5 signal was consistently depleted from the gene body at MYC, MYB, and RUNX1 loci (Supplementary Fig. 5c, 5d, 5e, right). Thus, CDK9 inhibition and degradation resulted in SPT5 loss from the gene body.
Finally, quantitative analysis of Pol II levels confirmed an accumulation of Pol II at the transcription start site upon compound treatment (Fig. 5c). A similar increase in Spt5 localization was observed at the transcription start sites with all three compounds (Fig. 5d). We also calculated traveling ratios for all conditions by calculating the ratio of promoter associated Pol II to gene body-associated Pol II38. Interestingly, all three compounds result increased promoter proximal pausing, as seen by a substantial shift to the right (Fig. 5e), although NVP-2 treatment produced the largest change in traveling ratio.
Discussion
CDK9 is an attractive target for cancers that exhibit aberrant transcription, especially those driven by proto-oncogenes such as c-MYC. Although several CDK9 inhibitors have been tested in clinical trials, none have progressed further, likely due to toxicity from off-target inhibition. Here, we report the design and characterization of THAL-SNS-032, a bivalent molecule consisting of a multi-targeted CDK ligand conjugated to thalidomide via a PEG linker as well as the characterization of a selective CDK9 inhibitor, NVP-2. We find that inhibition of CDK9 and degradation of CDK9 resulted in similar steady state mRNA expression alterations, consistent with non-selective CDK9 inhibitors previously reported. Additionally, we find that Pol II localization was altered by THAL-SNS-032 treatment in a similar but less dramatic fashion than by the specific CDK9 inhibitor NVP-2. Further studies will be required to understand whether pharmacological degradation of CDK9 will be similarly tolerated as CDK9 inhibition.
Unexpectedly, THAL-SNS-032 induced rapid and specific degradation of CDK9, even though the parent molecule inhibits several CDKs, including CDK2 and CDK7. Using quantitative chemical proteomics approaches, we showed that at 250nM, THAL-SNS-032 does not achieve measurable occupancy of any of the other kinase targets of SNS-032 in cells, even though these targets are engaged in cell lysates. This is presumably because the larger molecular size of THAL-SNS-032 results in poor cell penetration and/or drug pump-mediated efflux of the compound. However, because THAL-SNS-032 may be able to catalytically recruit CRBN to CDK9, the low intracellular concentrations are sufficient to achieve degradation of CDK9. While our data suggests that selectivity is induced by the ability to act at sub-stoichiometric doses, other factors, including the efficiency of induced ubiquitination through differentially accessible lysine residues may also contribute to selectivity.
While THAL-SNS-032 and two other traditional CDK9 inhibitors rapidly induced apoptosis, only THAL-SNS-032 retained cytotoxic effects after washout, likely due to the degradation of CDK9. As such, THAL-SNS-032 may have therapeutic advantages over older generations of CDK9 inhibitors. Further studies will be necessary to determine the pharmacokinetic and pharmacodynamic properties of this compound, as well as the types of cancers that are most sensitive to CDK9 degradation.
THAL-SNS-032 is a novel tool that allowed us to interrogate the consequences of acute CDK9 loss. Previous studies have used genetic means, such as knockouts or knockdowns, to remove CDK9, but these approaches cannot capture the immediate effects of CDK9 loss that can resolved using this novel chemical-induced degradation strategy. We anticipate thalidomide conjugation to small molecules will allow us to better understand the relationship between chemical inhibition and genetic deletion. Furthermore, this compound can be utilized to interrogate the kinetics of transcription initiation and elongation.
In sum, we have characterized a selective CDK9 inhibitor and demonstrated that conjugation of a multi-target inhibitor to thalidomide can result in the generation of a selective chemical degrader with durable pharmacological effects. This strategy may be useful in enhancing the selectivity of other multi-target inhibitors in the future. There are several gene families, including histone acetyltransferase (HATs), histone deacetylases (HDACs), dehydrogenases and phosphatases where only moderately selective binders currently exist, and this thalidomide conjugation strategy may provide a starting point for the development of selective degraders. Using several different CDK9-targeted compounds, we compared degradation and inhibition and found that while degradation has the advantage of a durable effect, inhibition resulted in more rapid cellular effects.
Online Methods
Cell lines
All cells (T. Looke Lab, DFCI) were cultured in RPMI-1640 media supplemented with 10% FBS and 1% Penicillin/Streptomycin in a 37°C incubator with 5% CO2. All cell lines were tested for mycoplasma infection. A panel of reported leukemia cell lines were utilized to get a trend of the anti-proliferative effects of the compounds utilized.
Immunoblotting
MOLT4 cells were lysed in RIPA buffer (50mM Tris-HCl, 150 mM NaCl, 1% NP-40, 0.5% sodium deoxycholate, and 0.1% SDS, pH 7.4 ± 0.2) with Protease Inhibitor (Roche), Phosstop Phosphatase Inhibitor (Roche), and 2.5 U/mL Universal Nuclease for Cell Lysis (Pierce) by incubating on ice 30 minutes. The lysates were clarified by spinning at 21,000g for 30 minutes at 4°C and the concentration of the lysate was determined using BCA protocol (Pierce). Primary antibodies in this study include: CDK9 (Cell Signaling Technology, 2316), CDK7 (Cell Signaling Technology, 2916), CDK2 (Bethyl Labs, A301-812), CDK1 (Bethyl Labs, A303-663), Cereblon (Novus Biologicals, NBP1-91810), Tubulin (Cell Signaling Technology, 3873), PARP (Cell Signaling Technology, 9542), MCL-1 (Santa Cruz Biotechnology, sc-819), Caspase-3 Full Length (Cell Signaling Technology,9668), Caspase-3 Cleaved (Cell Signaling Technology, 9661), ɣH2A.X (Cell Signaling Technology, 9718), Phospho-CTD Ser2 (Millipore, 04-1571), Phospho-CTD Ser5 (Millipore, 04-1572), Total Pol II (Santa Cruz Biotechnology, sc-899), Cyclin T1 (Cell Signaling Technology, 8744), CDK10 (Cell Signaling Technology, 36106), ENL (Cell Signaling Technology, 14893), AFF4 (Abcam, ab103586), and ELL (Cell Signaling Technology, 14468S). Secondary antibodies used were infra-red labeled antibodies (LI-COR) and blots were imaged on an Odyssey CLX imager.
In vitro Kinase Assays
Adapta® Eu kinase assays were conducted for CDK7/CycH/MNAT1 and CDK9/CycT1 at Life Technologies using Km ATP concentrations. Lanthascreen® Eu kinase binding assays were conducted for CDK8/CycC, CDK14/CycY, and CDK16/CycY at Life Technologies using Km ATP concentrations. Z’LYTE™ kinase assays were conducted for CDK1/CycB, CDK2/CycA, CDK5/p25, and DYRK1B at Life Technologies using Km ATP concentrations.
Pulldown Assays
Wildtype or CRBN−/− MOLT4 cells were treated with DMSO, NVP-2, SNS-032 or THAL-SNS-032 at 1μM, 500nM or 250nM for 6 hours. Cells were pelleted, washed with 1X PBS and resuspended in 50 mM Tris-HCl pH 8.0, 150 mM NaCl, 1% Nonidet P-40, 5 mM EDTA, 1mM DTT, and protease/phosphatase cocktails. Lysates were clarified and input samples were taken before 1μM biotinylated-AT7519 probe was added at rotated overnight at 4°C. Lysates with probe were then incubated with streptavidin resin for 3 hours at 4°C. Beads were washed with lysis buffer 5 times and resuspended in 2X LDS load dye. Samples were boiled at 95°C for 5 minutes before they were loaded onto SDS-PAGE gels and subjected to immunoblotting.
Proliferation assays
Proliferation assays were performed by treating MOLT4 and CRBN−/− MOLT4 cells with THAL-SNS-032, SNS-032, or NVP-2 at concentrations indicated for 72 hours. Anti-proliferative effects of compounds were assessed using Cell Titer Glo assay kit (Promega). IC50s were determined using Graphpad Prism non-linear regression curve fit. To determine the effect of washout, MOLT4 and CRBN−/− MOLT4 cells were treated with 250nM THAL-SNS-032, SNS-032, NVP-2 or DMSO. After 6 hours, compound was washed from cells by washing cells with media three times where indicated. Cells were allowed to grow for another 66 hours (72-hour total) and assayed for anti-proliferation using Cell Titer Glo assay kit as above.
Flow Cytometry of apoptotic cells
Cells were treated with 250nM compound for 6 hours before being washed three times with media to remove compound where indicated. After an additional 24 hours’ cells were pelleted and washed with PBS. Cells were pelleted at 800rpm for 5 minutes before aspirating the PBS off. Cells were resuspended in Annexin V binding buffer (10mM HEPES, 140mM NaCl, 2.5mM CaCl2, pH 7.4) with FITC annexin V and incubated at room temperature. Propidium Iodide was added immediately before flow cytometry analysis. Analysis was performed on a FACS LSRII (BD Biosciences) instrument and processed on FlowJo (Treestar).
Kinativ Experimental Procedures
ATP and ADP Acyl-Nucleotide Probes
ATP and ADP Acyl-nucleotide probes were synthesized as described previously39.
Sample Preparation
The cell pellets were lysed by sonication in lysis buffer (50 mM HEPES, pH 7.5, 150 mM NaCl, 0.1% Triton-X-100, phosphatase inhibitors [Cocktail II AG Scientific #P-1518]). After lysis, the samples were cleared by centrifugation, and the supernatant collected for probe-labeling. For live cell treatment, 50 μL of a 10X aqueous solution of the desthiobiotin-adenosine triphosphate-acylphosphate probe (ATP probe) was added to each sample for a final probe concentration of 20 μM, and samples were incubated with probe for 10 minutes. For lysate profiling, clarified lysate was first gel-filtered using Biorad Econo-Pac® 10G columns. 5 μL of compound was added from 100X stock solutions in dimethyl sulfoxide (DMSO) to 445 uL of lysate in duplicate. For control samples, 5 μL of DMSO was added. After 15-minute incubation, 50 μL of a 10X aqueous solution of the desthiobiotin-adenosine triphosphate-acylphosphate probe (ATP probe) was added to each sample for a final probe concentration of 20 μM, and samples were incubated with probe for an additional 10 minutes.
Samples were prepared for MS analysis as described previously2. Briefly, probe-labeled lysates were denatured and reduced (6 M urea, 10 mM DTT, 65°C, 15 min), alkylated (40 mM Iodoacetamide, 37°C, 30 min), and gel filtered (Biorad Econo-Pac® 10G) into 10 mM ammonium bicarbonate, 2 M urea, 5 mM methionine. The desalted protein mixture was digested with trypsin (0.015 mg/ml) for 1 hr at 37°C, and desthiobiotinylated peptides captured using 12.5 μl high-capacity streptavidin resin (Thermo Scientific). Captured peptides were then washed extensively, and probe-labeled peptides eluted from the streptavidin beads using two 35-μl washes of a 50% CH3CN/water mixture containing 0.1% TFA at room temperature.
LC-MS/MS Analysis
Samples were analyzed by LC-MS/MS as described previously27. Samples were analyzed on Thermo LTQ ion trap mass spectrometers coupled with Agilent 1100 series micro-HPLC systems with autosamplers, essentially as described, using a custom target list comprising 352 unique kinase peptides that had been previously identified during the characterization of various in data dependent mode27, 40.
Data Analysis
For signal extraction/quantitation, typically up to four ions were selected for based on their presence, intensity, and correlation to the reference MS/MS spectrum. The resulting chromatographic peaks from each run were then integrated and the integrated peak areas used to determine % inhibition values relative to control runs.
For each peptide quantitated, the MS signal for the adult myocyte samples relative to the MS signal for the neonatal myocyte samples was expressed as fold-change using the following equation:
All data points were visually verified, as were all datapoints showing variability outside of normal limits. Significance of datapoints changing more than 2-fold were determined according to the Student T-test (Excel 2010):
Array1: MS signals from control samples
Array2: MS signals from treated samples
Tails = 1 (one-tailed distribution)
Type = 2 (two-sample equal variance)
In cases where scores <0.04, the fold-change was considered significant.
In cases where the peptide signals in the adult myocyte samples were undetectable (noise), the fold-change value was preceded by “>”.
Quantitative Proteomics
Quantitative proteome maps were acquired essentially as described previously41 Multiplexed proteomics was done applying isobaric labeling with 10plex tandem mass tag (TMT) reagents29 and performed on an Orbitrap Fusion mass spectrometer (Thermo Fisher Scientific) using the SPS-MS3 method42, 43. All data analysis was carried out using the R statistical framework44. In short, reporter ion intensities were normalized and scaled using in house scripts. Proteins quantified with a minimum of two unique peptides were considered for statistical analysis. Data were subjected to a moderated t-test to assess statistical significance as implemented in the limma package45.
RNA extraction and qPCR
MOLT4 cells were treated with 250nM THAL-SNS-032, SNS-032, NVP-2, or DMSO for 6 hours. RNA was extracted using RNeasy Plus Mini Kit (Qiagen) and quantitated. Equal amounts of RNA were used for cDNA synthesis using Superscript III First-Strand Synthesis (Life Technologies). cDNA was diluted 1:10 and 2μL used as template for taqman qPCR using probes: GAPDH (Hs02758991_g1), MYB (Hs00920556_m1), RUNX1 (Hs01021970_m1), CDK1 (Hs00938777_m1), CDK2 (Hs01548894_m1), or CDK7 (Hs00361486_m1).
RNA extraction and synthetic RNA spike-in for RNA-Seq
5×10⁵ MOLT4 Cells were treated for 6 hours with either 250nM THAL-SNS-032, SNS-032, NVP-2 or DMSO at equal concentration as vehicle control. Total RNA was isolated using the mirVana RNA isolation kit and ERCC spike in controls (life technologies) were added to cell count normalized organic RNA extracts at the earliest point in the RNA isolation protocol. To reduce residual DNA contaminations, RNA extracts were treated with RNAase-free DNAse I (Ambion). Library prep was conducted using TruSeq Stranded mRNA Library Prep Kit.
RNA-seq Analysis
To determine transcript abundance, fastq sequencing files were first aligned to the human genome build HG19 using HISAT with default parameters. FPKM values were determined for assembled transcripts using cuff quant and cuffnorm from the cufflinks pipeline46. FPKM values were then normalized to spike-in RNAs as described previously33. Active genes were defined as those with FPKM values greater than 2.
Functional enrichment analysis using DAVID
Top 10% of transcripts sensitive to treatment with 250nM THAL-SNS-032, SNS-032, or NVP-2 were analyzed using DAVID 6.8 at http://david.abcc.ncifcrf.gov/.47, 48
Chromatin Immunoprecipitation
MOLT4 cells were treated with 250nM THAL-SNS-032, SNS-032, or NVP-2 for 2 hours. Cells were crosslinked for 10 minutes at room temperature by adding one-tenth of the volume of formaldehyde to the media. The formaldehyde was quenched by adding one-twentieth volume 1M glycine. Cells were washed three times with PBS and then flash frozen in liquid nitrogen and stored at -80°C. Dyna magnetic beads (Sigma) were blocked with 0.5% BSA in PBS. Beads were then incubated with the indicated antibody at 4°C for 6 hours. For RNA polymerase II, we used Santa Cruz Biotechnology N-20 antibody. For Spt5, we used Santa Cruz Biotechnology H-300.
Crosslinked cells were lysed in 50mM HEPES pH 7.5, 140mM NaCl, 1mM EDTA, 10% glycerol, 0.5% NP-40, and 0.25% Triton X-100. Lysates were pelleted and resuspended in 10 mM Tris-HCl pH 8.0, 200 mM NaCl, 1 mM EDTA, 0.5 mM EGTA. The lysates were again pelleted and resuspended in 50 mM HEPES pH 7.5, 140 mM NaCl, 1 mM EDTA pH 8.0, 1 mM EGTA, 0.1% Na-deoxycholate, 0.1% SDS, and 1% Triton X-100. Cells were sonicated for a total of 3 minutes at a cycle of 1 s on, 4 s off on ice. Sonicated lysates were clarified at 4°C for 15 minutes. Baf3 cell lysates were sonicated in the exact fashion outlined above were added at a ratio of 1:100 to the MOLT4 lysates. The spiked lysates were incubated overnight at 4°C with antibody bound magnetic beads. Beads were washed twice with 50 mM HEPES pH 7.5, 140 mM NaCl, 1 mM EDTA pH 8.0, 1 mM EGTA, 0.1% Na-deoxycholate, 0.1% SDS, and 1% Triton X-100, once with 50 mM HEPES pH 7.5, 500 mM NaCl, 1 mM EDTA pH 8.0, 1 mM EGTA, 0.1% Na-deoxycholate, 0.1% SDS, and 1% Triton X-100, once with 10 mM Tris-HCl pH 8.0, 1 mM EDTA, 250 mM LiCl, 0.5% NP-40, 0.5% Na-deoxycholate, and once with TE pH 8.0. DNA was eluted by adding 50 mM Tris-HCl pH 8.0, 10 mM EDTA, 1% SDS. Crosslinks were reversed overnight by incubating at 65°C overnight. DNA was purified by first digesting RNA and protein using RNase A and Proteinase K treatment, followed by phenol chloroform extraction and ethanol precipitation.
ChIP-Seq Analysis
ChIP-Seq libraries were created per ThruPLEX® DNA-seq library protocol (Rubicon). Libraries were sequenced on an Illumina NextSeq 500 using single-end 150bp reads.
Data source code and accession
ChIP-seq and RNA-seq data sets can be accessed via the GEO Publication Reference ID (GSE89386). Source code used to analyze these datasets can be accessed from the Bradner Laboratory github page (http://github.com/BradnerLab).
Genome and annotation
All analyses were performed using the HG19 assembly (GRCh37) of the human reference genome (ncbi.nlm.nih.gov/assembly/2758/) and RefSeq annotation of genes.
Sequence alignment
ChIP-seq datasets were aligned to the genome using Bowtie2 following all default parameters except –N 1, in order to include only uniquely mapping reads with less than 2 mismatches.
Identifying enriched signal regions
The peak-finding algorithm MACS (Model-based Analysis of ChIP-seq, version 1.4.1)49 was used to identify regions of ChIP-seq signal enriched over the background signal. Background signal was determined from the input sample and a p-value of 1e-9 was used as the cutoff to identify statistically significant peaks.
Cell count normalization
Scale factors were determined by the method described previously50 using chromatin from mouse cells rather than Drosophila. Briefly, the total number of reads aligned to the mouse mm9 genome assembly was used as a normalization factor to scale ChIP-seq datasets produced from equal cell numbers.
Calculating read density
Bamliquidator (https://github.com/BradnerLab/pipeline/wiki/bamliquidator, version 1.0) was used to calculate the ChIP-seq read density over a given genomic coordinate. This program extends reads aligning within the specified region by 200 bp and calculates the reads per base pair, subsequently normalizing by the exogenous genome scaling factor.
Heat map representation of ChIP-seq signal
Heat maps were created for promoter regions (+/− 5 kb from transcription start sites) by dividing each region into 200 bins of 50 bp. The ChIP-seq signal (scaled reads/bp) of each bin is represented by scaled color intensity and each row within a plot represents a unique promoter region. The ordering of rows for heat maps presented together are identical. Meta representation of heat maps represent the average signal for each bin across all rows depicted.
Meta-gene representations of ChIP-seq occupancy
For meta-gene representations of ChIP-seq datasets, genes were separated into upstream (3 kb upstream of the TSS), gene body (TSS to the gene end), and downstream (3 kb downstream of the gene end) regions. Upstream and downstream regions were divided into 60 bins and gene body regions were divided into 200 bins. The ChIP-seq signal (scaled reads/bp) was averaged across all bins and plotted, combining the three regions on a single plot.
RNA Pol II traveling ratio analysis
Traveling ratios were determined by the ratio of RNA Pol II bound at the promoter (ChIP-seq signal +/− 300 bp of the TSS) to RNA Pol II bound within the gene-body (ChIP-seq signal spanning 300 bp downstream of the TSS to 3 kb downstream of the gene end).
Code Availability Statement
Source code used to analyze these datasets can be accessed from the Bradner Laboratory github page (http://github.com/BradnerLab).
Supplementary Material
Acknowledgments
We thank D. Buckley, E. Wang, J. Paulk, and members of the Gray and Bradner laboratories for helpful discussions. This work was supported by the National Institutes of Health (CA179483-03– N.K., N.S.G. and T32GM007753– Z.Z.), the Koch Institute and Dana-Farber/Harvard Cancer Center Bridge Grant (N.K., N.S.G., R.A.Y., C.M.O.),
Footnotes
Accession Numbers. ChIP-seq and RNA-seq data sets can be accessed via the Gene Expression Omnibus (http://www.ncbi.nlm.nih.gov/geo) with Publication Reference ID GSE89386.
Author Contributions. N.S.G., C.M.O., N.K., and T.Z. conceived the project. N.S.G., Y.L., B.J. and T.Z. conceived and directed chemistry effort. Chemical synthesis and small molecule structure determination was performed by T.Z., Y.L, and Z.Z. R.A.Y., N.S.G., C.M.O., M.A.E., G.E.W., and N.K. conceived genomics effort. N.K. and C.M.O. designed and executed cellular biological experimental research with input from N.S.G. and R.A.Y. W.H. and M.B. designed and executed the proteomics efforts. E.S.F. designed and executed statistical analysis of proteomics. T.N. and J.G. designed and executed the Kinativ efforts. M.A.E. designed and performed genomics data analyses. C.M.O., N.K., and N.S.G. co-wrote the paper. All authors edited the manuscript.
Competing financial interests. N.S.G. is a Scientific Founder and member of the Scientific Advisory Board of C4 Therapeutics, Syros Pharmaceuticals and Petra Pharmaceuticals and is the inventor on IP licensed to these entities. J.E.B. is a Scientific Founder of Syros Pharmaceuticals, SHAPE Pharmaceuticals, Acetylon Pharmaceuticals, Tensha Therapeutics (now Roche) and C4 Therapeutics and is the inventor on IP licensed to these entities. J.E.B. is now an executive and shareholder in Novartis AG. R.A.Y. is a Scientific Founder of Syros Pharmaceuticals.
References
- 1.Malumbres M. Cyclin-dependent kinases. Genome Biology. 2014;15:122–122. doi: 10.1186/gb4184. [DOI] [PMC free article] [PubMed] [Google Scholar]
- 2.Dorée M. & Galas, S. The cyclin-dependent protein kinases and the control of cell division. The FASEB Journal. 1994;8:1114–1121. doi: 10.1096/fasebj.8.14.7958616. [DOI] [PubMed] [Google Scholar]
- 3.Sun T, Co NN, Wong N. PFTK1 interacts with cyclin Y to activate non-canonical Wnt signaling in hepatocellular carcinoma. Biochemical and Biophysical Research Communications. 2014;449:163–168. doi: 10.1016/j.bbrc.2014.05.002. [DOI] [PubMed] [Google Scholar]
- 4.Liu Y, Cheng K, Gong K, Fu AKY, Ip NY. Pctaire1 Phosphorylates N-Ethylmaleimide-sensitive Fusion Protein: IMPLICATIONS IN THE REGULATION OF ITS HEXAMERIZATION AND EXOCYTOSIS. Journal of Biological Chemistry. 2006;281:9852–9858. doi: 10.1074/jbc.M513496200. [DOI] [PubMed] [Google Scholar]
- 5.Peng J, Marshall NF, Price DH. Identification of a Cyclin Subunit Required for the Function ofDrosophila P-TEFb. Journal of Biological Chemistry. 1998;273:13855–13860. doi: 10.1074/jbc.273.22.13855. [DOI] [PubMed] [Google Scholar]
- 6.Hirose Y, Ohkuma Y. Phosphorylation of the C-terminal Domain of RNA Polymerase II Plays Central Roles in the Integrated Events of Eucaryotic Gene Expression. Journal of Biochemistry. 2007;141:601–608. doi: 10.1093/jb/mvm090. [DOI] [PubMed] [Google Scholar]
- 7.Wada T, Takagi T, Yamaguchi Y, Watanabe D, Handa H. Evidence that P‐TEFb alleviates the negative effect of DSIF on RNA polymerase II‐dependent transcription. The EMBO Journal. 1998;17:7395–7403. doi: 10.1093/emboj/17.24.7395. [DOI] [PMC free article] [PubMed] [Google Scholar]
- 8.Yamada T, et al. P-TEFb-Mediated Phosphorylation of hSpt5 C-Terminal Repeats Is Critical for Processive Transcription Elongation. Molecular Cell. 2006;21:227–237. doi: 10.1016/j.molcel.2005.11.024. [DOI] [PubMed] [Google Scholar]
- 9.Gilchrist DA, et al. NELF-mediated stalling of Pol II can enhance gene expression by blocking promoter-proximal nucleosome assembly. Genes & Development. 2008;22:1921–1933. doi: 10.1101/gad.1643208. [DOI] [PMC free article] [PubMed] [Google Scholar]
- 10.Huang C-H, et al. CDK9-mediated transcription elongation is required for MYC addiction in hepatocellular carcinoma. Genes & Development. 2014;28:1800–1814. doi: 10.1101/gad.244368.114. [DOI] [PMC free article] [PubMed] [Google Scholar]
- 11.Lu H, et al. Compensatory induction of MYC expression by sustained CDK9 inhibition via a BRD4-dependent mechanism. eLife. 2015;4:e06535. doi: 10.7554/eLife.06535. [DOI] [PMC free article] [PubMed] [Google Scholar]
- 12.Rahl PB, et al. c-Myc Regulates Transcriptional Pause Release. Cell. 2010;141:432–445. doi: 10.1016/j.cell.2010.03.030. [DOI] [PMC free article] [PubMed] [Google Scholar]
- 13.Okuda H, Takahashi S, Takaori-Kondo A, Yokoyama A. TBP loading by AF4 through SL1 is the major rate-limiting step in MLL fusion-dependent transcription. Cell Cycle. 2016:1–11. doi: 10.1080/15384101.2016.1222337. [DOI] [PMC free article] [PubMed] [Google Scholar]
- 14.Samarakkody A, et al. RNA polymerase II pausing can be retained or acquired during activation of genes involved in the epithelial to mesenchymal transition. Nucleic Acids Research. 2015;43:3938–3949. doi: 10.1093/nar/gkv263. [DOI] [PMC free article] [PubMed] [Google Scholar]
- 15.Chao S-H, et al. Flavopiridol Inhibits P-TEFb and Blocks HIV-1 Replication. Journal of Biological Chemistry. 2000;275:28345–28348. doi: 10.1074/jbc.C000446200. [DOI] [PubMed] [Google Scholar]
- 16.König A, Schwartz GK, Mohammad RM, Al-Katib A, Gabrilove JL. The Novel Cyclin-Dependent Kinase Inhibitor Flavopiridol Downregulates Bcl-2 and Induces Growth Arrest and Apoptosis in Chronic B-Cell Leukemia Lines. Blood. 1997;90:4307–4312. [PubMed] [Google Scholar]
- 17.Sedlacek H, Czech J, Naik R, Kaur G, Worland P, Losiewicz M, Parker B, Carlson B, Smith A, Senderowicz A, Sausville E. Flavopiridol (L86 8275; NSC 649890), a new kinase inhibitor for tumor therapy. International Journal of Oncology. 1996;9:1143–1168. doi: 10.3892/ijo.9.6.1143. [DOI] [PubMed] [Google Scholar]
- 18.Chen R, Keating MJ, Gandhi V, Plunkett W. Transcription inhibition by flavopiridol: mechanism of chronic lymphocytic leukemia cell death. Blood. 2005;106:2513–2519. doi: 10.1182/blood-2005-04-1678. [DOI] [PMC free article] [PubMed] [Google Scholar]
- 19.Vladimir K, Stjepan U. Cyclin-Dependent Kinase Inhibitors as Anticancer Drugs. Current Drug Targets. 2010;11:291–302. doi: 10.2174/138945010790711950. [DOI] [PubMed] [Google Scholar]
- 20.Misra RN, et al. N-(Cycloalkylamino)acyl-2-aminothiazole Inhibitors of Cyclin-Dependent Kinase 2. N-[5-[[[5-(1,1-Dimethylethyl)-2-oxazolyl]methyl]thio]-2-thiazolyl]-4- piperidinecarboxamide (BMS-387032), a Highly Efficacious and Selective Antitumor Agent. Journal of Medicinal Chemistry. 2004;47:1719–1728. doi: 10.1021/jm0305568. [DOI] [PubMed] [Google Scholar]
- 21.Winter GE, et al. Phthalimide conjugation as a strategy for in vivo target protein degradation. Science. 2015;348:1376–1381. doi: 10.1126/science.aab1433. [DOI] [PMC free article] [PubMed] [Google Scholar]
- 22.Lu J, et al. Hijacking the E3 Ubiquitin Ligase Cereblon to Efficiently Target BRD4. Chemistry & Biology. 2015;22:755–763. doi: 10.1016/j.chembiol.2015.05.009. [DOI] [PMC free article] [PubMed] [Google Scholar]
- 23.Lai AC, et al. Modular PROTAC Design for the Degradation of Oncogenic BCR-ABL. Angewandte Chemie International Edition. 2016;55:807–810. doi: 10.1002/anie.201507634. [DOI] [PMC free article] [PubMed] [Google Scholar]
- 24.Rodríguez-Molina Juan B, Tseng Sandra C, Simonett Shane P, Taunton J, Ansari Aseem Z. Engineered Covalent Inactivation of TFIIH-Kinase Reveals an Elongation Checkpoint and Results in Widespread mRNA Stabilization. Molecular Cell. 2016;63:433–444. doi: 10.1016/j.molcel.2016.06.036. [DOI] [PMC free article] [PubMed] [Google Scholar]
- 25.Poss Zachary C, et al. Identification of Mediator Kinase Substrates in Human Cells using Cortistatin A and Quantitative Phosphoproteomics. Cell Reports. 2016;15:436–450. doi: 10.1016/j.celrep.2016.03.030. [DOI] [PMC free article] [PubMed] [Google Scholar]
- 26.Kanin EI, et al. Chemical inhibition of the TFIIH-associated kinase Cdk7/Kin28 does not impair global mRNA synthesis. Proceedings of the National Academy of Sciences. 2007;104:5812–5817. doi: 10.1073/pnas.0611505104. [DOI] [PMC free article] [PubMed] [Google Scholar]
- 27.Patricelli Matthew P, et al. In Situ Kinase Profiling Reveals Functionally Relevant Properties of Native Kinases. Chemistry & Biology. 2011;18:699–710. doi: 10.1016/j.chembiol.2011.04.011. [DOI] [PMC free article] [PubMed] [Google Scholar]
- 28.Winter GE, et al. BET Bromodomain Proteins Function as Master Transcription Elongation Factors Independent of CDK9 Recruitment. Molecular Cell. 2017;67:5–18.e19. doi: 10.1016/j.molcel.2017.06.004. [DOI] [PMC free article] [PubMed] [Google Scholar]
- 29.McAlister GC, et al. Increasing the Multiplexing Capacity of TMTs Using Reporter Ion Isotopologues with Isobaric Masses. Analytical Chemistry. 2012;84:7469–7478. doi: 10.1021/ac301572t. [DOI] [PMC free article] [PubMed] [Google Scholar]
- 30.Barsanti PA, et al. Pyridine and pyrzaine derivatives as protein kinase modulators. PCT/JP2008/073864 (WO/2011/012661) International Patent. 2011
- 31.Zhang T, et al. Covalent targeting of remote cysteine residues to develop CDK12 and CDK13 inhibitors. Nat Chem Biol. 2016;12:876–884. doi: 10.1038/nchembio.2166. [DOI] [PMC free article] [PubMed] [Google Scholar]
- 32.Lin Charles Y, et al. Transcriptional Amplification in Tumor Cells with Elevated c-Myc. Cell. 2012;151:56–67. doi: 10.1016/j.cell.2012.08.026. [DOI] [PMC free article] [PubMed] [Google Scholar]
- 33.Lovén J, et al. Revisiting Global Gene Expression Analysis. Cell. 2012;151:476–482. doi: 10.1016/j.cell.2012.10.012. [DOI] [PMC free article] [PubMed] [Google Scholar]
- 34.Boyer LA, et al. Core Transcriptional Regulatory Circuitry in Human Embryonic Stem Cells. Cell. 2005;122:947–956. doi: 10.1016/j.cell.2005.08.020. [DOI] [PMC free article] [PubMed] [Google Scholar]
- 35.Sanda T, et al. Core Transcriptional Regulatory Circuit Controlled by the TAL1 Complex in Human T Cell Acute Lymphoblastic Leukemia. Cancer Cell. 2012;22:209–221. doi: 10.1016/j.ccr.2012.06.007. [DOI] [PMC free article] [PubMed] [Google Scholar]
- 36.Mitra P, Yang RM, Sutton J, Ramsay RG, Gonda TJ. CDK9 inhibitors selectively target estrogen receptor-positive breast cancer cells through combined inhibition of MYB and MCL-1 expression. 2016 doi: 10.18632/oncotarget.6997. [DOI] [PMC free article] [PubMed] [Google Scholar]
- 37.Bonhoure N, et al. Quantifying ChIP-seq data: a spiking method providing an internal reference for sample-to-sample normalization. Genome Research. 2014 doi: 10.1101/gr.168260.113. [DOI] [PMC free article] [PubMed] [Google Scholar]
- 38.Wade JT, Struhl K. The transition from transcriptional initiation to elongation. Current opinion in genetics & development. 2008;18:130–136. doi: 10.1016/j.gde.2007.12.008. [DOI] [PMC free article] [PubMed] [Google Scholar]
- 39.Patricelli MP, et al. Functional Interrogation of the Kinome Using Nucleotide Acyl Phosphates. Biochemistry. 2007;46:350–358. doi: 10.1021/bi062142x. [DOI] [PubMed] [Google Scholar]
- 40.Nomanbhoy TK, et al. Chemoproteomic Evaluation of Target Engagement by the Cyclin-Dependent Kinase 4 and 6 Inhibitor Palbociclib Correlates with Cancer Cell Response. Biochemistry. 2016;55:5434–5441. doi: 10.1021/acs.biochem.6b00629. [DOI] [PubMed] [Google Scholar]
- 41.Edwards A, Haas W. In: Proteomics in Systems Biology: Methods and Protocols. Reinders J, editor. Springer New York; New York, NY: 2016. pp. 1–13. [Google Scholar]
- 42.McAlister GC, et al. MultiNotch MS3 Enables Accurate, Sensitive, and Multiplexed Detection of Differential Expression across Cancer Cell Line Proteomes. Analytical Chemistry. 2014;86:7150–7158. doi: 10.1021/ac502040v. [DOI] [PMC free article] [PubMed] [Google Scholar]
- 43.Ting L, Rad R, Gygi SP, Haas W. MS3 eliminates ratio distortion in isobaric multiplexed quantitative proteomics. Nat Meth. 2011;8:937–940. doi: 10.1038/nmeth.1714. [DOI] [PMC free article] [PubMed] [Google Scholar]
- 44.R Development Core Team. R Foundation for Statistical Computing Vienna; Austria: 2013. [Google Scholar]
- 45.Ritchie ME, et al. limma powers differential expression analyses for RNA-sequencing and microarray studies. Nucleic Acids Research. 2015;43:e47. doi: 10.1093/nar/gkv007. [DOI] [PMC free article] [PubMed] [Google Scholar]
- 46.Trapnell C, et al. Transcript assembly and quantification by RNA-Seq reveals unannotated transcripts and isoform switching during cell differentiation. Nat Biotech. 2010;28:511–515. doi: 10.1038/nbt.1621. [DOI] [PMC free article] [PubMed] [Google Scholar]
- 47.Huang DW, Sherman BT, Lempicki RA. Bioinformatics enrichment tools: paths toward the comprehensive functional analysis of large gene lists. Nucleic Acids Research. 2009;37:1–13. doi: 10.1093/nar/gkn923. [DOI] [PMC free article] [PubMed] [Google Scholar]
- 48.Huang DW, Sherman BT, Lempicki RA. Systematic and integrative analysis of large gene lists using DAVID bioinformatics resources. Nat Protocols. 2008;4:44–57. doi: 10.1038/nprot.2008.211. [DOI] [PubMed] [Google Scholar]
- 49.Zhang Y, et al. Model-based Analysis of ChIP-Seq (MACS) Genome Biology. 2008;9:R137. doi: 10.1186/gb-2008-9-9-r137. [DOI] [PMC free article] [PubMed] [Google Scholar]
- 50.Orlando David A, et al. Quantitative ChIP-Seq Normalization Reveals Global Modulation of the Epigenome. Cell Reports. 2014;9:1163–1170. doi: 10.1016/j.celrep.2014.10.018. [DOI] [PubMed] [Google Scholar]
Associated Data
This section collects any data citations, data availability statements, or supplementary materials included in this article.