. 2018 Mar 21;7:e32036. doi: 10.7554/eLife.32036

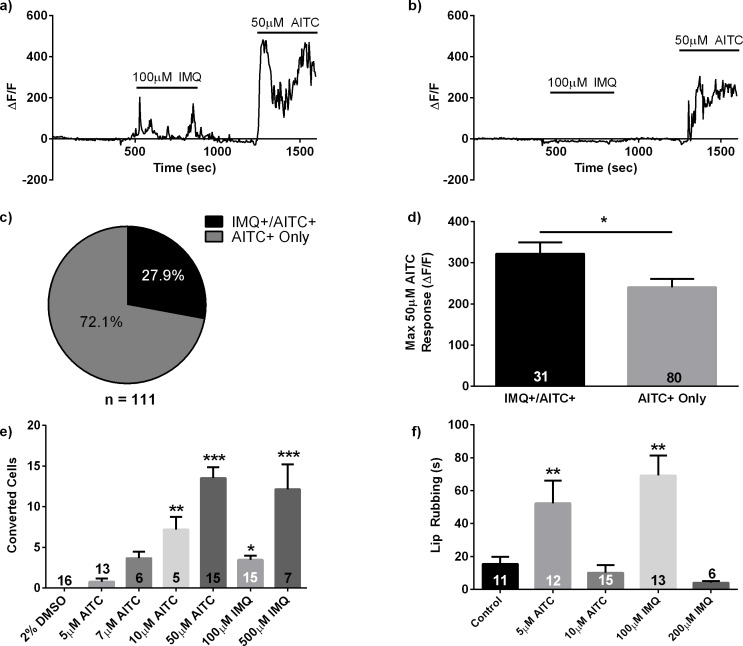
Figure 4. Imiquimod responsive cells are a primed subpopulation of TRPA1 positive cells and stimulus intensity affects behavioral and neuronal responses.

(A, B) Representative traces from calcium imaging experiments in 3dpf elavl3:H2BGCaMP6 zebrafish exposed to 100 μM IMQ and 50 μM AITC. An IMQ+/AITC+ TG neuron is shown in (A), while an AITC+ only neuron is shown in (B). (C) Quantification of neuronal subtypes within AITC+ neurons. n = 31 IMQ+/AITC+ neurons, n = 80 AITC+ only neurons. (D) Comparison of the maximum ΔF/F during the 50 μM AITC stimulus between neuronal subtypes. (E) Number of photoconverted neurons in 3dpf elavl3:CaMPARI zebrafish TG following stimulation with TRPA1 agonists. (F) Quantification of lip-rubbing behavior in adult zebrafish following exposure to TRPA1 agonists. Bars represent means ± s.e.m. *p<0.05, **p<0.01, ***p<0.001, Student’s t-test (D), one-way ANOVA (E, F).

Figure 4.

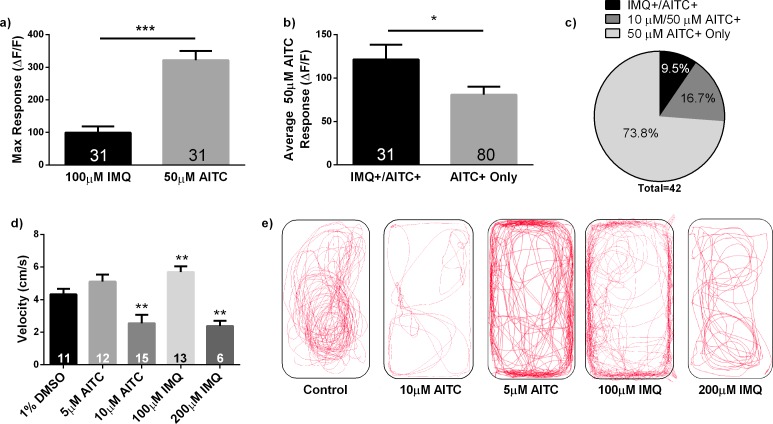
Figure 4—figure supplement 1. Further effects of stimulus intensity on zebrafish neuronal activity and behavior.

Figure 4—figure supplement 1.

(A) IMQ is a lower intensity stimulus than AITC. Application of 100 μM IMQ elicited a lower maximal ΔF/F response than application of 50 μM AITC in IMQ+/AITC+ TG neurons in 3dpf larval zebrafish. (B) In an effort to ensure that our analyses in Figure 4D were accurate reflections of neuronal activity, we also examined the average ΔF/F across the stimulus period. We found that IMQ+/AITC+ cells exhibited a significantly higher average fluorescence change across the entire 50 μM AITC stimulus period than AITC + only responding neurons. (C) Sequential application of 100 μM IMQ, 10 μM AITC, and 50 μM AITC revealed that IMQ+ neurons (n = 4) were only found in a subset of neurons that responded to 10 μM AITC (n = 11), which themselves were included in a larger population of 50 μM AITC+ neurons (n = 42). 50 μM AITC results were consistent with previous experiments. (D) Swimming velocity in adult zebrafish also varied as a function of stimulus intensity. Fish that were injected with 100 μM IMQ (n = 13) exhibited a significant increase in swimming velocity as compared to fish injected with 1% DMSO vehicle (n = 11). Fish injected with 10 μM AITC (n = 15) and 200 μM IMQ (n = 6) exhibited significant reductions in swimming velocity as compared to vehicle-injected controls, suggesting that these stimuli at these particular concentrations are effectually algogenic. 5 μM AITC evoked no significant change in swimming velocity (n = 12). ΔF/F (fluorescence intensity change) is calculated as the percent change over baseline fluorescence. Bars are expressed as means ± s.e.m. *p<0.05, **p<0.01, ***p<0.001, Student’s t-test (A, B), one-way ANOVA (D). (E) Representative traces of adult behavior.
Figure 4—figure supplement 2. Imiquimod activates a specific subset of neurons in a non-stochastic manner in the zebrafish.

Figure 4—figure supplement 2.

(A) Proportions of neurons responding to two sequential pulses of 100 µM IMQ, only the first pulse, or only the second pulse in 3dpf larval zebrafish. (B) Representative trace of a TG neuron that responded to both pulses of 100 µM IMQ. (C) Representative trace of a TG neuron that responded to only the second pulse of 100 µM IMQ.