Abstract
We previously estimated that 42% of patients with severe developmental disorders carry pathogenic de novo mutations in coding sequences. The role of de novo mutations in regulatory elements affecting genes associated with developmental disorders, or other genes, has been essentially unexplored. We identified de novo mutations in three classes of putative regulatory elements in almost 8,000 patients with developmental disorders. Here we show that de novo mutations in highly evolutionarily conserved fetal brain-active elements are significantly and specifically enriched in neurodevelopmental disorders. We identified a significant twofold enrichment of recurrently mutated elements. We estimate that, genome-wide, 1-3% of patients without a diagnostic coding variant carry pathogenic de novo mutations in fetal brain-active regulatory elements and that only 0.15% of all possible mutations within highly conserved fetal brain-active elements cause neurodevelopmental disorders with a dominant mechanism. Our findings represent a robust estimate of the contribution of de novo mutations in regulatory elements to this genetically heterogeneous set of disorders, and emphasize the importance of combining functional and evolutionary evidence to identify regulatory causes of genetic disorders.
The importance of non-coding variation in complex disease has been well established—most disease-associated common SNPs lie in intergenic or intronic regions, albeit with low effect sizes1,2. Rare sequence and structural variants in relatively few regulatory elements have been causally linked to Mendelian disorders3–5. These pathogenic regulatory variants can act by loss of function6–9 or gain of function10,11 and most act dominantly, with a few exceptions12. These regulatory elements can lie far from the gene they regulate. For example, sequence variants in an evolutionarily conserved regulatory element located 1 Mb from its target gene, SHH, can cause polydactyly10. As a consequence, it can be challenging to identify the gene whose regulation is being perturbed by an associated regulatory variant13–15. Moreover, the contribution of highly penetrant mutations in regulatory elements to genetically heterogeneous rare diseases, such as neurodevelopmental disorders, has not been firmly established.
We recruited 7,930 individuals with a severe, undiagnosed developmental disorder, and their parents to the Deciphering Developmental Disorders (DDD) study from clinical genetics centres in the UK and Ireland. Systematic clinical phenotyping16 identified 79% with cognitive impairment or abnormality of the brain, which we refer to as neurodevelopmental disorders. Congenital heart defects (CHD) were the most prevalent non-neurodevelopmental phenotype, present in 10% of the cohort. Exome sequencing of the first 4,293 families in a previous analysis revealed that about 25% of probands carry damaging de novo mutations (DNMs) in genes associated with developmental disorders, accounting for the majority of diagnostic variants17,18. An additional 17% of probands carry pathogenic DNMs in genes not yet robustly associated with developmental disorders18. Thus the majority of the probands do not carry a diagnostic variant in a protein-coding gene, and are termed ‘exome-negative’. To explore the role of DNMs in non-coding elements, we performed targeted sequencing on three classes of putative regulatory elements: 4,307 highly evolutionarily conserved non-coding elements (CNEs)19, 595 experimentally validated enhancers20, and 1,237 putative heart enhancers21, together covering 4.2 Mb of sequence with comparable depth of coverage to protein-coding regions (Extended Data Fig. 1, Supplementary Table 1). Furthermore, we define a set of ‘control’ intronic elements covering 6.03 Mb (see Methods).
Selective constraint acting on non-coding elements
We first assessed how much purifying selection had skewed allele frequencies in non-coding elements. We used the mutability-adjusted proportion of singletons (MAPS) metric22 in 7,080 unrelated, unaffected DDD parents to test six different element classes: introns, heart enhancers, validated enhancers, CNEs, protein-coding genes, and genes known to be associated with developmental disorders. The validated enhancers from the VISTA enhancer browser vary across the spectrum of evolutionary conservation, while the heart enhancers are poorly conserved, consistent with previous reports23, and the CNEs show high levels of evolutionary conservation (Fig. 1a). The introns and heart enhancers show little evidence of purifying selection, while the experimentally validated enhancers and CNEs are constrained to a similar degree to protein-coding genes, but less than genes known to be associated with developmental disorders (Fig. 1b), consistent with evolutionary conservation maintained by purifying selection. Statistical power to detect functionally relevant variants in protein-coding genes is strengthened considerably by stratification of variants by their likely impact on the encoded protein and variant deleteriousness metrics such as CADD24. We computed the MAPS within bins of CADD scores encompassing 1,520,250 variants in unaffected DDD parents to assess whether CADD was predictive of selective constraint. In protein-coding genes, the strong correlation between CADD score and strength of purifying selection enabled us to differentiate between variants that are neutral, weakly constrained, and highly constrained. In CNEs, CADD differentiates neutral variation from variation under weak constraint, but failed to identify highly deleterious variants with selective constraint on a par with protein-truncating variants (Fig. 1c, Extended Data Fig. 2d). Other deleteriousness metrics were assessed, but none were more informative than CADD (Extended Data Fig. 2a-c).
Figure 1. Selective constraint in targeted non-coding elements.
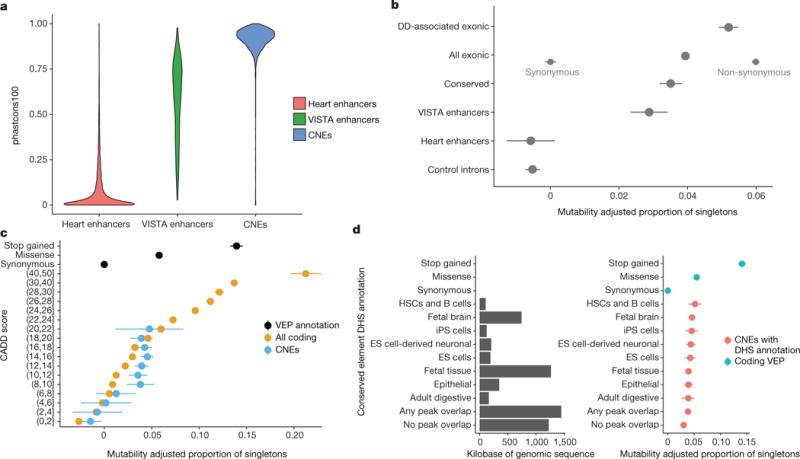
a, Evolutionary conservation score (phastcons10019) for CNEs (n = 4,307), experimentally validated enhancers (VISTA; n = 595), and putative heart enhancers (n = 1,237). b, Strength of selection (MAPS metric, mean and 95% CI represented by dot and bars) in targeted noncoding elements compared to protein-coding regions, where ‘Exonic’ refers to all variation within protein coding-exons. Stratification based on synonymous/non-synonymous consequence displayed on the same row to illustrate power of even a simple discriminator. Introns and putative heart enhancers show little evidence of purifying selection while CNEs show selection on par with all genes, but less than genes known to be associated with developmental disorders. c, Using CADD to stratify coding and non-coding variants observed in unaffected parents differentiates neutral variation from weakly and strongly constrained sites in coding regions, but fails to identify non-coding variation with selection pressure on par with protein-truncating variants (stop gained). d, Sites overlapping a DHS in at least one tissue are under stronger purifying selection than sites not overlapping a DHS. ES cells, embryonic stem cells; HSCs, haematopoietic stem cells; iPS cells, induced pluripotent stem cells.
We used DNase I hypersensitivity sites (DHS) in 39 tissues and chromHMM genome segmentation predictions in 111 tissues25 to predict tissue activity for the targeted non-coding elements. Of the 4,307 CNEs we sequenced, 4,046 (93.9%) were active in at least one of the 111 surveyed tissues whereas 261 (6.1%) were inactive or repressed in all tissues (Extended Data Fig. 2e, f). Variants within a DHS peak in at least one tissue were under stronger purifying selection than variants that did not overlap a DHS peak (P = 0.019), but we did not identify significant differences in selective constraint between tissues (Fig. 1d).
Enrichment of mutations in non-coding elements
We identified candidate de novo single nucleotide mutations in 7,930 trios (see Methods). We adapted a previously described model for germline mutation26 to include methylation status at CpG sites (see Methods, Extended Data Fig. 3a) and show that it better accounts for observed levels of rare variation than the unadapted model (Extended Data Fig. 3b). We tested four genomic features previously associated with mutagenicity27 for enrichment in non-coding elements with DNMs and found no evidence that these genomic features were enriched in non-coding elements with DNMs (H3K27me3, χ2-test P = 0.4809; H3K9me3, χ2-test P = 0.1966; replication timing28, Extended Data Fig. 3f; recombination rate29, Extended Data Fig. 3e).
We identified 1,691 ‘exome-positive’ individuals with a likely pathogenic protein-altering DNM or inherited variant in a gene known to be associated with developmental disorders, with the remaining 6,239 being ‘exome-negative’. Using the mutation model, we compared the numbers of observed and expected DNMs in the targeted non-coding elements in these individuals. No significant DNM enrichment was observed in exome-positive probands in the targeted non-coding elements, demonstrating that the mutation model is reasonably well-calibrated and that a large proportion of exome-positive cases are likely to represent Mendelian syndromes caused by high-penetrance protein-coding mutations (Extended Data Fig. 4a). We note that the number of exome-positive individuals affords only limited power to reject modest mutation enrichment in the non-coding elements. On the basis of these results, we chose to focus on the 6,239 exome-negative individuals for subsequent analyses.
We found that the CNEs were nominally significantly enriched for DNMs (422 observed, 388 expected, P = 0.04), whereas experimentally validated enhancers (153 observed, 156 expected, P = 0.605), heart enhancers (86 observed, 86 expected, P = 0.514), and intronic controls (901 observed, 919 expected, P = 0.728) were not enriched (Fig. 2).
Figure 2. Enrichment of DNMs across element classes and functional annotations in exome-negative probands.
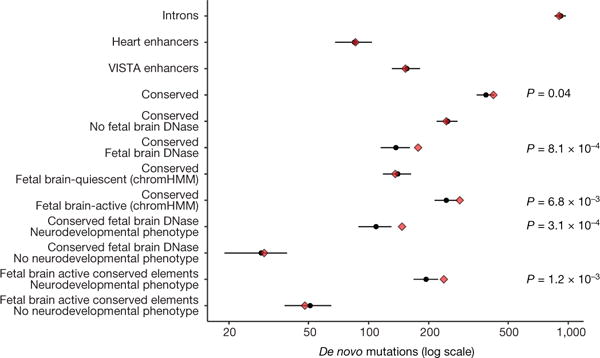
n = 6,239. Red diamonds indicate observed counts, while black circles and bars indicate expected count and 95% CI, respectively. Targeted CNEs showed a modest enrichment for DNMs (422 observed, 388 expected, P = 0.04) while heart enhancers, experimentally validated enhancers, and control introns matched the null model. Observed enrichment is specific to CNEs predicted to be active in the fetal brain and to patients with neurodevelopmental disorders (238 observed, 194 expected, P = 1.2 × 10⁻³). Confidence intervals and P values derived from a Poisson distribution.
Given the preponderance of individuals with neurodevelopmental disorders in our cohort but the broad range of tissue activity of the targeted CNEs, we focused on CNEs that are active in the fetal brain. DNMs were strongly and significantly enriched within 2,077 fetal brain DHS peaks in CNEs (177 observed, 138 expected, P = 8.1 × 10⁻⁴) but no enrichment in sites in CNEs falling outside fetal brain DHSs (245 observed, 249 expected, P = 0.608) (Fig. 2). We also used chromHMM30 predictions of fetal brain activity and again identified significant enrichment of DNMs in the 2,613 fetal brain-active CNEs (Fig. 2). Moreover, the DNMs observed in fetal brain-active CNEs in exome-negative probands were at more highly conserved sites (Wilcoxon rank sum test on PhyloP 100-way score31) compared to DNMs observed in exome-positive probands (Extended Data Fig. 4b). To test for as yet unknown factors causing differential mutability, we compared the levels of rare variation in fetal brain-active and -inactive CNEs in 7,509 deep whole genomes from the gnomAD consortium and found no evidence for a higher germline mutation rate in fetal brain-active elements (Extended Data Fig. 3c, d). The excess of DNMs observed in fetal brain-active CNEs is concentrated exclusively within the 79% of exome-negative probands with neurodevelopmental phenotypes (fetal brain DHS peaks: 147 observed, 109 expected, P = 3.1 × 10⁻⁴; fetal brain-active by chromHMM: 238 observed, 194 expected, P = 1.2 × 10⁻³), with no significant enrichment observed in those without neurodevelopmental phenotypes (fetal brain DHS: P = 0.413; fetal brain-active by chromHMM: P = 0.681) (Fig. 2). The highly significant and specific enrichment of DNMs in fetal brain-active CNEs in exome-negative probands with neurodevelopmental disorders is robust to Bonferroni correction for thirteen explicitly and implicitly tested hypotheses (see Methods, Extended Data Fig. 5a). Analysis of the FANTOM532 and EnhancerAtlas33 datasets suggests that 50-70% of the fetal brain-active CNEs act as enhancers (see Methods).
We re-evaluated the experimentally validated enhancers with functional evidence for activity in fetal brain (N = 383, 64%) and observed a nominally significant enrichment for DNMs only within the top quartile of evolutionary conservation (18 observed, 9 expected, P = 0.01) (Extended Data Fig. 5b). This result suggests that even for experimentally validated fetal brain enhancers, DNM enrichment is concentrated within elements with strong evolutionary conservation.
We assessed four methods of gene target prediction: Genomicus14 (based on evolutionary synteny), correlation between DNase accessibility and gene expression34, Hi-C in fetal brain15 and choosing the closest gene. Genome annotations are rapidly evolving and the sensitivity and specificity of gene target prediction methods is not yet known. However, independent expression quantitative trait loci, enhancer RNA and Hi-C data all suggest that the closest gene is often not the target of non-coding regulatory variation32–34.
Across the four methods tested, the proportion of fetal brain-active CNEs for which a target gene was predicted was 28% (fetal brain Hi-C), 48% (DHS-RNA correlation), 91% (evolutionary synteny), and 100% (closest gene). The pairwise concordance between any two methods (given that both methods make a prediction) was between 17% and 35% (Extended Data Fig. 6a). Intersecting multiple independent methods may provide higher confidence predictions, but comes at a cost of sensitivity and therefore power. We did not identify any enrichment for DNMs in elements predicted to target genes known to be associated with developmental disorders, likely dosage-sensitive genes (pLI metric22), or genes that are differentially expressed in the brain (see Methods, Extended Data Fig. 6b for Hi-C results). Elements with DNMs were enriched for interactions with genes that are specifically upregulated in early prenatal brain development35 (Extended Data Fig. 6c, Methods).
We assessed the impact of DNMs on a set of 45 transcription factor binding motifs that are enriched in fetal brain-active CNEs (see Methods), and observed a nominally significant enrichment for DNMs predicted to increase binding affinity; this did not survive multiple hypothesis correction (Extended Data Fig. 7a-d). Given the number of DNMs we have identified, and the relative immaturity of in silico predictions of the impact of non-coding variation, it is not currently possible to determine precise mechanisms by which these DNMs contribute to developmental disorders.
To explore the penetrance associated with the observed DNM enrichment in the targeted non-coding elements, we investigated potential overtransmission of inherited rare variants in these elements to affected children and found no evidence for overtransmission (Extended Data Fig. 7e). Furthermore, we did not detect any enrichment for rare variants in cis that would suggest that the DNM is acting as a ‘second hit’ to an already perturbed haplotype. The fold-enrichment of DNMs is consistent with DNMs in fetal brain-active CNEs comprising a mixture of 70-80% non-pathogenic DNMs and 20-30% pathogenic DNMs.
Recurrently mutated regulatory elements
We found a significant excess of recurrently mutated elements (two or more DNMs in unrelated individuals) in the fetal brain-active CNEs and evolutionarily conserved enhancers compared to the expectation under the null mutation model (31 observed, 15 expected, P = 9.3 × 10⁻⁵) (Fig. 3a). However, no individual element exceeded a conservative genome-wide significance threshold of P < 1.91 × 10⁻⁵ (Bonferroni correction for independent tests on 2,613 fetal brain-active elements) (Fig. 3b).
Figure 3. Recurrently mutated elements.
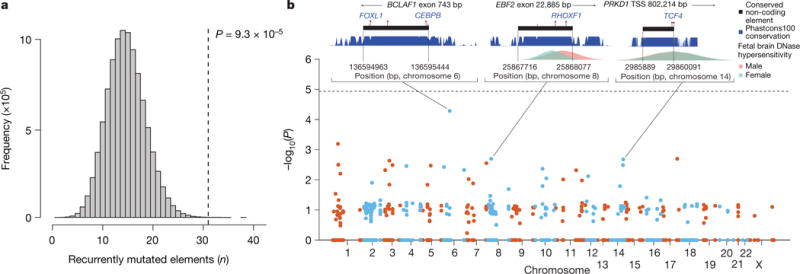
a, Approximately twofold enrichment of recurrently mutated non-coding elements. Grey histogram shows distribution of expected number of recurrently mutated fetal brain-active non-coding elements under the null model and vertical line indicates observed number. b, Enrichment test of individual non-coding elements. No element was significant at a genome-wide threshold of P <1.9 × 10⁻⁵ (Bonferroni correction for testing 2,613 fetal brain-active elements). Inset plots for three elements show the nearest exon or transcription start site, location of DNMs (red markers) with any predicted transcription factor binding site disruptions (gain of binding in blue, loss of binding in red), location of rare variants in unaffected parents (grey markers), evolutionary conservation (blue, higher indicates more conserved), and fetal brain DNase I hypersensitivity (male in pink, female in blue). TSS, transcription start site.
Increased power to detect locus-specific enrichments of DNMs could be gained from aggregating DNMs across elements that regulate the same target gene. However, as described above, gene target prediction lacks coverage and accuracy. CNEs have been shown to cluster together within the genome and are enriched around developmentally important genes36. Therefore we applied hierarchical clustering on the 2,613 fetal brain-active CNEs to identify 356 clusters (see Methods). We found an excess of recurrently mutated clusters, defined as two or more elements with at least one DNM in each element (11 observed, 6 expected, P = 0.016). We did not find any element clusters with a significant excess of DNMs at a genome-wide significance threshold (Supplementary Table 2).
We used chromHMM30 to assign the recurrently mutated CNEs to a predicted chromatin state. We observed the greatest excess of DNMs in CNEs predicted to be enhancers (n = 9) or strongly or weakly transcribed (n = 8) (Extended Data Fig. 8). Five of the eight transcribed recurrently mutated elements fall in close proximity to exons, but are not in protein-coding transcripts and show evidence of involvement in alternative splicing (BCLAF1, SRRT, SLC10A7, and MKNK1) or as a 3′ UTR (CELF1). The full set of recurrently mutated elements is described in Supplementary Table 3 and the location of DNMs relative to population variation and additional annotations is shown in Extended Data Fig. 9.
Estimating genome-wide non-coding mutation burden
The absence of individual non-coding elements with genome-wide significant enrichment of DNMs allowed us to place an upper bound on the proportion of sites and elements in which DNMs are pathogenic. Approximately 8% of DNMs in protein-coding regions result in a protein-truncating mutation26,37. CNEs are smaller than protein-coding exons (median 600 bp) and also lack annotation to identify putative pathogenic mutations. Down-sampling gene length to 600 bp and masking protein consequence annotation resulted in an 80% drop in empirical power for the 94 genes passing the genome-wide significance threshold in a previous study18 (Extended Data Fig. 10a). As we did not discover any genome-wide significant CNEs, the proportion of DNMs in CNEs that are pathogenic and highly penetrant must be substantially lower than 8%. We modelled the likelihood of observing 286 DNMs, 25 recurrently mutated CNEs, and zero CNEs at genome-wide significance across different values for the number of fetal brain-active CNEs (out of 2,613) and the proportion of mutations in those elements that are pathogenic with a dominant mechanism for neurodevelopmental disorders (see Methods). The maximum likelihood model is one in which 3.5% of mutations within approximately 100 elements are pathogenic with a dominant mechanism. However, there is considerable uncertainty around this point estimate (Extended Data Fig. 10b), with the credible interval including scenarios in which tens of elements have around 5-7% of mutations being pathogenic or thousands of elements have below 1% of mutations being pathogenic.
Our survey of the non-coding genome is biased towards highly evolutionarily conserved elements, but also includes elements with lower levels of evolutionary conservation. To extrapolate the excess of DNMs we observed in the targeted non-coding elements to a genome-wide estimate, we modelled the enrichment of DNMs as a function of evolutionary conservation (see Methods). Factoring in the distribution of evolutionary conservation of fetal brain DHS peaks genome-wide, we predicted a genome-wide excess of 88 DNMs (95% confidence interval (CI): 48-140), corresponding to 1.0-2.8% of exome-negative cases carrying pathogenic mutations in regulatory elements (Fig. 4b) in contrast to 13.4% and 28.4% carrying protein-truncating variants and missense variants, respectively, estimated previously18 (Fig. 4c).
Figure 4. Modelling the proportion of DNMs in non-coding elements that are likely to be highly penetrant for dominant neurodevelopmental disorders.
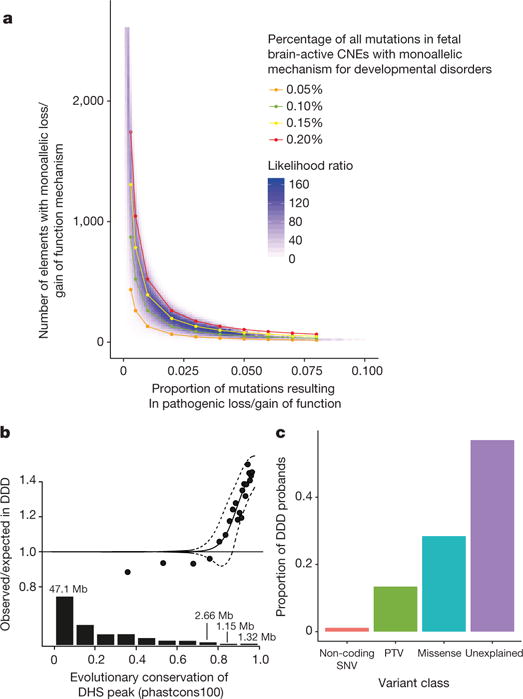
a, Our observation of zero non-coding elements at genomewide significance in 6,239 exome-negative probands indicates that very few sites within these elements (<5%) are likely to contribute to developmental disorders through a highly penetrant dominant mechanism. b, Logistic regression used to model the genome-wide contribution of dominant-acting DNMs in fetal brain DNase hypersensitive sites in non-coding elements as a function of level of evolutionary conservation using a sliding window approach including 1,000 elements in each bin (see Methods). Dashed lines indicate the upper and lower 95% CI. The bar plot shows fetal brain-active DHS peaks genome-wide (in megabase of total sequence) at a given level of evolutionary conservation. c, The proportion of probands carrying a pathogenic de novo SNV in a fetal brain-active regulatory element (1-2.8%) is far lower than the proportion carrying a pathogenic protein-truncating DNM (~13.4%) or missense DNM (~28.4%).
Discussion
We have demonstrated that de novo mutations in regulatory elements contribute to severe neurodevelopmental disorders. These elements act primarily either as enhancers or to regulate alternative splicing, but establishing the precise mechanism for each element has proved challenging. This significant excess of DNMs is observed only in highly evolutionary conserved elements that are active in the fetal brain. These elements also exhibit substantial selective constraint within human populations. We observed a 1.3-fold excess of DNMs within DHS peaks in these regulatory elements, suggesting that a minority of such DNMs are pathogenic. Moreover, our modelling suggests that there are few, if any, regulatory elements in which more than 4% of mutations cause neurodevelopmental disorders with a dominant mechanism. Our data are consistent with only 0.15% of mutations within fetal brain-active CNEs being highly penetrant for neurodevelopmental disorders (Fig. 4a); this is likely to be considerably lower than the proportion of dominant pathogenic mutations in protein-coding regions. As a consequence, this class of pathogenic non-coding DNMs is likely to account for only a small proportion (less than 5%) of ‘exome-negative’ individuals, and the robust identification of disease-associated regulatory elements will present a greater challenge than of protein-coding genes.
Our study design focuses on highly conserved elements and fetal brain-active elements, and is relatively uninformative with respect to pathogenic ‘gain-of-function’ DNMs within elements that show no wild-type activity in fetal brain and are not highly evolutionarily conserved. While our findings have focused on the highly conserved elements, we do not consider our observations to be definitively negative about the role of less highly conserved fetal brain enhancers in neurodevelopmental disorders, or the role of heart enhancers in CHD (owing to the low proportion of subjects with CHD). The field of regulatory element annotation has progressed tremendously over the six years since this study design was initially conceived. Therefore, a comprehensive analysis of the contribution of variation within all classes of non-coding elements to neurodevelopmental disorders is likely to require whole genome sequencing (WGS) of many tens of thousands, if not hundreds of thousands, of parent-proband trios (Extended Data Fig. 10c).
One challenge of interpreting WGS data is the vast universe of hypotheses that could be tested, and thus how to account appropriately for multiple hypothesis testing. A recent study reported a nominally significant enrichment (P = 0.03) of de novo single-nucleotide variants (SNVs) and private copy number variants in fetal brain DHS or at sites with PhyloP conservation scores above 4, within 50 kb of known autism-associated genes in WGS from 53 individuals with autism38. Caution should be exercised in interpreting findings based on small sample sizes relative to those required for well-powered analyses (as discussed above) and analyses requiring multiple, arbitrary levels of variant stratification (for example, gene set, genomic proximity threshold, and conservation score). WGS-based analyses need to account for all explicit and implicit hypothesis testing.
Our analyses were limited to SNVs as current mutation models for indels and structural variation are too inaccurate to allow robust assessment of mutational excess. In addition, our analyses highlight an urgent need for improved tools to stratify benign and damaging variants within non-coding elements and to annotate gene targets for regulatory elements. These improved mutational models and functionally relevant annotations will greatly increase power to detect highly-penetrant disease-associated non-coding variation, for example, increasing power more than tenfold from 8% to 83% in 40,000 trios (Extended Data Fig. 10c). Functional characterization of increasing numbers of robustly associated, highly-penetrant, regulatory variants in cellular and animal models will be critical in moving from a descriptive to a more predictive understanding of non-coding variation in the human genome, as well as elucidating its underlying pathophysiological mechanisms.
METHODS
Defining targeted non-coding elements
The placental mammal 28-way phastCons score19 was used to select the top 4,432 CNEs with no overlap with RefSeq genes (downloaded from UCSC on 4 August 2010). Using the VISTA enhancer browser20, all 622 putative enhancers with evidence of in vivo activity in developing mouse embryos were downloaded on 3 August 2010. At the time the capture was designed, it had been observed that heart enhancers are depleted among ultra-conserved elements23. As heart defects are the largest group of non-CNS abnormalities in the DDD cohort we sought to supplement the ultra-conserved elements with an early annotation of heart enhancers. These putative heart enhancers were provided by A. Visel and based on chromatin immunoprecipitation with sequencing (ChIP-seq) of p300 in human fetal heart described previously21 in GRCh36 coordinates, mapped over to GRCh37. Collectively, these elements cover approximately 4.6 Mb of total sequence. First, elements were filtered to exclude any targeted sequences with less than 10× coverage across the DDD data set. Second, any elements previously annotated to be non-coding, but classified as protein-coding in Gencode v1939, were removed. Finally, any elements less than 50 bp in length were excluded. After filtering, 4,307 conserved elements, 595 enhancer elements and 1,237 putative heart enhancers remained.
Defining intronic control sequences
The exome baits designed to capture the coding regions frequently have considerable overlap with non-coding intronic regions. To define a set of putative well-covered introns, a 10-bp buffer was added upstream and downstream of all gencode v19 coding sequence (to avoid classifying any critical splice sites in the control introns) and this coding sequence was subtracted from the exome probes. Furthermore, any introns within known developmental disorder genes (the DDG2P gene set17) were excluded. This set of control introns was filtered to include only elements 30 bp in length or larger with >30× coverage.
Evolutionary conservation of non-coding elements
The degree of evolutionary conservation across vertebrates at the element level was calculated using the phastcons vertebrate 100-way score. Scores were retrieved in R using the Bioconductor40 package phastCons100way.UCSC.hg1919.
Benchmarking CADD and other variant scoring methods using MAPS
Scores for all possible SNVs genome-wide were downloaded from CADD24 (http://cadd.gs.washington.edu/download), Genomiser41 (https://charite.github.io/software-remm-score.html#download), and fathmm-MKL42 (https://github.com/HAShihab/fathmm-MKL).
Functional genomic annotation
Data from DNase hypersensitivity assays (broad-Peak set, FDR 1%) were downloaded from the Roadmap Epigenome Project30 ftp site (http://egg2.wustl.edu/roadmap/data/byFileType/peaks/consolidated/broadPeak/) in order to predict regulatory function and tissue specificity in the enhancers and CNEs. The GenomicRanges Bioconductor package was used to intersect DHS peaks with the elements sequenced in this analysis. All code used in this analysis can be found at https://github.com/pjshort/DDDNonCoding2017.
Chromatin state predictions (chromHMM 15-state model30) for 111 different tissue types were downloaded from the Roadmap Epigenome Project25 (REP) ftp site (http://egg2.wustl.edu/roadmap/data/byFileType/chromhmmSegmentations/ChmmModels/coreMarks/indivModels/default_init/). We considered a CNE to be inactive in a given tissue if it was completely contained within a chromHMM segment described as quiescent, heterochromatin, or polycomb repressed (‘9_Hef’, ‘13_ReprPC’, ‘14_ReprPCWk’, and ‘15_Quies’) in the 15-state model. Using the GenomicRanges43 Bioconductor package and coding sequence from gencode v19, we calculated the distance of each active and broadly inactive element to the nearest exon or transcription start site. All code used in this analysis can be found at https://github.com/pjshort/DDDNonCoding2017.
Variant calling, QC, and filtering for unaffected parents
Mapping of short-read sequences was carried out using the Burrows-Wheeler Aligner (BWA; version 0.59) algorithm with the GRCh37 1000 Genomes Project phase 2 reference. The Genome Analysis Toolkit (GATK; version 3.1.1) and SAMtools (version 0.1.19) were used for sample-level BAM improvement. Ensembl Variant Effect Predictor (VEP) based on Ensembl gene build 76 was used to annotate variants and, in coding regions, the transcript with the most severe consequence was selected. We determined the number of variants called per individual, and excluded unaffected parents with variant counts on the extremes of the distribution (top 1% and bottom 1%). We identified a trinucleotide-specific error mode (GTN→GGN) that introduced false positives, which was corrected by strict strand filtering (FS <20). Across the 7,080 unaffected parents that passed quality control filters, we identified 1,520,250 unique variants in the targeted non-coding elements and coding regions.
MAPS metric within functional annotations
We used DHSs from 39 different tissues to annotate unique variants from 7,080 unaffected parents in the 4,307 CNEs and 595 enhancers we targeted in this analysis as ‘in peak’ or ‘outside peak’. We calculated the MAPS22 for each annotation (within DHS peak in any tissue, outside DHS peak in all tissues, and within DHS peak in each specific tissue). Where possible, we grouped individual tissues into larger tissue groups based on the Roadmap Epigenome Project25 (REP) categorization. Within the fetal brain tissues (E081, E082 in REP), we calculated the MAPS score for each of the 15 states in order to assess differences in purifying selection between elements that are likely to be inactive versus those that are active.
Defining exome-positive and exome-negative probands
We used the Developmental Disorders Genotype-to-Phenotype Database (DDG2P) to define a set of high-confidence developmental disorder genes (https://decipher.sanger.ac.uk/ddd#ddgenes). We classified all probands as ‘exome-negative’ if they did not have a protein-altering (stop-gain, splice site, or missense variant) DNM in a DDG2P gene with a monoallelic loss of function mechanism, a rare inherited biallelic variant in a DDG2P gene with a recessive mechanism, or a copy number variant identified by clinical microarray and determined to be pathogenic.
De novo mutation calling
De novo mutations were called as described18, excluding variants with posterior probability <0.00781 as annotated by DeNovoGear44.
Trinucleotide germline mutation rate model with CpG-methylation status
A previously described germline mutation rate model based on trinucleotide context26 was adapted to include a correction at CpG sites for methylation status. This method models the null mutation rate at a given site as a Poisson rate parameter that is dependent on the trinucleotide context, where the second base is mutated. We fit a linear model to the ratio of observed/expected variants at MAF <0.1% in CpG sites based on their methylation status in embryonic stem cells. For all CpG sites, we corrected the trinucleotide mutation rate based on the methylation status to produce a methylation-aware mutation rate model. As the sum of Poisson random variables is Poisson, the rate parameter for a given element, or set of elements, can be determined by summing the mutation rate for each individual site. Simulated mutations were based on the same trinucleotide mutation framework and implemented in an R software package (https://github.com/pjshort/DenovoSim).
Testing for enrichment of mutagenic genomic features
The CNEs sequenced in this analysis were intersected with four genomic features previously associated with hypermutability: H3K9me3, H3K27me3, replication timing, and recombination rate. A χ2-test was used to test whether elements in which DNMs were observed were enriched for H3K9me3 or H3K27me3 peaks compared to elements in which no DNM was observed using primary mononuclear cells from peripheral blood (Roadmap Epigenome ID E062). For replication timing28 and recombination rate29, a Wilcoxon rank sum test was used to test for differences between the two sets of elements.
Testing for hypermutability using rare variation in deep whole genomes
We calculated the number of observed rare variants (MAF <0.1%) per unit of expected mutability from the null mutation model for the fetal brain-active and brain-inactive elements that we sequenced in 7,509 non-Finnish European deep whole genomes present in the gnomAD data set. We used bootstrap re-sampling to estimate the standard error around the estimated rare variants per unit mutability for each set. To assess the power of this approach to detect mutability, we simulated rare variants using the null mutation model under 1.1×, 1.2×, and 1.3× mutability in the fetal brain-active elements and tested the power to reject the null hypothesis of mutability 1.0× for different numbers of elements from 50 to 1,000 in steps of 50.
Statistical testing for mutational burden
The P value for the number of observed de novo mutations compared to expected is calculated in R as: ppois(n_obs - 1, lambda = mu, lower.tail = FALSE) where n_obs is the number of observed mutations within an element and mu is the mutability of the element(s) being tested (under the null model described above) multiplied by the number of probands. The burden testing we performed across subsets of elements and phenotypes included multiple nested hypotheses that were accounted for with a conservative Bonferroni-adjusted P value threshold based on the number of explicit and implicit tests. We corrected for thirteen tests within the exome-negative cohort based on branching on element class and phenotype, where appropriate (detailed in Supplementary Fig. 5). In testing for single elements with an excess of observed mutations, we employed a conservative Bonferroni adjustment to correct for 2,613 tests (the number of fetal brain-active CNEs).
Defining fetal brain-active elements
We used the Roadmap Epigenome Project25 DNase data and chromHMM annotations to annotate the CNEs as ‘active’ and ‘inactive’ in the fetal brain. We defined all of the sections of the genome predicted to be quiescent, heterochromatin, or polycomb repressed (‘9_Het’, ‘13_ReprPC’, ‘14_ReprPCWk’, and ‘15_Quies’ in the 15-state model) as ‘inactive’ states. We considered a CNE or enhancer to be inactive if it was completely contained within an inactive chromHMM30 segment in both male and female fetal brain and if it did not overlap with any high confidence DNase hypersensitive site in male or female fetal brain. In total, 2,613 of 4,307 CNEs and 383 of 595 experimentally validated enhancers were predicted to be active in the fetal brain based on these criteria. All code used in this analysis can be found at https://github.com/pjshort/DDDNonCoding2017.
Estimating the proportion of fetal brain-active CNEs acting as enhancers
To evaluate the proportion of CNEs that may be acting as enhancers, we analysed downloaded enhancer RNA (eRNA) data from the fetal brain generated by the FANTOM5 consortium32 and predicted fetal brain enhancers from EnhancerAtlas33, which combines multiple sources of data to identify enhancers in different tissues. We used the experimentally validated fetal brain-active VISTA enhancers to estimate this sensitivity of each data set. We then overlapped the fetal brain-active CNEs with the FANTOM5 eRNA and EnhancerAtlas predictions and used the sensitivity estimates to estimate the total proportion of fetal brain CNEs likely acting as enhancers.
Stratifying enhancers by evolutionary conservation
Phastcons vertebrate 100-way scores19 were retrieved in R using the Bioconductor package phastCons100way.UCSC.hg19 for each of the 383 fetal brain-active experimentally validated enhancers.
Statistical testing for enrichment of recurrently mutated elements
We defined any element observed with a DNM in at least two unrelated probands as ‘recurrently mutated’. We used the simulation framework described above to calculate the likelihood of observing a given number of recurrently mutated elements. To calculate the significance of individual elements, we calculated the likelihood of observing n DNMs in a given element with mutability lambda in R as ppois(n_obs - 1, lambda = mu, lower.tail = FALSE). The P values were compared to a genome-wide significance cutoff of 0.05/2,613 or P < 1.91 × 10⁻⁵ (Bonferroni-corrected P value based on independent tests for enrichment across 2,613 elements).
Defining CNE clusters
In order to identify clusters of CNEs, we compared the inter-element distance in our set of sequenced CNEs to the inter-element distance of the same number of elements randomly distributed genome-wide. We used agglomerative hierarchical clustering with single linkage clustering in R to define clusters at a given inter-element distance. The false discovery rate (FDR) for a set of clusters can be determined by comparing the number of observed clusters to the number expected under the randomly distributed null model at the same inter-element distance. For this analysis, we used a maximum inter-element distance of 10kb, which corresponds to a false discovery rate of 10%.
chromHMM state of recurrently mutated elements
We used the chromHMM 15-state model predictions from the Roadmap Epigenome Project25 (REP) fetal brain male and female (E081, E082 in REP) to classify each of the DNMs observed in recurrently mutated elements. The predicted state in male/female fetal brain was not always concordant. When one annotation predicted the element as inactive and the other as active, we kept the active prediction. When the DNM was predicted to be active in both male and female fetal brain, but in different states, we chose the male state. Re-running this analysis to instead choose the female prediction did not substantially change the outcome.
Phenotypic similarity by human phenotype ontology comparison
Referring clinicians used the Human Phenotype Ontology (HPO) version 2013-11-30 to systematically describe patients upon recruitment to the DDD study. In order to compare phenotypic similarity between groups of patients statistically, the hpo similarity test was used45.
Clustering of DNMs
To test the observed DNMs for clustering that might imply disruption of an underlying binding site or functional motif, we used the denovonear framework described previously18. This method compares the distance between observed DNMs to the distance between simulated DNMs based on the trinucleotide null mutation model to generate an empirical P value.
Gene target prediction and pair-wise overlap
We used four different methods of gene target prediction to link CNEs and enhancers to putative target genes.
The first method, Genomicus, predicts gene targets based on evolutionary conservation with nearby genes. Genomicus determines the extent to which each CNE is within the same syntenic block with nearby genes across a number of vertebrate species and predicts one or more targets14. The Genomicus method produces at least one prediction for 90% of CNEs (approximately one-third of these are the closest genes).
The second method compares DNase hypersensivity at each CNE to expression of nearby genes in 56 different tissues (using RNA sequencing (RNA-seq)) to search for CNE-gene pairs that show a correlation between DNase signal and gene expression34. This method produces statistically significant predictions for only 28% of CNEs in our set and is likely to be underpowered to detect elements that are active in specific tissues or time points.
The third method is to link CNEs to putative target genes using chromatin interaction data (Hi-C) in two different regions of the fetal brain46. The use of Hi-C data is the most direct and tissue-specific of all of the prediction methods used, but the prediction is sparse (26% of CNEs with evidence of fetal brain activity have a predicted target).
The fourth method used is a simple heuristic to choose the gene with the closest TSS (for intergenic elements) or the gene containing the element (for introns). Choosing the closest gene allows us to make a prediction for 100% of elements, but comparison with chromatin conformation and DHS-based methods has shown that the closest gene is likely to be the target in 7% and 12% of cases, respectively34,47.
We used the Genomicus, DHS, and Hi-C predictions to generate aggregated predictions which we considered ‘high confidence’ if predicted by at least two of the three methods.
To assess the pair-wise concordance reported in Extended Data Fig. 7, we took the set of CNEs for which at least one gene target was reported in both methods and tested how frequently both methods identified the same gene within the set of predicted targets.
Brain developmental expression trajectory
BrainSpan developmental RNA-seq data (http://www.brainspan.org) were processed as previously described35. Expression values were log-transformed (log2[RPKM+1]) and scale normalized. This expression data set consists of six brain regions (cortex, thalamus, striatum, hippocampus, amygdala, and cerebellum) and developmental epochs that span prenatal (8-37 post-conception week) and postnatal (4 months-40 years) periods. Genes that are associated with CNEs with DNMs and without DNMs were selected and their developmental expression trajectories were plotted using loess smooth.
Transcription factor binding analyses
The JASPAR2016 and TFBSTools Bioconductor packages48 were used to retrieve position weight matrices for 454 human transcription factors. Analyses in this paper focus on the 202 transcription factors predicted to be expressed in the brain (cortex-expressed from GTEx data set49).
A custom R package called ‘denovoTF’ (https://github.com/pjshort/denovoTF) was written to predict any change in transcription factor binding at sites where DNMs were observed or simulated. This analysis works by scanning the reference and alternative sequences for all 202 PWMs and comparing predicted binding events on both sequences. By comparing the potential binding affinity for ref and alt sequences, we can predict loss of binding (alt binding < ref binding), gain of binding (alt binding > ref binding), and silent (no difference). ‘Silent’ DNMs fall into two classes: those for which binding is predicted on both reference and alternate, but strength of binding is unchanged, and those which do not lie in a predicted transcription factor binding site.
The analysis of motif enrichment (AME) tool from the meme suite was used to identify a subset of PWMs that was significantly enriched in fetal brain-active elements50. Comparing the fetal brain-active CNEs to the fetal brain inactive CNEs returned a set of 90 transcription factors, of which 45 were expressed in the brain and had PWMs available in JASPAR201648. This analysis was performed on the meme-suite web server using the following command:
ame-verbose 1-oc.-control meme_chromHMM_fb_inactive_all.fasta-bgformat 1-scoring avg-method ranksum-pvalue-report-threshold 0.05 meme_chromHMM_fb_active_all.fasta db/JASPAR/JASPAR_CORE_2016.meme.
In order to test for enrichment of loss of binding or gain of binding events in the observed DNMs, we compared predicted impact on transcription factor binding in observed DNMs to 1,000 simulations of mutations across the 2,613 fetal brain-active elements for 6,147 probands.
Nucleotide-level conservation (PhyloP)
PhyloP scores represent the — log10 P value that a given site is evolving neutrally31. We used a tabix file of pre-computed PhyloP vertebrate 100-way scores for every site in the genome in order to annotate the DNMs observed in exome-negative probands to exome-positive probands as well as the simulated null model.
Power calculations at different study sizes
We used the trinucleotide null model described previously in order to estimate our power to detect disease-associated elements. Parameters that affect power include the fold enrichment for disease-causing mutations in the DDD cohort (proportional to the incidence of severe developmental disorders with a genetic basis in the population), the proportion of mutations within a true disease-associated element expected to be pathogenic, the penetrance of such mutations, the size and mutability of the elements tested, and the number of trios analysed. To estimate the power across different study sizes, we fixed the remaining parameters as follows: 120-fold enrichment for disease-causing mutations, proportion of mutations expected to be pathogenic at 8% (lower bound estimate for coding regions), penetrance at 100%, and the elements tested were the 2,613 fetal brain-active CNEs. Code for power analysis can be found in the R script: https://github.com/pjshort/DDDNonCoding2017/blob/master/analysis_notebooks/Figure4_maximum_likelihood_and_genome_estimate.Rmd.
Likelihood of power calculation model parameters under observed data
To test the likelihood of different models of dominant disease mechanism within the non-coding space we adapted the power calculation framework described above to test the probability of observing our data across two different parameters: the number of elements (out of 2,613) with a dominant disease mechanism and the proportion of mtuations expected to be pathogenic. We tested the likelihood of observing 286 DNMs, 25 recurrently mutated elements, and zero elements at genome-wide significance while systematically varying two parameters: the proportion of mutations expected to be pathogenic parameter (from 0.01% to 10.0% in increments of 0.01%) and the proportion of elements with true disease associations (from 0 to 2,613 in increments of 5). In this analysis, the remaining parameters were held constant: 120× enrichment for pathogenic mutations, penetrance at 100%, testing 2,613 fetal brain-active CNEs, and number of trios at 6,147. Code can be found in the R notebook: https://github.com/pjshort/DDDNonCoding2017/blob/master/analysis_notebooks/Figure4_maximum_likelihood_and_genome_estimate.Rmd.
Estimating the genome-wide burden of DNMs in fetal brain-active elements
First, we intersected all targeted non-coding sequences, irrespective of original class, with fetal brain DHS peaks. We used the phastcons100 score (scores retrieved in R using the Bioconductor package phastCons100way.UCSC.hg1919 to rank these elements by evolutionary conservation. The ratio of observed/expected DNMs was computed with a sliding window across the elements (window size of 1,000 elements, shift of 100 elements). This approach resulted in a median of 62 DNMs expected in each bin (minimum 51, maximum 68) which was compared to the observed number of DNMs. We fit a logistic regression to the excess observed/expected in each window, setting any window with observed less than expected to have an excess of zero. We used the logistic regression fit on the CNEs sequenced in our analysis to predict the burden of DNMs in this genome-wide set.
Transmission of rare variants
All variants that were heterozygous in one parent were tested for any patterns of overtransmission within different variant classes. Only elements with >20× median coverage were used for this analysis, as elements without adequate coverage showed systematic underestimation of transmission. The observed proportion of rare variants that were transmitted from parents to affected probands was compared to the expected proportion under the null hypothesis (50%) using a binomial test.
Testing CNEs for ‘already perturbed haplotypes’
In order to test the hypothesis that DNMs in fetal brain-active CNEs may be contributing to a developmental disorder via a second hit on an already weakened haplotype, we extracted the rare variants present in the relevant DNM-containing CNE for each proband. We compared the proportion of probands with at least one variant besides the observed DNM in the fetal brain-active CNEs compared to the fetal brain-inactive CNEs. We also calculated the total burden of rare variation within the DNM-containing element (measured as SNVs per kb) for probands with DNMs in fetal brain-active CNEs compared to probands with DNMs in fetal brain-inactive CNEs.
Code availability
Source code used to analyse data and generate the figures for this article can be found at https://github.com/pjshort/DDDNonCoding2017/.
Data availability
Sequencing and phenotype data are accessible via the European Genome-phenome Archive (EGA) under study number EGAS00001000775 (https://www.ebi.ac.uk/ega/studies/EGAS00001000775). The DDG2P gene list of genes associated with developmental disorders is available at www.ebi.ac.uk/gene2phenotype. All other data are available from the corresponding author upon request.
Extended Data
Extended Data Figure 1. Coverage in targeted non-coding elements.
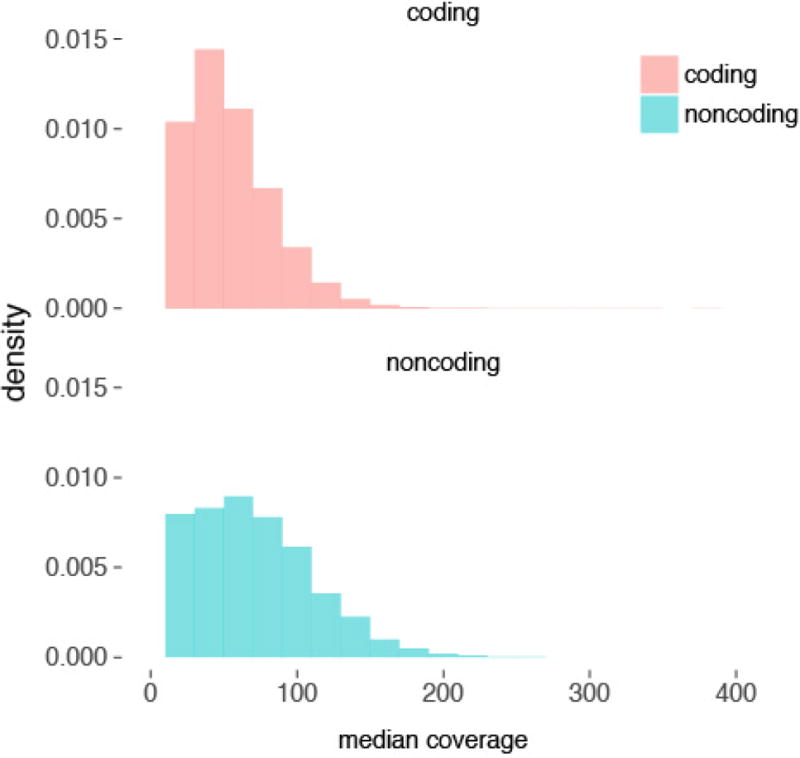
Coverage in the targeted non-coding elements is comparable to the proteincoding exons (median 73× and 56×, respectively).
Extended Data Figure 2. Assessment of variant deleteriousness metrics and selective pressure in CNEs.
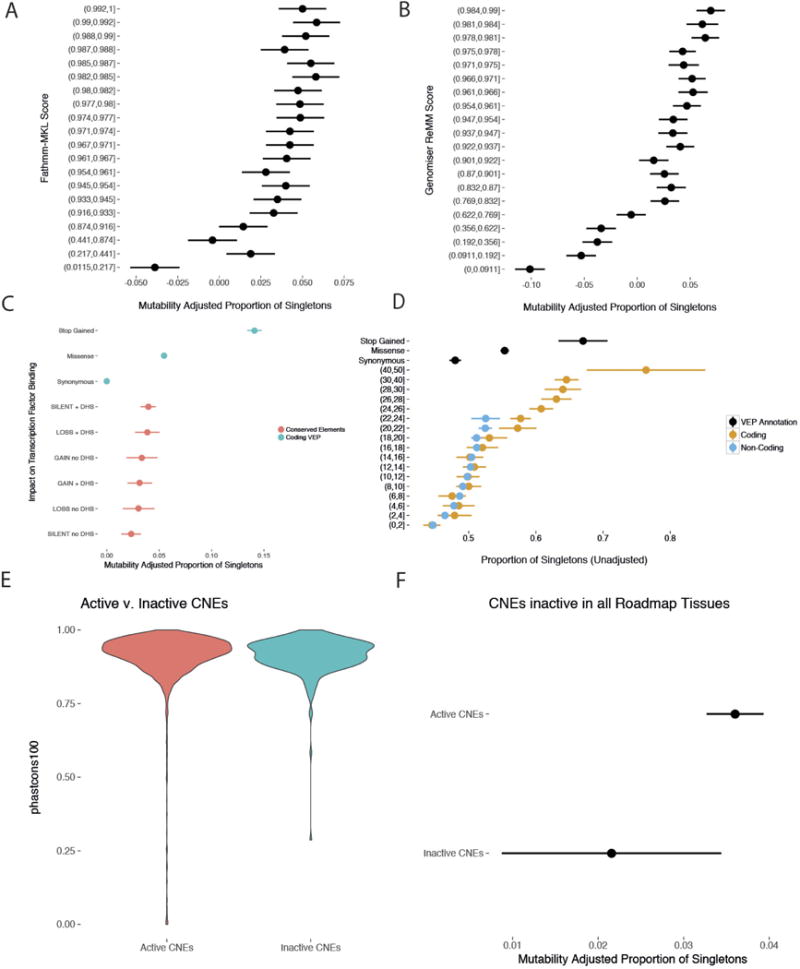
Dots and bars represent the point estimate and 95% CI, respectively, for MAPS and proportion singletons. a, b, Fathmm-MKL (a) and Genomiser (b) separate benign variation (low MAPS score) from likely damaging variation (high MAPS score), but do not identify any classes of variation under strong selective constraint. c, There was no significant difference in the strength of purifying selection measured by MAPS between sites predicted to result in loss, gain, or no change in transcription factor binding. d, Validation of Fig. 1c using whole-genome data from the UK10K project. While CADD can identify coding variation under strong selective constraint (as measured by the proportion of singletons), CADD is unable to identify strongly constrained non-coding variants. e, f, The subset of CNEs sequenced in the DDD cohort that are predicted to be inactive in all 111 Roadmap Tissues (n = 261) exhibit a similar degree of evolutionary conservation (e) but lower selective constraint (f) in a healthy population compared to CNEs active in at least one tissue (n = 4,046).
Extended Data Figure 3. Genomic factors that affect mutation rate in non-coding elements.
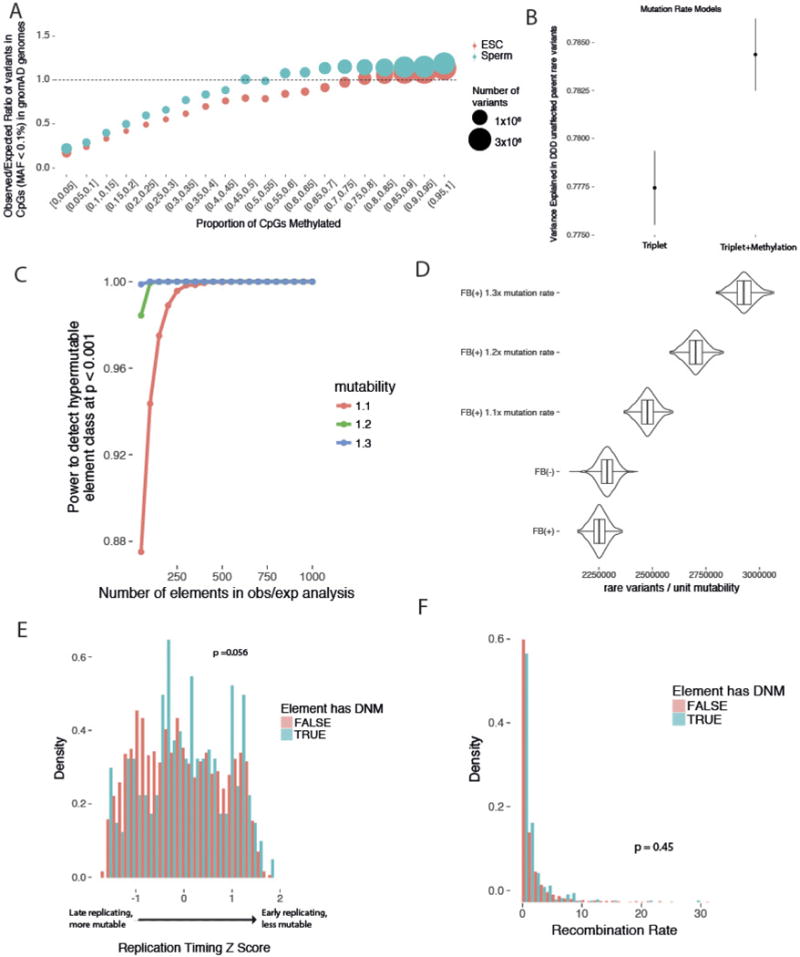
a, Aggregating CpG sites genome-wide into bins of methylation proportion from 0% (unmethylated in all cells) to 100% (methylated in all cells) and calculating the observed/expected ratio reveals differences in mutability not accounted for a by a triplet model alone. b, A mutation rate model incorporating a correction for CpG methylation explains greater variance in rare variant counts in the DDD unaffected parents. c, Levels of rare variation in deep whole genomes (n = 7,509 non-Finnish Europeans) were used to estimate power to detect a hypermutability of 1.1×, 1.2×, or 1.3×. d, The level of rare variation in the fetal brain-active elements (n = 2,613, FB(+)) is slightly lower than in the fetal brain-inactive elements (n = 1694, FB(−)), consistent with similar mutability between the two element sets with slightly stronger purifying selection in the fetal brain-active elements. e, f, Elements with DNMs observed in our study are not enriched in late-replicating regions (e) or in regions with higher recombination rate (f), which have been shown to be hypermutable.
Extended Data Figure 4. Non-coding mutations in exome-positive probands and poorly evolutionarily conserved sites make a minimal contribution to severe developmental disorders.
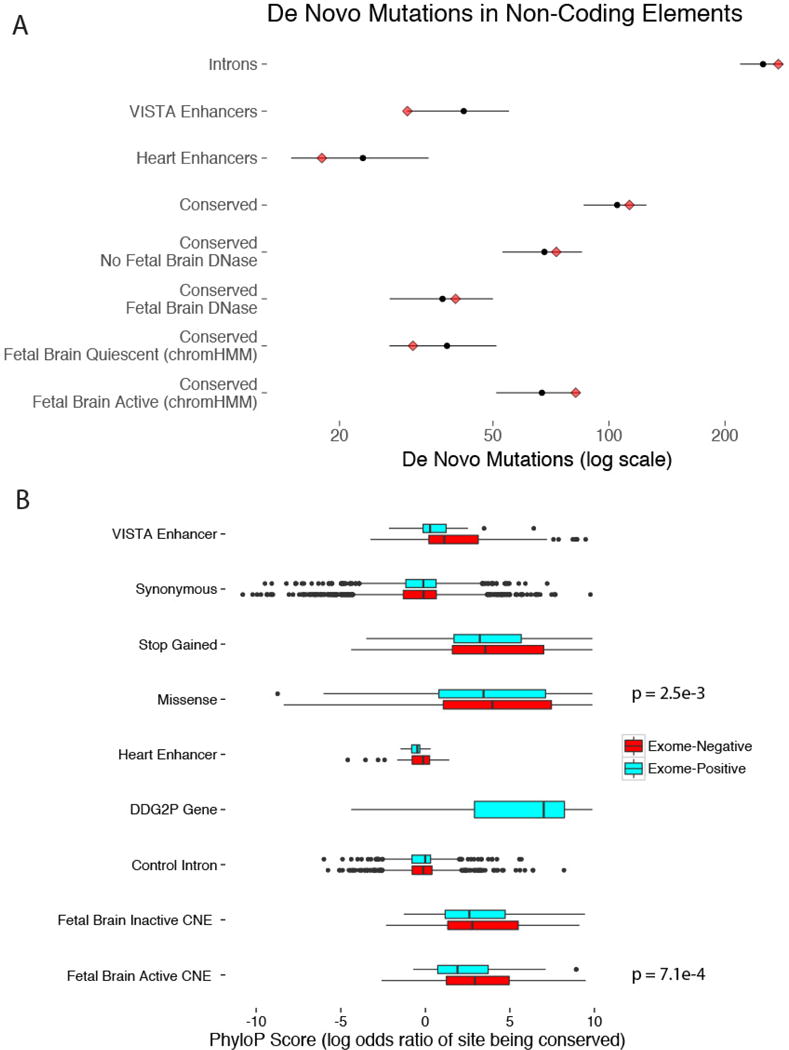
a, In the 1,691 ‘exome-positive’ probands, there is no evidence for a burden of DNMs in any of the non-coding element classes tested. Red diamonds indicate the observed counts, while black circles and bars indicate the expected count and 95% CI, respectively. b, DNMs in exome-negative probands show a greater degree of evolutionary conservation (measured by PhyloP score) than DNMs in exome-positive probands in two classes: fetal brain-active CNEs (median 1.57 exome-positive, 2.85 exome-negative, n = 368 mutations) and missense changes (median 3.43 exome-positive, 3.98 exome-negative, n = 6,244 mutations).
Extended Data Figure 5. Hypothesis test enumeration and enrichment for mutations in highly conserved fetal brain-active enhancers.
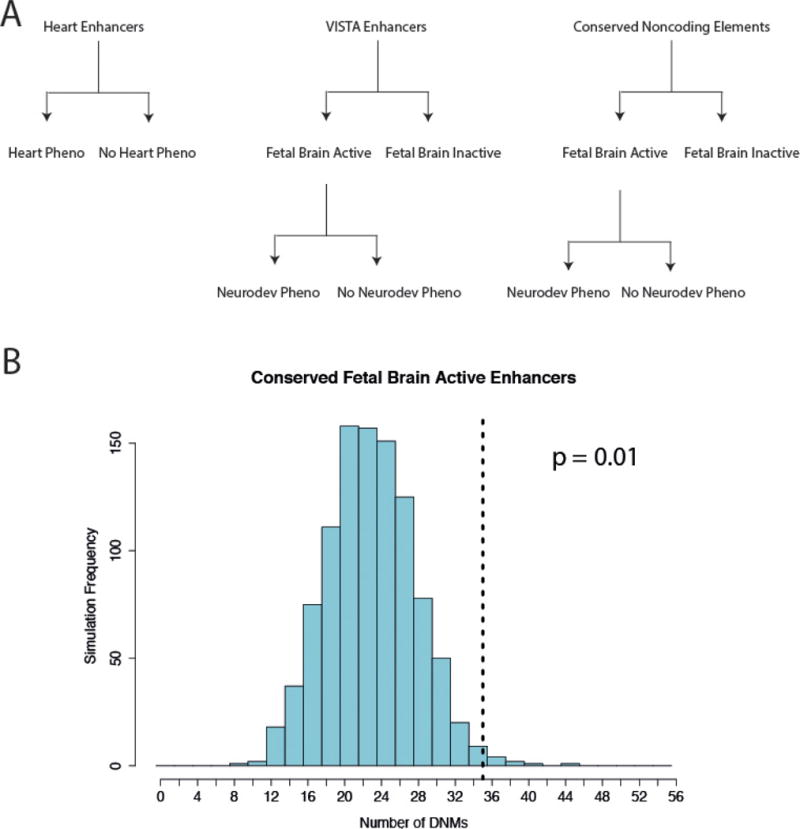
a, We corrected for thirteen tests in order to account for the nested hypotheses based on element class and phenotype in this analysis. b, Evolutionarily conserved fetal brain-active enhancers (n = 106) are enriched for DNMs in exome-negative probands.
Extended Data Figure 6. Gene target prediction for targeted noncoding elements.
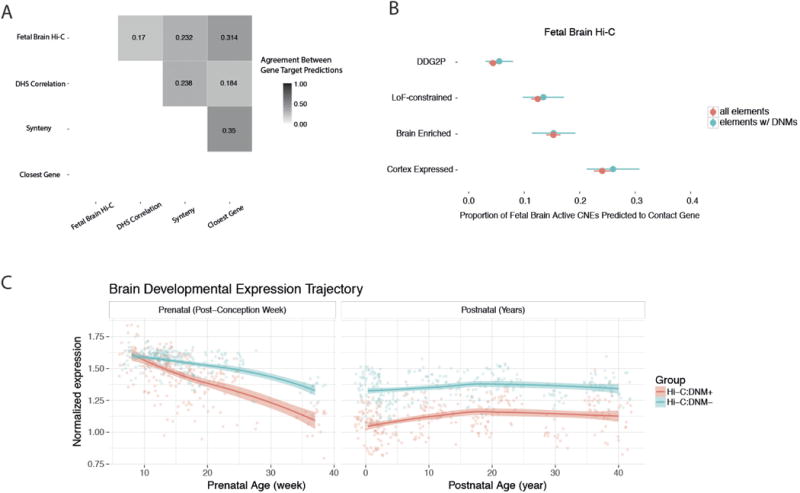
Pairwise concordance between four different gene target prediction methods is low. Using predicted targets from fetal brain Hi-C data, elements with an observed DNM in exome-negative probands (n = 286) do not show any bias towards any of the gene sets consistently implicated in neurodevelopmental disorders. Dots and bars represent the point estimate and 95% confidence interval, respectively.
Extended Data Figure 7. Transcription factor binding disruption and transmission disequilibrium test.
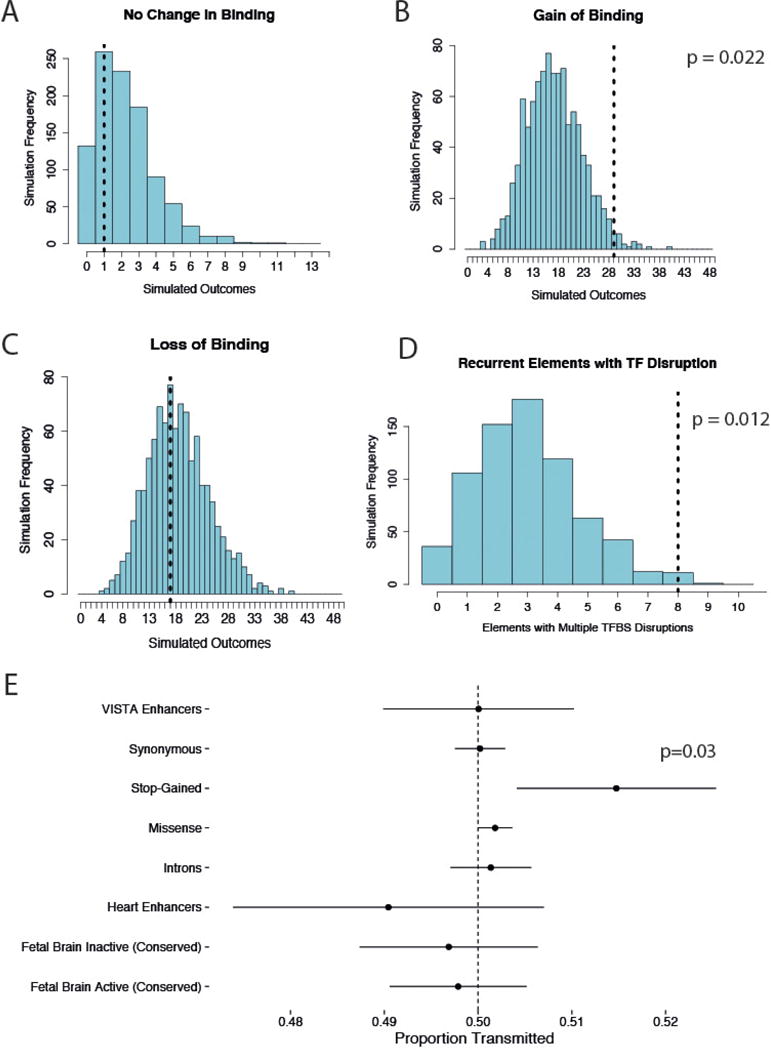
a–d, Comparison of predicted change in transcription factor binding for observed DNMs compared to null mutation model. Empirical P values derived from comparison with mutations simulated from the null mutation model. e, None of the non-coding element classes tested show any evidence of overtransmission from parents to affected children. Dots and bars represent the point estimate and 95% confidence intervals of estimates of transmission proportions, respectively.
Extended Data Figure 8. Predicted chromatin state for recurrently mutated elements.
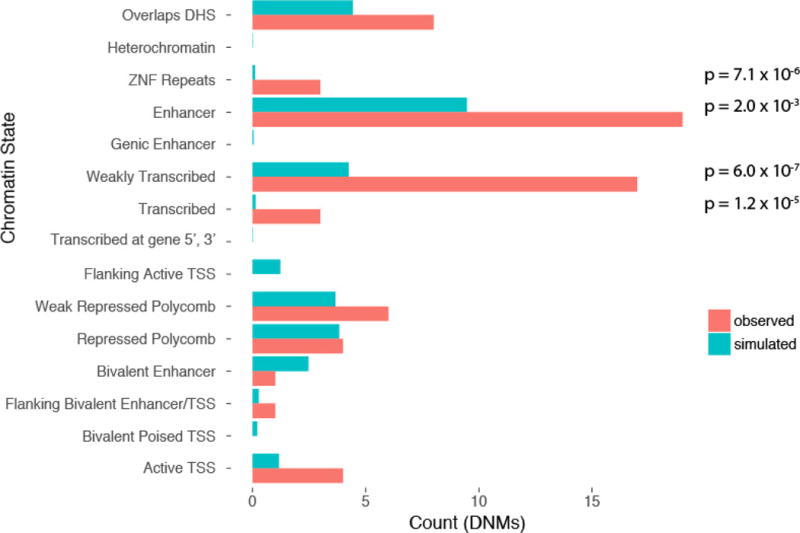
chromHMM state of the n = 31 recurrently mutated elements shows enrichment for enhancers and transcribed elements. Elements that overlapped a high confidence DHS but were predicted as quiescent by chromHMM are classed as Overlaps DHS. P values derived from Poisson distribution with parameter lambda defined by the simulated data.
Extended Data Figure 9. Schematic describing each of the thirty-one recurrently mutated elements.
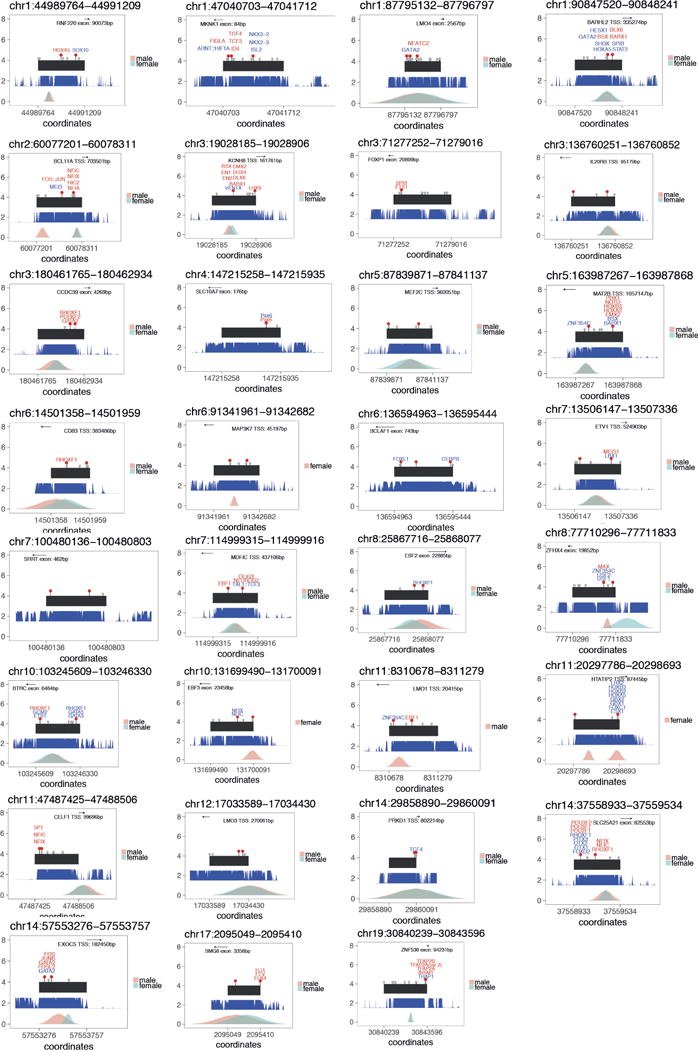
Element is in black, red lollipops denote observed DNMs, grey lollipops denote observed variation at MAF >0.1% in 7,080 unaffected parents, phastcons100 conservation score is shown in blue, and DHSs from the Roadmap Epigenome project are shown in blue/pink in the bottom track.
Extended Data Figure 10. Empirical and simulated power for disease association in targeted non-coding elements.
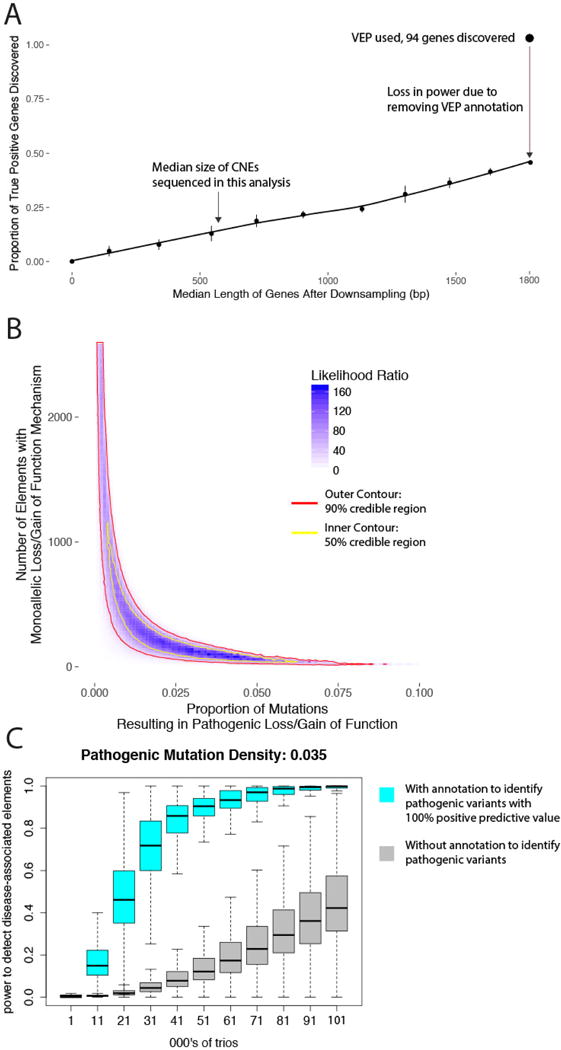
a, Estimation of the reduction in power due to size differences between non-coding elements and genes (median 600 bp versus 1,800 bp) and ignoring VEP annotations used to stratify benign from likely damaging variants. Dots and bars represent the point estimate and 95% confidence interval, respectively. b, Credible intervals for the proportion of fetal brain-active conserved elements and proportion of sites within those elements with a dominant mechanism for developmental disorders. c, Power calculations for disease-associated non-coding element discovery. Without annotation or tools to discriminate pathogenic from benign variants in non-coding elements (grey), more than 100,000 trios are required to achieve 40% power. With annotation or tools to fully discriminate likely pathogenic from benign variants (blue), 40% power is achieved with only 21,000 trios.
Supplementary Material
Acknowledgments
We thank the families for their participation and patience; the DDD study clinicians, research nurses and clinical scientists in the recruiting centres for their hard work and perseverance on behalf of families; the Exome Aggregation Consortium and Genome Aggregation Database (http://gnomad.broadinstitute.org/) for making their data and code available; S. Gerety, G. Elgar, S. Aerts, and D. Svetlichnyy for discussions; H. Roest Crollius and L. Moyon for help with gene target prediction; J. Mudge and A. Frankish for help in annotating CNEs; and the Sanger HGI and DNA pipelines teams for their support in generating and processing the data. The DDD study presents independent research commissioned by the Health Innovation Challenge Fund (grant HICF-1009-003), a parallel funding partnership between the Wellcome Trust and the UK Department of Health, and the Wellcome Trust Sanger Institute (grant WT098051). The views expressed in this publication are those of the author(s) and not necessarily those of the Wellcome Trust or the UK Department of Health. The study has UK Research Ethics Committee approval (10/H0305/83, granted by the Cambridge South Research Ethics Committee and GEN/284/12, granted by the Republic of Ireland Research Ethics Committee). D.R.F. is funded through an MRC Human Genetics Unit program grant to the University of Edinburgh. D.H.G is funded through 1U01 MH105666 and 1R01 MH110927 (psychENCODE consortium). A.S. is supported by the FWO (Postdoctoral Fellow number 12W7318N).
Footnotes
Online Content Methods, along with any additional Extended Data display items and Source Data, are available in the online version of the paper; references unique to these sections appear only in the online paper.
Supplementary Information is available in the online version of the paper.
Author Contributions Study design: H.V.F., C.F.W., D.R.F., J.C.B. and M.E.H. Method development and data analysis: P.J.S., J.F.M., G.G., A.S., H.W., D.H.G., and M.E.H. Writing: P.J.S. and M.E.H. Experimental and analytical supervision: H.V.F., C.F.W., D.R.F., J.C.B. and M.E.H. Project Supervision: M.E.H.
The authors declare competing financial interests: details are available in the online version of the paper. Readers are welcome to comment on the online version of the paper.
Publisher’s note: Springer Nature remains neutral with regard to jurisdictional claims in published maps and institutional affiliations.
Reviewer Information Nature thanks M. Daly and the other anonymous reviewer(s) for their contribution to the peer review of this work.
References
- 1.Hindorff LA, et al. Potential etiologic and functional implications of genome-wide association loci for human diseases and traits. Proc Natl Acad Sci USA. 2009;106:9362–9367. doi: 10.1073/pnas.0903103106. [DOI] [PMC free article] [PubMed] [Google Scholar]
- 2.Maurano MT, et al. Systematic localization of common disease-associated variation in regulatory DNA. Science. 2012;337:1190–1195. doi: 10.1126/science.1222794. [DOI] [PMC free article] [PubMed] [Google Scholar]
- 3.Mathelier A, Shi W, Wasserman WW. Identification of altered cis-regulatory elements in human disease. Trends Genet. 2015;31:67–76. doi: 10.1016/j.tig.2014.12.003. [DOI] [PubMed] [Google Scholar]
- 4.Spielmann M, Mundlos S. Looking beyond the genes: the role of non-coding variants in human disease. Human Mol Genet. 2016;25:157–165. doi: 10.1093/hmg/ddw205. [DOI] [PubMed] [Google Scholar]
- 5.Zhang F, Lupski JR. Non-coding genetic variants in human disease. Hum Mol Genet. 2015;24:R102–R110. doi: 10.1093/hmg/ddv259. [DOI] [PMC free article] [PubMed] [Google Scholar]
- 6.Jeong Y, et al. Regulation of a remote Shh forebrain enhancer by the Six3 homeoprotein. Nat Genet. 2008;40:1348–1353. doi: 10.1038/ng.230. [DOI] [PMC free article] [PubMed] [Google Scholar]
- 7.Benko S, et al. Disruption of a long distance regulatory region upstream of SOX9 in isolated disorders of sex development. J Med Genet. 2011;48:825–830. doi: 10.1136/jmedgenet-2011-100255. [DOI] [PubMed] [Google Scholar]
- 8.Bhatia S, et al. Disruption of autoregulatory feedback by a mutation in a remote, ultraconserved PAX6 enhancer causes aniridia. Am J Hum Genet. 2013;93:1126–1134. doi: 10.1016/j.ajhg.2013.10.028. [DOI] [PMC free article] [PubMed] [Google Scholar]
- 9.Weedon MN, et al. Recessive mutations in a distal PTF1A enhancer cause isolated pancreatic agenesis. Nat Genet. 2014;46:61–64. doi: 10.1038/ng.2826. [DOI] [PMC free article] [PubMed] [Google Scholar]
- 10.Lettice LA, et al. A long-range Shh enhancer regulates expression in the developing limb and fin and is associated with preaxial polydactyly. Hum Mol Genet. 2003;12:1725–1735. doi: 10.1093/hmg/ddg180. [DOI] [PubMed] [Google Scholar]
- 11.Hill RE, Lettice LA. Alterations to the remote control of Shh gene expression cause congenital abnormalities. Philos Trans R Soc Lond B Biol Sci. 2013;368:20120357. doi: 10.1098/rstb.2012.0357. [DOI] [PMC free article] [PubMed] [Google Scholar]
- 12.Sellick GS, et al. Mutations in PTF1A cause pancreatic and cerebellar agenesis. Nat Genet. 2004;36:1301–1305. doi: 10.1038/ng1475. [DOI] [PubMed] [Google Scholar]
- 13.Noonan JP, McCallion AS. Genomics of long-range regulatory elements. Annu Rev Genomics Hum Genet. 2010;11:1–23. doi: 10.1146/annurev-genom-082509-141651. [DOI] [PubMed] [Google Scholar]
- 14.Naville M, et al. Long-range evolutionary constraints reveal cis-regulatory interactions on the human X chromosome. Nat Commun. 2015;6:6904. doi: 10.1038/ncomms7904. [DOI] [PMC free article] [PubMed] [Google Scholar]
- 15.Whalen S, Truty RM, Pollard KS. Enhancer-promoter interactions are encoded by complex genomic signatures on looping chromatin. Nat Genet. 2016;48:488–496. doi: 10.1038/ng.3539. [DOI] [PMC free article] [PubMed] [Google Scholar]
- 16.Köhler S, et al. The Human Phenotype Ontology in 2017. Nucleic Acids Res. 2017;45:D865–D876. doi: 10.1093/nar/gkw1039. [DOI] [PMC free article] [PubMed] [Google Scholar]
- 17.Wright CF, et al. Genetic diagnosis of developmental disorders in the DDD study: a scalable analysis of genome-wide research data. Lancet. 2015;385:1305–1314. doi: 10.1016/S0140-6736(14)61705-0. [DOI] [PMC free article] [PubMed] [Google Scholar]
- 18.Deciphering Developmental Disorders Study. Prevalence and architecture of de novo mutations in developmental disorders. Nature. 2017;542:433–438. doi: 10.1038/nature21062. [DOI] [PMC free article] [PubMed] [Google Scholar]
- 19.Siepel A, et al. Evolutionarily conserved elements in vertebrate, insect, worm, and yeast genomes. Genome Res. 2005;15:1034–1050. doi: 10.1101/gr.3715005. [DOI] [PMC free article] [PubMed] [Google Scholar]
- 20.Visel A, Minovitsky S, Dubchak I, Pennacchio LA. VISTA Enhancer Browser—a database of tissue-specific human enhancers. Nucleic Acids Res. 2007;35:D88–D92. doi: 10.1093/nar/gkl822. [DOI] [PMC free article] [PubMed] [Google Scholar]
- 21.May D, et al. Large-scale discovery of enhancers from human heart tissue. Nat Genet. 2011;44:89–93. doi: 10.1038/ng.1006. [DOI] [PMC free article] [PubMed] [Google Scholar]
- 22.Lek M, et al. Analysis of protein-coding genetic variation in 60,706 humans. Nature. 2016;536:285–291. doi: 10.1038/nature19057. [DOI] [PMC free article] [PubMed] [Google Scholar]
- 23.Blow MJ, et al. ChIP-Seq identification of weakly conserved heart enhancers. Nat Genet. 2010;42:806–810. doi: 10.1038/ng.650. [DOI] [PMC free article] [PubMed] [Google Scholar]
- 24.Kircher M, et al. A general framework for estimating the relative pathogenicity of human genetic variants. Nat Genet. 2014;46:310–315. doi: 10.1038/ng.2892. [DOI] [PMC free article] [PubMed] [Google Scholar]
- 25.Kundaje A, et al. Integrative analysis of 111 reference human epigenomes. Nature. 2015;518:317–330. doi: 10.1038/nature14248. [DOI] [PMC free article] [PubMed] [Google Scholar]
- 26.Samocha KE, et al. A framework for the interpretation of de novo mutation in human disease. Nat Genet. 2014;46:944–950. doi: 10.1038/ng.3050. [DOI] [PMC free article] [PubMed] [Google Scholar]
- 27.Carlson J, et al. Extremely rare variants reveal patterns of germline mutation rate heterogeneity in humans. 2017 doi: 10.1038/s41467-018-05936-5. Preprint at https://www.biorxiv.org/content/early/2017/02/14/108290. [DOI] [PMC free article] [PubMed]
- 28.Koren A, et al. Genetic variation in human DNA replication timing. Cell. 2014;159:1015–1026. doi: 10.1016/j.cell.2014.10.025. [DOI] [PMC free article] [PubMed] [Google Scholar]
- 29.Kong A, et al. Fine-scale recombination rate differences between sexes, populations and individuals. Nature. 2010;467:1099–1103. doi: 10.1038/nature09525. [DOI] [PubMed] [Google Scholar]
- 30.Ernst J, Kellis M. ChromHMM: automating chromatin-state discovery and characterization. Nat Methods. 2012;9:215–216. doi: 10.1038/nmeth.1906. [DOI] [PMC free article] [PubMed] [Google Scholar]
- 31.Pollard KS, Hubisz MJ, Rosenbloom KR, Siepel A. Detection of nonneutral substitution rates on mammalian phylogenies. Genome Res. 2010;20:110–121. doi: 10.1101/gr.097857.109. [DOI] [PMC free article] [PubMed] [Google Scholar]
- 32.Andersson R, et al. An atlas of active enhancers across human cell types and tissues. Nature. 2014;507:455–461. doi: 10.1038/nature12787. [DOI] [PMC free article] [PubMed] [Google Scholar]
- 33.Gao T, et al. EnhancerAtlas: a resource for enhancer annotation and analysis in 105 human cell/tissue types. Bioinformatics. 2016;32:3543–3551. doi: 10.1093/bioinformatics/btw495. [DOI] [PMC free article] [PubMed] [Google Scholar]
- 34.Shooshtari P, Huang H, Cotsapas C. Integrative genetic and epigenetic analysis uncovers regulatory mechanisms of autoimmune disease. Am J Hum Genet. 2016;101:75–86. doi: 10.1016/j.ajhg.2017.06.001. [DOI] [PMC free article] [PubMed] [Google Scholar]
- 35.Parikshak NN, et al. Integrative functional genomic analyses Implicate specific molecular pathways and circuits in autism. Cell. 2013;155:1008–1021. doi: 10.1016/j.cell.2013.10.031. [DOI] [PMC free article] [PubMed] [Google Scholar]
- 36.Sandelin A, et al. Arrays of ultraconserved non-coding regions span the loci of key developmental genes in vertebrate genomes. BMC Genomics. 2004;5:99. doi: 10.1186/1471-2164-5-99. [DOI] [PMC free article] [PubMed] [Google Scholar]
- 37.Kryukov GV, Pennacchio LA, Sunyaev SR. Most rare missense alleles are deleterious in humans: implications for complex disease and association studies. Am J Hum Genet. 2007;80:727–739. doi: 10.1086/513473. [DOI] [PMC free article] [PubMed] [Google Scholar]
- 38.Turner TN, et al. Genome sequencing of autism-affected families reveals disruption of putative non-coding regulatory DNA. Am J Hum Genet. 2016;98:58–74. doi: 10.1016/j.ajhg.2015.11.023. [DOI] [PMC free article] [PubMed] [Google Scholar]
- 39.Harrow J, et al. GENCODE: the reference human genome annotation for The ENCODE Project. Genome Res. 2012;22:1760–1774. doi: 10.1101/gr.135350.111. [DOI] [PMC free article] [PubMed] [Google Scholar]
- 40.Gentleman RC, et al. Bioconductor: open software development for computational biology and bioinformatics. Genome Biol. 2004;5:R80. doi: 10.1186/gb-2004-5-10-r80. [DOI] [PMC free article] [PubMed] [Google Scholar]
- 41.Smedley D, et al. A whole-genome analysis framework for effective identification of pathogenic regulatory variants in Mendelian disease. Am J Hum Genet. 2016;99:595–606. doi: 10.1016/j.ajhg.2016.07.005. [DOI] [PMC free article] [PubMed] [Google Scholar]
- 42.Shihab HA, et al. An integrative approach to predicting the functional effects of non-coding and coding sequence variation. Bioinformatics. 2015;31:1536–1543. doi: 10.1093/bioinformatics/btv009. [DOI] [PMC free article] [PubMed] [Google Scholar]
- 43.Lawrence M, et al. Software for computing and annotating genomic ranges. PLOS Comput Biol. 2013;9:e1003118. doi: 10.1371/journal.pcbi.1003118. [DOI] [PMC free article] [PubMed] [Google Scholar]
- 44.Ramu A, et al. DeNovoGear: de novo indel and point mutation discovery and phasing. Nat Methods. 2013;10:3–7. doi: 10.1038/nmeth.2611. [DOI] [PMC free article] [PubMed] [Google Scholar]
- 45.Akawi N, et al. Discovery of four recessive developmental disorders using probabilistic genotype and phenotype matching among 4,125 families. Nat Genet. 2015;47:1363–1369. doi: 10.1038/ng.3410. [DOI] [PMC free article] [PubMed] [Google Scholar]
- 46.Won H, et al. Chromosome conformation elucidates regulatory relationships in developing human brain. Nature. 2016;538:523–527. doi: 10.1038/nature19847. [DOI] [PMC free article] [PubMed] [Google Scholar]
- 47.Sanyal A, Lajoie BR, Jain G, Dekker J. The long-range interaction landscape of gene promoters. Nature. 2012;489:109–113. doi: 10.1038/nature11279. [DOI] [PMC free article] [PubMed] [Google Scholar]
- 48.Mathelier A, et al. JASPAR 2016: a major expansion and update of the open-access database of transcription factor binding profiles. Nucleic Acids Res. 2016;44(D1):D110–D115. doi: 10.1093/nar/gkv1176. [DOI] [PMC free article] [PubMed] [Google Scholar]
- 49.GTEx Consortium. The Genotype-Tissue Expression (GTEx) project. Nat Genet. 2013;45:580–585. doi: 10.1038/ng.2653. [DOI] [PMC free article] [PubMed] [Google Scholar]
- 50.McLeay RC, Bailey TL. Motif Enrichment Analysis: a unified framework and an evaluation on ChIP data. BMC Bioinformatics. 2010;11:165. doi: 10.1186/1471-2105-11-165. [DOI] [PMC free article] [PubMed] [Google Scholar]
Associated Data
This section collects any data citations, data availability statements, or supplementary materials included in this article.
Supplementary Materials
Data Availability Statement
Sequencing and phenotype data are accessible via the European Genome-phenome Archive (EGA) under study number EGAS00001000775 (https://www.ebi.ac.uk/ega/studies/EGAS00001000775). The DDG2P gene list of genes associated with developmental disorders is available at www.ebi.ac.uk/gene2phenotype. All other data are available from the corresponding author upon request.


