
Extended Data Figure 7. Transcription factor binding disruption and transmission disequilibrium test.
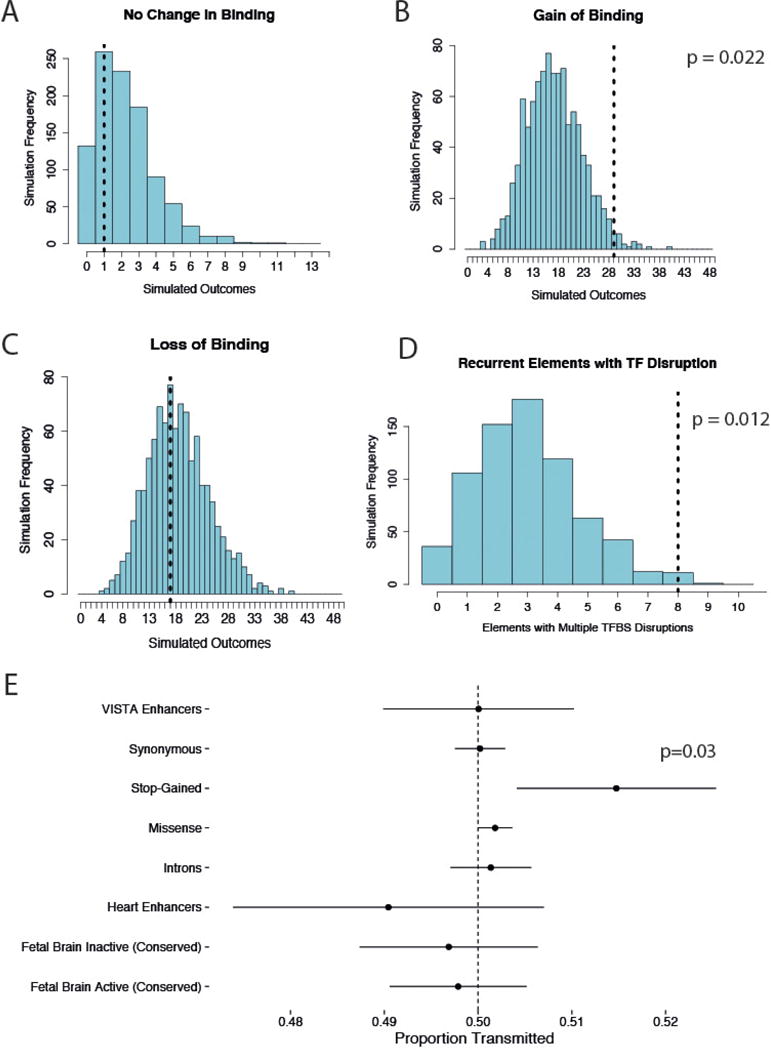
a–d, Comparison of predicted change in transcription factor binding for observed DNMs compared to null mutation model. Empirical P values derived from comparison with mutations simulated from the null mutation model. e, None of the non-coding element classes tested show any evidence of overtransmission from parents to affected children. Dots and bars represent the point estimate and 95% confidence intervals of estimates of transmission proportions, respectively.