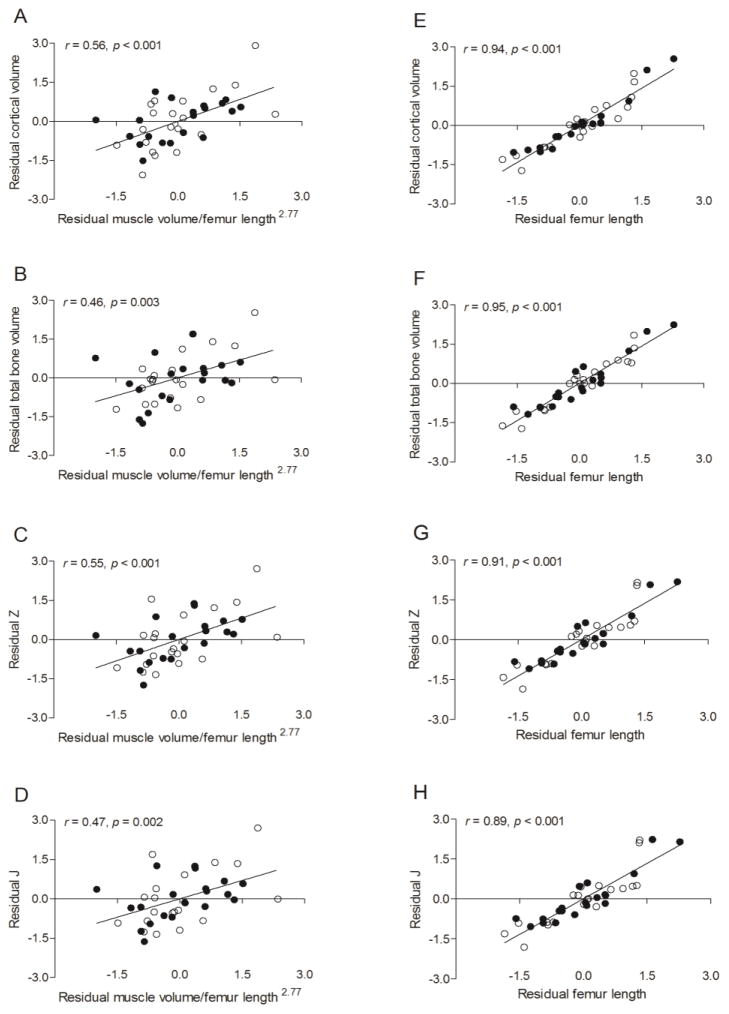
Figure 4.
Scatter plots demonstrating the relationships between measures of cortical bone architecture in the midfemur (i.e., cortical volume, total volume, Z and J) and 1) midthigh muscle volume/femur length2.77 while statistically controlling for femur length, sex, MVPA (min/d) and calcium intake (A-D) and 2) femur length while statistically controlling for muscle volume/femur length2.77, sex, MVPA (min/d) and calcium intake (E-H) in pre- and early-pubertal boys ● and girls ○. Because no sex effect was detected, the solid line represents the regression line for the combined sample.

