

Abstract
Background and Purpose
A high recurrence rate after medical treatment is a major clinical problem for patients with endometriosis. Here, we have evaluated the in vitro effects of combined treatment with MK2206 (an AKT inhibitor) + chloroquine on cell growth and regrowth of endometriotic stromal cells and the in vivo effects on endometriotic implants in a mouse xenograft model of endometriosis.
Experimental Approach
We evaluated the effects of autophagy inhibition by knockdown of the ATG13, Beclin‐1 and ATG12 genes and pharmacological agents (chloroquine, bafilomycin A1 or 3‐methyalanine) individually and in combination with MK2206 on cell growth and/or cell regrowth of endometriotic stromal cells in vitro. Furthermore, we evaluated treatment with MK2206 + chloroquine on endometriotic implants in a mouse xenograft model of endometriosis.
Key Results
Combined treatment with MK2206 and chloroquine markedly reduced cell growth and regrowth after discontinuation of treatment in endometriotic stromal cells compared with cells treated with either drug alone. Autophagy inhibition by ATG13, Beclin‐1 or ATG12 gene knockdown only affected regrowth of endometriotic stromal cells, but not endometrial stromal cells from the same patients, after a 72 h discontinuation of the combined treatment. Furthermore, combined treatment reduced the size of endometriotic implants, whereas no effects on endometriotic implants treated with either drug alone were observed in a mouse xenograft model of endometriosis.
Conclusions and Implications
The present findings suggest that a novel strategy for treatment of endometriosis may involve decreasing the number of endometriotic cells that can survive treatment and then preventing regrowth by autophagy inhibition.
Abbreviations
- 3‐MA
3‐methyalanine
- BafA1
bafilomycin A1
- CSCs
cancer stem cells
- DES cells
deep endometriotic stromal cells
- DIE
deep infiltrating endometriosis
- EEE cells
endometrial epithelial cells
- EES cells
endometrial stromal cells
- LC3
light chain 3‐II protein
- NEES cells
endometrial stromal cells of patients without endometriosis
- PDMS
polydimethylsiloxane
- PGS
polyacrylamide gel substrate
Introduction
Endometriosis, a common gynaecological disorder that causes infertility and pelvic pain, affects approximately 10% of women of reproductive age (Giudice and Kao, 2004). A high recurrence rate after medical treatment, with or without surgery, is a major clinical problem for patients with endometriosis (Guo, 2009). Establishment of a complete cure for patients with endometriosis depends on new targets and strategies. Until now, numerous studies have evaluated whether candidate molecules can decrease the number of cells that survive treatment in in vitro cell culture systems (Soares et al., 2012). However, it is also critical to evaluate whether candidate molecules for the treatment of endometriosis can prevent relapse of the disease after treatment is discontinued (Matsuzaki et al., 2017).
We previously showed that combined treatment with http://guidetopharmacology.org/GRAC/LigandDisplayForward?ligandId=5282 (a MAPK/ERK kinase inhibitor) and http://guidetopharmacology.org/GRAC/LigandDisplayForward?ligandId=7945 (an Akt inhibitor) synergistically inhibited cell proliferation of deep endometriotic stromal cells (DES cells) in vitro (Matsuzaki et al., 2017). However, a high proliferation rate of DES cells was observed after drug discontinuation (Matsuzaki et al., 2017).
Our previous findings suggested that MK2206 may induce autophagy, which may inhibit cell death. Thus, cell survival and subsequent cell proliferation may result from combined treatment with U0126 + MK2206 (Matsuzaki et al., 2017). In our previous study, we further evaluated the effects of http://guidetopharmacology.org/GRAC/LigandDisplayForward?ligandId=5535, an antimalarial drug and an autophagy inhibitor (Matsuzaki et al., 2017). Both http://guidetopharmacology.org/GRAC/LigandDisplayForward?ligandId=5535 and http://www.guidetopharmacology.org/GRAC/LigandDisplayForward?ligandId=7198, the hydroxylated analogue of http://guidetopharmacology.org/GRAC/LigandDisplayForward?ligandId=5535, are the only autophagy inhibitors approved by the Food and Drug Administration (Yang et al., 2013). We observed significantly lower proliferation of DES cells after discontinuation of treatment with U0126, MK2206 and http://guidetopharmacology.org/GRAC/LigandDisplayForward?ligandId=5535 than with U0126 and MK2206 (Matsuzaki et al., 2017).
Autophagy plays a dual role in various diseases by promoting both cell survival and cell death (Codogno and Meijer, 2005; Das et al., 2012; White, 2015). Our previous study suggested that autophagy induced by MK2206 may play a cytoprotective role in endometriosis (Matsuzaki et al., 2017). To date, many studies have shown that various types of chemotherapy and radiation therapy induce autophagic cytoprotective functions in tumour cells, and inhibition of autophagy by http://guidetopharmacology.org/GRAC/LigandDisplayForward?ligandId=5535 or hydroxychloroquine is effective for chemosensitization and radiosensitization (Janku et al., 2011; Levy and Thorburn, 2011; Yang et al., 2011a; Sui et al., 2013). Several studies have shown that chloroquine or hydroxychloroquine sensitizes cells to the actions of MK2206, with or without conventional chemotherapeutic agents in various cancer cell types (Cheng et al., 2012; Bokobza et al., 2014; Rebecca et al., 2014). In addition, studies have shown that treatment with chloroquine or hydroxychloroquine alone is effective in different cancers through targeting of basal autophagy (Kimmelman, 2011; Yang et al., 2011b; Kaminskyy et al., 2012). A recent study showed that treatment with hydroxychloroquine alone decreased lesion numbers and disrupted lesion histopathology in an autologous mouse model of endometriosis (Ruiz et al., 2016).
These previous findings along with those of our group (Matsuzaki et al., 2017) suggest that treatment with chloroquine alone, MK2206 + chloroquine or U0126 + MK2206 + chloroquine may have potential applications in endometriosis. Therefore, we first performed a comparative in vitro study prior to validation in animal experiments. In the present study, we evaluated the effects of treatment with chloroquine alone, chloroquine + MK2206 or chloroquine + MK2206 + U0126 on cell growth and regrowth of endometriotic stromal cells in vitro. Interestingly, we found no significant difference between U0126 (30 μM) + MK2206 (9 μM) + chloroquine (50 μM) and MK2206 (9 μM) + chloroquine (50 μM) on either inhibition of cell growth or regrowth after drug discontinuation in DES cells. Thus, we elected to use MK2206 + chloroquine to evaluate the in vivo effects on endometriotic implants in a mouse xenograft model of endometriosis.
Next, we attempted to investigate whether chloroquine sensitized the cell proliferation inhibitory effects of MK2206, in an autophagy‐dependent manner. Currently available pharmacological inhibitors of autophagy are not entirely specific (Yang et al., 2013). Pharmacological studies should be combined with genetic approaches to more specifically inhibit the autophagy pathway (Barth et al., 2010; Mizushima et al., 2010; Klionsky et al., 2012). We therefore also evaluated the effects of autophagy inhibition by knockdown of the autophagy‐related (ATG)13, Beclin‐1 and ATG12 genes and two other pharmacological agents, bafilomycin A1 (BafA1) and 3‐methyalanine (3‐MA). individually and in combination with MK2206 on cell growth and/or cell regrowth of DES cells in vitro. The autophagic machinery is encoded by ATG genes, which coordinate the six steps of autophagy: initiation, nucleation, elongation and closure, vesicle (autophagosome) formation, vesicle fusion with the vacuole/lysosome, and vesicle breakdown and recycling of the resulting macromolecules (Mizushima, 2007; Yang and Klionsky, 2009). In the present study, among the different ATG genes, we elected to use the ATG13, Beclin‐1 and ATG12 genes, which are involved in the first three steps of autophagy (initiation, nucleation and elongation and closure, respectively) for autophagy inhibition (Mizushima, 2007; Yang and Klionsky, 2009). http://guidetopharmacology.org/GRAC/LigandDisplayForward?ligandId=5535 and BafA1 are inhibitors of late‐stage autophagy, whereas 3‐MA is an inhibitor of early‐stage autophagy (Yang et al., 2013). Chloroquine inhibits autophagosome–lysosome fusion, BafA1 disrupts autophagic flux by inhibiting http://guidetopharmacology.org/GRAC/FamilyDisplayForward?familyId=157‐dependent acidification and autophagosome–lysosome fusion, and 3‐MA, a http://guidetopharmacology.org/GRAC/FamilyDisplayForward?familyId=673 inhibitor, blocks the initiation of autophagy (Yang et al., 2013; Mauvezin and Neufeld, 2015).
Methods
Patients
The research protocol was approved by the Consultative Committee for Protection of Persons in Biomedical Research of the Auvergne (France) region. All experiments were performed in accordance with the approved guidelines and regulations. Informed written consent was obtained from each patient prior to tissue collection. Patients, aged 20–37 years, undergoing laparoscopy for endometriosis were recruited at CHU Clermont‐Ferrand, France. None of the women had received hormonal therapy, and none used intrauterine contraception for at least 6 months prior to surgery. Recruited patients had regular menstrual cycles (26–32 days) with confirmation of their menstrual history. Endometrial and endometriotic samples from 60 patients who had histological evidence of rectovaginal deep infiltrating endometriosis (DIE) were used for the present analysis. In addition, endometrial tissues from 15 patients without endometriosis (tubal infertility) were used as controls. All tissues were derived from the proliferative phase of the menstrual cycle. The clinical characteristics of patients are shown in Supporting Information Table S1.
Cell culture
DES, endometrial stromal (EES) and epithelial (EEE) cells of patients with endometriosis and endometrial stromal cells of patients without endometriosis (NEES) were isolated as previously described (Matsuzaki and Darcha, 2013a,b, 2014, 2015; Matsuzaki et al., 2016, 2017). Cells at passage 1 were used for experiments. The numbers of samples of DES, EES, EEE and/or NEES cells used for each experiment are summarized in Supporting Information Table S2. Immunofluorescence staining was performed to determine the purity of the isolated EES, EEE, NEES and DES cells, as previously described (Matsuzaki and Darcha, 2013a,b, 2014, 2015; Matsuzaki et al., 2016, 2017).
Preparation of stiffness‐controlled 96‐well plates
Stiffness‐controlled 96‐well plates were prepared using modifications to the protocol of Syed et al. (2015), as previously described (Matsuzaki et al., 2017). Briefly, to produce the desired gels of variable stiffness (2 or 30 kPa), polyacrylamide gel precursor solution was prepared by mixing acrylamide (Bio‐Rad Laboratories, Hercules, CA, USA), bis‐acrylamide (Bio‐Rad), 1 M HEPES (Sigma‐Aldrich, Lyon, France) and double‐distilled H2O. The gel solution was pipetted onto the hydrophilic side of the flexible plastic support (GelBond PAG Gel Film, GE Healthcare, Buckinghamshire, UK) and sandwiched with hydrophobic‐coated glass slides. The polyacrylamide gel was then polymerized and dried onto the flexible plastic support. Then, the polyacrylamide gels were cut using a heavy‐duty hole punch with a diameter of 6 mm for use in 96‐well plates. To glue the gels to the wells, 5 μL of polydimethylsiloxane (PDMS, Sigma‐Aldrich) was placed in the centre of each well. Then, one polyacrylamide gel was placed in each well. To allow the PDMS to cure, the assembled 96‐well plate was left at 37°C for 4 h. Then, the polyacrylamide gel was activated with sulfo‐SANPAH (Thermo Scientific, Illkirch‐Graffenstaden, France) to cross link the extracellular matrix protein (collagen) to the polyacrylamide gel surface. The polyacrylamide gel was coated with type I collagen (0.2 mg/mL) (BD Biosciences, Le Pont‐de‐Claix, France) overnight at 4°C. The gels were sterilized under UV light (λ = 200 nm) for 2 h. Then, the gels were soaked in complete medium overnight to hydrate and equilibrate.
Cell proliferation assays and drug combination analysis
Cell proliferation assays were performed using the CellTiter 96® AQueous One Solution Cell Proliferation Assay (MTS) (Promega, Charbonnières‐les‐Bains, France), as previously described (Matsuzaki and Darcha, 2013a,b, 2014, 2015; Matsuzaki et al., 2016, 2017). Briefly, cells (5 × 10³ cells per well) were plated on plastic in triplicate in 96‐well plates. To evaluate the effects of varying stiffness of substrates, cells from the same samples were plated on 2 or 30 kPa polyacrylamide gel substrates (PGS) or plastic in triplicate in 96‐well plates, as previously described (Matsuzaki et al., 2017). After 2 h at 37°C and 5% CO2 to allow cell adhesion and spreading, drugs were added at the indicated concentration with 100 μL culture media (2% charcoal‐stripped FBS) (Sigma‐Aldrich), individually or in combinations. U0126 or MK2206 were dissolved in DMSO (Life Technologies, Cergy‐Pontoise, France). Chloroquine , BafA1 or 3‐MA was dissolved in phenol red‐free DMEM : Nutrient Mixture F‐12 (DMEM/F‐12) (Life Technologies).
To calculate the combination index (CI) after 48 h of treatment, we used five different doses of MK2206 + chloroquine, MK2206 + BafA1 and MK2206 + 3‐MA. We used fixed‐dose ratios for each combination based on the results of our previous study or preliminary experiments, according to the Chou–Talalay model (Chou, 2006; Chou, 2010). Per cent cell proliferation was calculated as per cent of vehicle control. CalcuSyn software (Biosoft, Cambridge, UK) was used to calculate the IC50 or CI according to the median‐effect method of Chou and Talalay (Chou, 2006; Chou, 2010), as previously described (Matsuzaki et al., 2017). CI values <0.9, 0.9–1.1 and >1.1 represent synergism, additivity and antagonism respectively (Chou, 2006; Chou, 2010).
To evaluate the effects of various drug treatments on inhibition of cell proliferation and cell survival after drug discontinuation, cells from the same samples were divided into two: one set was used to evaluate inhibition of cell proliferation after 48 h of treatment, and the other set was used to evaluate cell proliferation of viable cells 72 h after drug discontinuation. To evaluate inhibition of cell proliferation after the 48 h treatments, 20 μL of MTS was added to all wells, and cells were incubated for 2 h at 37°C. To evaluate cell proliferation of viable cells after the 72 h drug discontinuations, cells were washed twice with PBS after a 48 h treatment, followed by a 72 h culture in drug‐free medium with 10% FBS. Then, 20 μL of MTS solution was added to all wells, and cells were incubated for 2 h at 37°C. Absorbance was then read at 490 nm using a Multiskan microplate reader (Thermo Scientific). All values were normalized to the values obtained with the vehicle‐treated cells to control for unwanted sources of variation.
Analysis of apoptosis by flow cytometry
Cells (1 × 10⁶ cells) were seeded onto Primaria flasks (BD Biosciences). After 2 h at 37°C and 5% CO2 to allow for cell adhesion and spreading, cells were incubated with culture media (2% charcoal‐stripped FBS) containing chloroquine alone (50 μM), MK2206 alone (9 μM), chloroquine (50 μM) + MK2206 (9 μM) or vehicle (DMSO) for 24 h. Cells were stained with Annexin V‐FITC and PI (Annexin V kit, Beckman Coulter, Villepinte, France) and evaluated for apoptosis by flow cytometry analyses using a BD LSRII flow cytometer (BD Biosciences) according to the manufacturer's protocol. Both early apoptotic (Annexin V positive and PI negative) and late (Annexin V positive and PI positive) apoptotic cells were included in cell death determinations, as previously described (Matsuzaki et al., 2017).
Transfection with ATG13, Beclin‐1 and ATG12 siRNAs
Cells were reverse transfected with 20 nM of each siRNA duplex using Opti‐MEM® I reduced serum medium and Lipofectamine RNAiMAX following the instructions of the manufacturer (Life Technologies). The Stealth RNAi siRNA kit for human ATG13, Beclin‐1 or ATG12 (Life Technologies) and the Stealth RNAi siRNA Negative Control Kit (Life Technologies) were used. In brief, after adding the siRNA‐lipid complex onto 60 mm dishes, cells (6–8 × 10⁵ per dish) were seeded and incubated in phenol red‐free DMEM/F‐12 supplemented with 10% FBS to induce gene silencing for 48–72 h for cell proliferation assays or for Western blotting. During preliminary experiments, we evaluated the three siRNAs for ATG13 (HSS114712, HSS114713 and HSS 114714), Beclin‐1 (HSS112741, HSS112742 and HSS 189498) and ATG12 (HSS113235, HSS113534 and HSS 189932) and elected to use HSS114713 for ATG13, HSS 189498 for Beclin‐1 and HSS113235 for ATG12, which most effectively induced gene silencing in both DES and EES cells, for further analysis (Supporting Information Figure S1A–F).
Western blotting
To investigate light chain 3 (LC3)‐II protein in DES and EES cells from the same patients (n = 10), cells in 60 mm dishes were incubated with 3 mL culture media (2% charcoal‐stripped FBS) (Sigma‐Aldrich) containing MK2206 (9 μM), chloroquine (50 μM), BafA1 (10 nM), MK2206 (9 μM) + chloroquine (50 μM), MK2206 (9 μM) + BafA1 (10 nM) or vehicle (DMSO) only for 4 h. Cell lysates were isolated using M‐PER Mammalian Protein Extraction Reagent (Thermo Scientific). Protein quantity in cell lysates was evaluated by the Bradford protein assay following the manufacturer's instructions (Bio‐Rad Laboratories). Samples of cell lysates (20 μg total protein) was loaded onto 4–15% SDS‐polyacrylamide gels and transferred to nitrocellulose membranes (GE Healthcare). Blots were processed as described in the SNAP i.d. Protein Detection System User Guide (Merck Millipore, Molsheim, France) as previously described (Matsuzaki and Darcha, 2013a,b, 2014). Nitrocellulose membranes were probed with antibodies directed against anti‐light chain 3 isoform B (LC3B) (D11, Cell Signaling Technology, Danvers, MA, USA), p62 (SQSTM1) (MBL, Nagoya, Japan), ATG13 (E1Y9V, Cell Signaling Technology), Beclin‐1 (D40C5, Cell Signaling Technology), ATG12 (D88H11, Cell Signaling Technology) or actin (Sigma‐Aldrich). The Western blot bands were quantified using ImageJ software (version 1.41, National Institutes of Health, Bethesda, MD, USA). Results were corrected by actin to normalize the loading.
Immunofluorescence staining for light chain 3 isoform B and p62 (SQSTM1) proteins
Cells (DES and EES cells from the same 10 patients) were seeded onto glass coverslips (22 × 22 mm) (5 × 10⁴ cells per coverslip). After 24 h at 37°C and 5% CO2, cells were incubated with 2 mL culture media (2% charcoal‐stripped FBS), containing MK2206 (9 μM), chloroquine (50 μM), BafA1 (10 nM), MK2206 (9 μM) + chloroquine (50 μM), MK2206 (9 μM) + BafA1 (10 nM) or vehicle (DMSO) only, for 4 h. Immunofluorescence staining for LC3B (D11, 1:100, Cell Signaling Technology) or p62 (SQSTM1) (1:500, MBL) was performed as previously described (Matsuzaki et al., 2017). The number of LC3 or p62 puncta per cell was quantified using ImageJ software (version 1.41). The average number of LC3 or p62 puncta per cell was quantified in at least 100 cells for each group using ImageJ software (version 1.41, National Institutes of Health), as previously described (Dagda et al., 2008).
Clonogenic assays
Cells (DES and EES cells from the same 10 patients) were plated in 12‐well plates at a density of 500 cells per well (in triplicate) and incubated for 24 h to allow for attachment. Cells were then treated with culture media (2% charcoal‐stripped FBS), in the absence or presence of chloroquine (50 μM), MK2206 (9 μM) or chloroquine (50 μM) + MK2206 (9 μM). Cells were washed twice with PBS after a 48 h treatment, followed by a 14 day culture in drug‐free medium with 10% FBS. Colonies were fixed and stained with Crystal Violet (Sigma‐Aldrich). Stains were solubilized with 30% acetic acid, and absorbance was measured at 595 nm using a Multiskan microplate reader (Thermo Scientific). Clonogenic growth was expressed as the percentage of the vehicle‐treated control cells to control for unwanted sources of variation.
Animals
All animal care and experimental procedures were in accordance with the guidelines set by the European Communities Council Directive (86/609/EEC) and with French legislation on animal research, and were approved by the Institutional review board of the University of Auvergne. The experiment was conducted under a licence from the French Ministry of Agriculture. Animal studies are reported in compliance with the ARRIVE guidelines (Kilkenny et al., 2010; McGrath and Lilley, 2015). Studies were conducted in adult female Swiss nude mice (n = 40, 7–8 weeks old, 23–25 g) (Iffa‐Credo, Lyon, France). Mice were housed four per cage and maintained in a barrier unit in a well‐controlled, pathogen‐free environment with regulated cycles of light/dark (12/12 h, 23–25°C) and allowed a 2 week period of acclimation to the vivarium before any procedures were performed. Mice had free access to food and water. After completion of the experiment, all mice were killed with an anaesthetic overdose.
Mouse model for endometriosis
A nude mouse model of endometriosis was used as previously described (Matsuzaki and Darcha, 2013b, 2014). Mouse models of endometriosis based on the xenotransplantation of human endometrium have been widely used for endometriosis research (Grümmer, 2006; Tirado‐González et al., 2010). These models permit testing of the efficacy of potential therapeutic compounds in human tissue in vivo and hence support clinical translation (Grümmer, 2006; Tirado‐González et al., 2010). Nude mice were implanted s.c. in the neck region with a pellet of 17β‐oestradiol (0.72 mg/60 day release; Innovative Research of America, Sarasota, FL, USA). Proliferative endometrial tissues from 10 patients were implanted into four mice simultaneously on day 0 (Supporting Information Figure S2A). A total of 40 nude mice received a single injection of 20 proliferative endometrial fragments (1–2 mm3) in 200 μL of serum‐free DMEM/F‐12. Subcutaneous injections were performed at a ventral midline site using 1 mL syringes and 18‐gauge needles. All procedures were performed under isoflurane anaesthesia.
On day 14, mice were randomized into four experimental groups. Endometriosis is characterized by dense fibrotic tissues (Giudice and Kao, 2004). Thus, we attempted to evaluate the effects of chloroquine + MK2206 on endometriotic implants after 14 days of implantation, when fibrosis was already established, based on the results of our previous study (Matsuzaki and Darcha, 2013b, 2014), to mimic clinical endometriosis. Each group of mice was given vehicle (30% Captisol p.o. gavage + PBS i.p.), chloroquine (30 mg·kg−1 in PBS once a day; i.p.), MK2206 (50 mg·kg−1 in 30% Captisol every other day; p.o. gavage) or MK2206 (50 mg·kg−1 in 30% Captisol every other day; p.o. gavage) + chloroquine (30 mg·kg−1 in PBS once a day; i.p., for 6 days). Intraperitoneal injections were given under isoflurane anaesthesia. Treatment was started on day 15, and mice were killed on day 21 (Supporting Information Figure S2A, B). Treatment regimens were determined during preliminary experiments (Supplementary methods). For sample analysis, each animal was marked on the tail using nontoxic permanent markers, and researchers were blinded to treatment groups. Volumes of endometriotic implants were measured by direct measurement with calipers. Volumes of endometriotic implants were estimated and calculated by the formula: π/6 × (length) × (width)2. Then, volume change after treatment (percentage of volume on day 21 relative to that on day 15 within the same mice) was calculated for each mouse. To monitor the overall well‐being of the mice, they were monitored, and their body weights were recorded daily.
Endometriotic implants were collected, fixed in 4% paraformaldehyde and embedded in paraffin for histopathological examination. TUNEL assays were performed using a commercially available kit, the In Situ Cell Death Detection Kit (Roche Diagnostics, Meylan, France), according to the manufacturer's specifications. Cell nuclei were stained with DAPI (Life Technologies). Slides were analysed with a Leica TCS SPE confocal laser‐scanning microscope (Leica Microsystems, Nanterre, France). The apoptotic index (percentage of TUNEL + cells among total number of DAPI‐stained nuclei) was calculated from the entire field of endometriotic lesions of each section.
Immunohistochemistry for phosphorylated Akt (pAkt), LC3 and p62
Immunohistochemical staining was performed on paraffin sections with a rabbit monoclonal antibody directed against pAkt (1:50, Cell Signaling Technology), a rabbit polyclonal antibody directed against LC3 (1:1000, MBL) or a rabbit polyclonal antibody directed against p62 (1:1000, MBL).
Cell nuclei were stained with DAPI (Life Technologies). The staining surface area for pAKT was computed using ImageJ software (version 1.41, National Institutes of Health for ImageJ software). The percentage of LC3+ cells or p62+ cells among the total number of DAPI‐stained nuclei was calculated from the entire field of endometriotic lesions of each section.
Data and statistical analysis
The data and statistical analysis comply with the recommendations on experimental design and analysis in pharmacology (Curtis et al., 2015). Results are shown as means ± SD unless otherwise noted. The STATA program version 12 (StataCorp, College Station, TX, USA) was used for statistical analysis. Comparisons between different groups were made using one‐way ANOVA following Scheffé's method, the Mann–Whitney U‐test or the Wilcoxon matched pairs signed‐ranks test. For ANOVA, the post hoc test was run only if F achieved statistical significance and no significant variance inhomogeneity was observed. Statistical significance was defined as P < 0.05.
Materials
U0126 and MK2206 were supplied by Selleck Chemicals (Houston, TX, USA). Chloroquine, BafA1 and 3‐MA were supplied by Sigma‐Aldrich.
Nomenclature of targets and ligands
Key protein targets and ligands in this article are hyperlinked to corresponding entries in http://www.guidetopharmacology.org/, the common portal for data from the IUPHAR/BPS Guide to PHARMACOLOGY (Southan et al., 2016), and are permanently archived in the Concise Guide to PHARMACOLOGY 2017/18 (Alexander et al., 2017).
Results
Effects of chloroquine alone, MK2206 + chloroquine and U0126 + MK2206 + chloroquine on cell growth and regrowth of EES and DES cells
Combination treatment with U0126 (30 μM) + MK2206 (9 μM) + chloroquine (50 μM) and with MK2206 (9 μM) + chloroquine (50 μM) was more effective in inhibiting cell growth and regrowth of both EES (Figure 1A, C) and DES cells (Figure 1B, D) compared with chloroquine alone. The combination of U0126 + MK2206 + chloroquine was more effective than the combination of MK2206 + chloroquine in EES cells (Figure 1A, C). However, in DES cells, no significant differences were observed in cell growth or regrowth of cells treated with either of the combination treatments, U0126 + MK2206 + chloroquine or MK2206 + chloroquine (Figure 1B, D).
Figure 1.
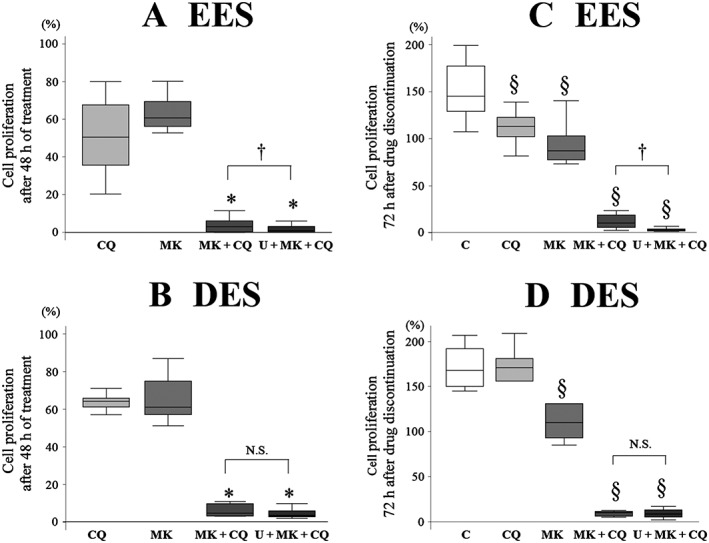
Comparison of (A, B) cell growth and (C, D) regrowth after treatment with chloroquine (CQ: 50 μM) alone, MK2206 (MK, 9 μM) + CQ or U0126 + MK2206 + CQ in (A, C) EES (n = 16) and (B, D) DES cells (n = 12) grown on plastic. Per cent cell proliferation was calculated as per cent of vehicle control after the 48 h treatments. Data are shown as box and whisker plots showing medians and the smallest and largest data points ≤1.5 × interquartile range from the 25th and 75th percentiles respectively. *P < 0.05, significantly different from CQ alone and MK alone; § P < 0.05, significantly different from control (vehicle alone): † P<0.05, significantly different as indicated. C, control (vehicle alone); U, U0126 (30 μM); N.S., not statistically significant.
Previous studies including ours showed that it is critical to model in vivo tissue compliance conditions in vitro to fully investigate cell responses to drugs (Zustiak et al., 2014; Holle et al., 2016; Matsuzaki et al., 2017). Therefore, we evaluated the effects of substrates of varying stiffness on inhibition of cell proliferation. We elected to use PGS of two different degrees of stiffness, 2 kPa (soft) or 30 kPa (rigid), based on the results of our previous study (Matsuzaki et al., 2016). The soft substrate (2 kPa PGS) and the rigid substrate (30 kPa PGS) are considered to mimic in vivo tissue compliance of the endometrium and DIE respectively (Matsuzaki et al., 2016). No significant difference was observed in cell growth or regrowth of EES cells grown on substrates of varying stiffness (2 or 30 kPa PGS or plastic) after treatment with either U0126 + MK2206 + chloroquine or MK2206 +chloroquine (Figure 2A, C). In addition, no significant differences in cell growth and regrowth of DES cells grown on 30 kPa PGS and plastic were observed after treatment with either U0126 + MK2206 + chloroquine or MK2206 + chloroquine (Figure 2B, D). Thus, we elected to use the combination of MK2206 + chloroquine for further analysis, and we performed in vitro experiments in cells grown on plastic.
Figure 2.
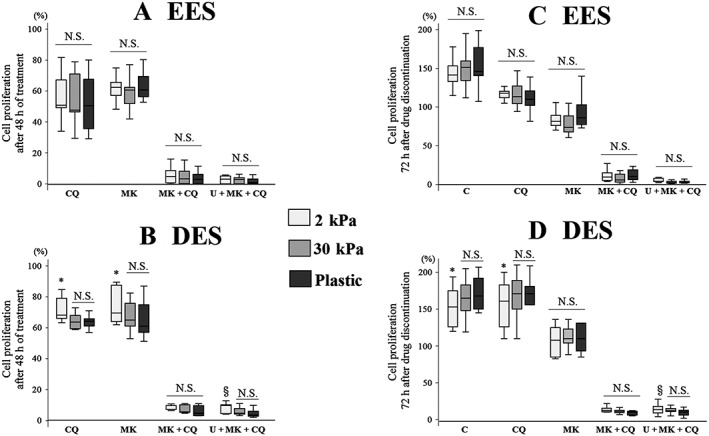
Comparison of (A, B) cell growth and (C, D) regrowth after treatment with chloroquine (CQ; 50 μM) alone, MK2206 (MK, 9 μM) + CQ or U0126 + MK2206 + CQ in (A, C) EES (n = 16) and (B, D) DES cells (n = 12) grown on PGS of varying stiffness (2 or 30 kPa) or plastic. Per cent cell proliferation was calculated as per cent of vehicle control after the 48 h treatments. Data are shown as box and whisker plots showing medians and the smallest and largest data points ≤1.5 × interquartile range from the 25th and 75th percentiles respectively. *P < 0.05, 2 kPa PGS significantly different from 30 kPa PGS and plastic; § P < 0.05, 2 kPa PGS significantly different from plastic. C, control (vehicle alone); U, U0126 (30 μM); N.S., not statistically significant.
Effects of treatment with chloroquine alone, MK2206 alone or the combination of MK2206 + chloroquine on apoptosis
The percentages of Annexin V‐positive cells treated with MK2206 + chloroquine in EES cells and those treated with MK2206 alone or MK2206 + chloroquine in DES cells were significantly higher compared with that in vehicle‐treated cells (Supporting Information Figure S3). However, no significant difference in the percentage of Annexin V‐positive cells was observed among either EES or DES cells treated with chloroquine alone, MK2206 alone or MK2206 + chloroquine.
Long‐term survival of EES and DES cells after treatment with MK2206 + chloroquine
Clonogenic assays showed that treatment with chloroquine alone, MK2206 alone or MK2206 + chloroquine significantly decreased colony formation compared with treatment with vehicle alone, in both DES (Figure 3A, C) and EES cells (Figure 3B, C). Treatment with MK2206 + chloroquine significantly decreased colony formation compared with treatment with either drug alone in DES cells (Figure 3A). However, in EES cells, treatment with MK2206 + chloroquine significantly decreased colony formation compared with MK2206 alone, whereas no significant difference in colony formation was observed between cells treated with chloroquine alone and those treated with MK2206 + chloroquine (Figure 3B).
Figure 3.
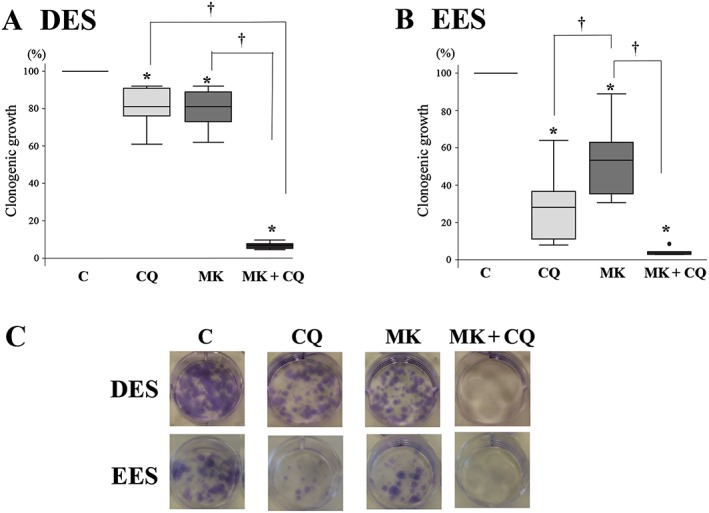
Clonogenic assay in DES and EES cells within the same patients (n = 10) after treatment with chloroquine (CQ; 50 μM) alone, MK2206 (MK, 9 μM) alone or MK2206 (9 μM) + CQ (50 μM). (A) Clonogenic survival relative to the control sample for (A) DES and in (B) EES cells. Data are shown as box and whisker plots showing medians and the smallest and largest data points ≤1.5 × interquartile range from the 25th and 75th percentiles respectively. *P < 0.05, significantly different from control (vehicle alone); † P<0.05, significantly different as indicated. (C) Representative photomicrograph of fixed colonies with Crystal Violet staining.
In vivo effects of MK2206 + chloroquine in a mouse model of endometriosis
During the experimental period, all mice survived, and no significant differences in body weight were observed among the four experimental groups. All of the mice in the present study developed histologically confirmed endometriotic lesions with glandular structures and stroma.
Expression of phosphorylated Akt was significantly decreased in endometriotic implants treated with either MK2206 alone or MK2206 + chloroquine, compared with those treated with vehicle alone or chloroquine alone (Supporting Information Figure S4A, B). LC3 expression was significantly increased in endometriotic implants treated with chloroquine alone, MK2206 alone or MK2206 +chloroquine, compared with those treated with vehicle alone (Supporting Information Figure S4A, B). p62 expression was significantly increased in endometriotic implants treated with chloroquine alone compared with those treated with vehicle alone (Supporting Information Figure S4A, B). No significant difference in p62 expression was observed among endometriotic implants treated with MK2206 alone, MK2206 + chloroquine or vehicle alone (Supporting Information Figure S4A, B). Combined treatment with MK2206 + chloroquine significantly decreased the size of endometriotic lesions compared with treatment with either drug alone (Figure 4A, B). However, treatment with either drug alone did not significantly affect the size of endometriotic implants compared with treatment with vehicle alone (Figure 4A, B). TUNEL assays demonstrated that no or few positive epithelial cells were present in endometriotic implants treated with chloroquine alone, MK2206 alone or MK2206 + chloroquine. A significantly higher percentage of TUNEL‐positive stromal cells were present in endometriotic implants treated with chloroquine alone, MK2206 alone or MK2206 + chloroquine, compared with those treated with vehicle alone (Figure 4C, D). A significantly higher percentage of TUNEL‐positive stromal cells was present in endometriotic implants treated with MK2206 + chloroquine compared with those treated with either drug alone (Figure 4C, D).
Figure 4.
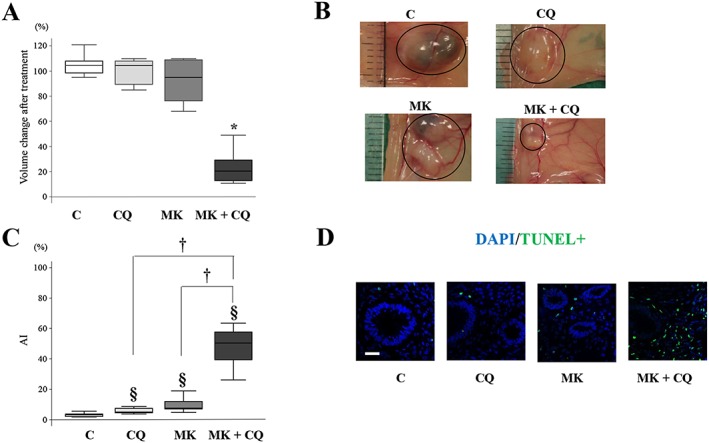
Effects of treatment with vehicle alone (n = 10), chloroquine (CQ) alone (n = 10), MK2206 (MK) alone (n = 10) or MK2206 + CQ (n = 10) on endometriotic implants in a mouse model of endometriosis. (A) Change of volume of the endometriotic implants after treatment on day 21. *P < 0.05, significantly different from control (vehicle alone), CQ alone and MK2206 alone. (B) Representative photomicrograph of endometriotic implants on day 21. (C) Apoptotic index (AI) of stromal cells in endometriotic implants. § P < 0.05, significantly different from control (vehicle alone); † P<0.05, significantly different as indicated. (D) Representative photomicrograph of TUNEL staining in endometriotic implants. Scale bar: 50 μm. Data are shown as box and whisker plots showing medians and the smallest and largest data points ≤ 1.5 × interquartile range from the 25th and 75th percentiles respectively.
Effects of MK2206 + chloroquine on expression of two autophagy markers, LC3 and p62 protein
To investigate whether autophagy induced by MK2206 could be inhibited by chloroquine or BafA1, we performed immunofluorescence staining for LC3 and p62 protein (Figure 5A–C) and Western blot analysis for LC3‐II and p62 protein (Figure 5D–F). The average number of LC3‐positive puncta per cell was significantly higher after treatment with chloroquine and BafA1 and that of MK2206 compared with that of the vehicle‐treated control, in both DES and EES cells (Figure 5A, B). The average number of LC3‐positive puncta per cell after treatment with MK2206 + chloroquine or MK2206 + BafA1 was significantly higher compared with that of chloroquine alone, BafA1 alone or MK2206 alone in both DES and EES cells (Figure 5A, B). The average number of p62‐positive puncta per cell was significantly higher after treatment with chloroquine and BafA1, whereas no significant difference was observed after treatment with MK2206, compared with that of the vehicle‐treated control in either DES or EES cells (Figure 5A, C). The average number of p62‐positive puncta per cell after treatment with MK2206 + chloroquine or MK2206 + BafA1 was significantly lower compared with that of chloroquine alone or BafA1 alone in both DES and EES cells (Figure 5A, C). Western blot analysis showed that expression of LC3‐II was significantly increased after treatment with chloroquine and BafA1 and that with MK2206 compared with that of the vehicle‐treated control in both DES and EES cells (Figure 5D, E). The expression of LC3‐II after treatment with MK2206 + chloroquine or MK2206 + BafA1 was significantly higher compared with that of chloroquine alone, BafA1 alone or MK2206 alone in both DES and EES cells (Figure 5D, E). Expression of p62 protein was significantly increased after treatment with chloroquine and BafA1, but no significant increase was observed after treatment with MK2206 compared with that of the vehicle‐treated control in both DES and EES cells (Figure 5D, F). The expression of p62 after treatment with MK2206 + chloroquine or MK2206 + BafA1 was significantly lower compared with that of chloroquine alone or BafA1 alone, in both DES and EES cells (Figure 5D, F).
Figure 5.
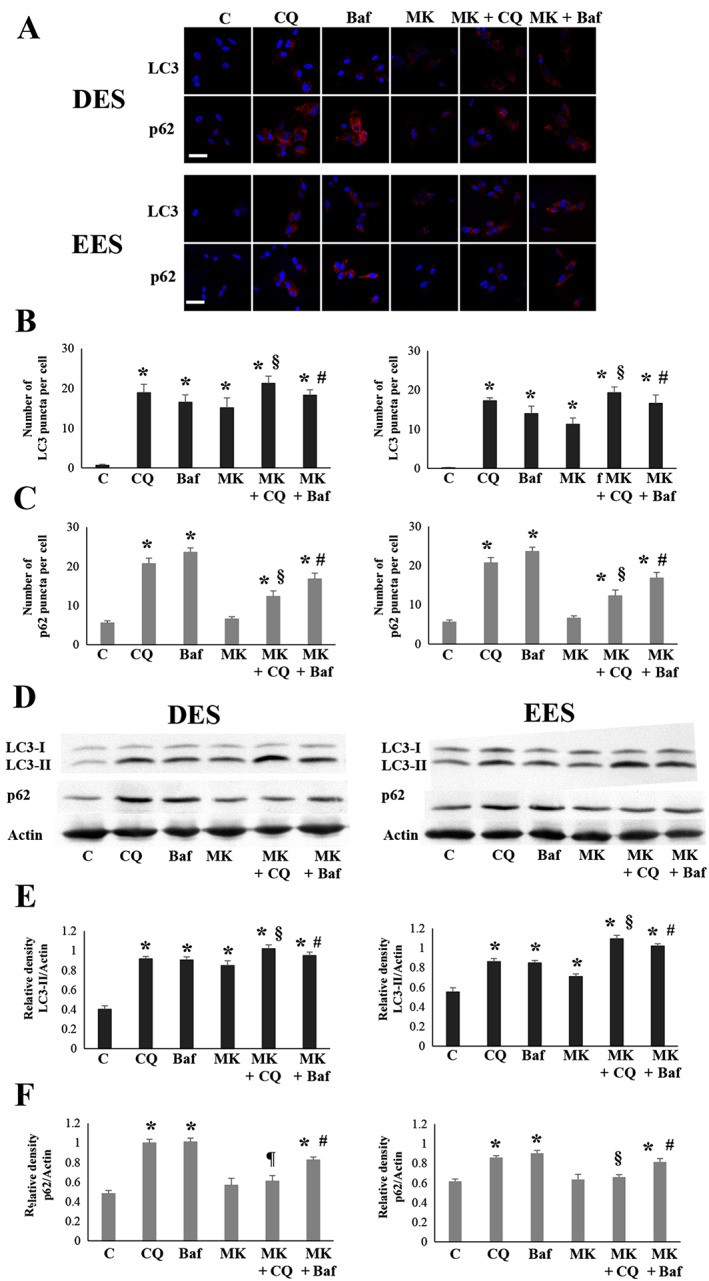
LC3 and p62 protein expression after treatment with chloroquine (CQ; 50 μM) alone, BafA1 (10 nM), alone, MK2206 (MK, 9 μM) alone, MK2206 (9 μM) + CQ (50 μM) or MK2206 (9 μM) + BafA1 (10 nM), in EES (n = 10) and DES cells (n = 10). (A) Representative photomicrograph of immunofluorescence staining for LC3B and p62 protein. Scale bar: 50 μm. (B) The number of LC3 puncta per cell. *P < 0.05, significantly different from control (vehicle alone); § P < 0.05, significantly different from CQ alone and MK2206 alone; # P < 0.05, significantly different from BafA1 alone and MK2206 alone. (C) The number of p62 puncta per cell. *P < 0.05, significantly different from control (vehicle alone); § P < 0.05, significantly different from CQ alone and MK2206 alone; # P < 0.05, significantly different from BafA1 alone and MK2206 alone. (D) Representative photomicrograph of Western blot analysis for LC3‐II and p62 protein. (E) Relative expression level of LC3‐II protein. *P < 0.05, significantly different from control (vehicle alone); § P < 0.05, significantly different from CQ alone and MK2206 alone; # P < 0.05, significantly different from BafA1 alone and MK2206 alone. (F) Relative expression level of p62 protein. *P < 0.05, significantly different from control (vehicle alone); ¶ P < 0.05, significantly different from CQ alone; # P < 0.05, significantly different from BafA1 alone and MK2206 alone. Data are shown as the mean ± SD. C, control (vehicle alone).
Effects of combination treatment of MK2206 with other pharmacological autophagy inhibitors
To investigate whether chloroquine could enhance the inhibitory effects of cell proliferation by MK2206 in an autophagy‐dependent manner, we further investigated whether other pharmacological autophagy inhibitors, BafA1 and 3‐MA, could also sensitize the cell proliferation inhibitory effects of MK2206 in DES, EES and NEES cells. Numerous studies have shown that endometrium of patients with endometriosis may differ biochemically from that of patients without endometriosis (Giudice and Kao, 2004). Therefore, both EES and NEES cells were included for comparison. Combined treatment with MK2206 + chloroquine produced a synergistic effect in DES, EES and NEES cells in terms of ED50, ED75 and ED90 (Table 1). Combined treatment with MK2206 + BafA1 produced a synergistic effect in EES and NEES cells for ED50, ED75 and ED90, whereas in DES cells, a synergistic effect was observed only for ED50 (Table 1). Combined treatment with MK2206 + 3‐MA did not produce a synergistic effect in either DES or EES cells. In NEES cells, combined treatment with MK2206 + 3‐MA produced a synergistic effect with respect to ED75 and ED90 (Table 1).
Table 1.
CI as a function of ED (ED50, ED75 or ED90) in DES (n = 12), EES (n = 12) and NEES cells (n = 10)
| DES | EES | NEES | |
|---|---|---|---|
| CI: MK2206 + chloroquine | |||
| ED50 | 0.19 (0.27) | 0.28 (0.28) | 0.27 (0.44) |
| ED75 | 0.18 (0.27) | 0.26 (0.28) | 0.19 (0.35) |
| ED90 | 0.24 (0.23) | 0.33 (0.24) | 0.11 (0.32) |
| CI: MK2206 + BafA1 | |||
| ED50 | 0.43 (0.11) | 0.33 (0.53) | 0.53 (0.33) |
| ED75 | 1.47 (1.97) | 0.31 (0.51) | 0.41 (0.34) |
| ED90 | 3.81 (2.76) | 0.54 (0.63) | 0.37 (0.23) |
| CI: MK2206 + 3‐MA | |||
| ED50 | 1.30 (0.51) | 0.95 (0.43) | 1.07 (0.36) |
| ED75 | 1.30 (0.68) | 1.39 (0.56) | 0.70 (0.41) |
| ED90 | 1.24 (0.43) | 2.56 (2.2) | 0.51 (0.42) |
CI <0.9, 0.9–1.1 and >1.1 represent synergism, additivity and antagonism respectively. Data are shown as median and interquartile range of CI.
Effects of ATG13, Beclin‐1 and ATG12 knockdown on LC‐3 and p62 protein expression after treatment with chloroquine alone, BafA1 alone or MK2206 alone
Recent studies have shown that BafA1 inhibits canonical autophagy, whereas chloroquine inhibits canonical autophagy and activates a parallel non‐canonical autophagy pathway (Florey et al., 2015; Jacquin et al., 2017). In addition, several known inducers of autophagy are also potent activators of non‐canonical autophagy (Jacquin et al., 2017). Our previous study showed that MK2206 alone significantly increased levels of phosphorylated ERK in DES cells compared with those of vehicle‐treated cells (Matsuzaki and Darcha, 2015). Furthermore, ERK activation is involved in autophagy induction (He and Klionsky, 2009). To investigate whether chloroquine and/or MK2206 also induce non‐canonical autophagy in DES and/or EES cells, we evaluated effects of ATG13 knockdown on LC3‐II and p62 protein expression after treatment with chloroquine alone, BafA1 alone or MK2206 alone. ATG13 is a part of the http://guidetopharmacology.org/GRAC/FamilyDisplayForward?familyId=639 complex, which is essential for the initiation of canonical autophagy (Mizushima, 2007; Yang and Klionsky, 2009). ATG13 knockdown significantly decreased LC3‐II expression after treatment with BafA1 alone, whereas ATG13 knockdown had no significant effect on LC3‐II expression after treatment with chloroquine alone compared with siRNA controls in both DES and EES cells (Supporting Information Figure S5C, D, G, H, I, K). ATG13 knockdown significantly decreased LC3‐II expression in EES cells, whereas ATG13 knockdown had no significant effect on LC3‐II expression in DES cells after treatment with MK2206 alone, compared with siRNA controls (Supporting Information Figure S5E, F, I, K). ATG13 knockdown significantly decreased p62 expression compared with expression of siRNA controls after treatment with chloroquine alone or BafA1 alone in both DES and EES cells (Supporting Information Figure S5C, D, G, H, J, L). ATG13 knockdown had no significant effect on p62 expression compared with siRNA controls after treatment with MK2206 alone in both DES and EES cells (Supporting Information Figure S5E, F, J, L). These results indicate that chloroquine induces non‐canonical autophagy in both EES and DES cells, whereas MK2206 induces non‐canonical autophagy only in DES cells.
Next, we further investigated whether Beclin‐1 and/or ATG12 knockdown could inhibit non‐canonical autophagy in EES and/or DES cells after treatment with chloroquine alone or MK2206 alone. Beclin‐1 knockdown did not significantly change LC3‐II expression, whereas ATG12 knockdown significantly decreased LC3‐II expression after treatment with chloroquine alone compared with siRNA controls in both DES and EES cells (Supporting Information Figure S5C, D, I, K). p62 expression was significantly lower in cells transfected with Beclin‐1 or ATG12 after treatment with chloroquine alone compared with siRNA controls in both DES and EES cells (Supporting Information Figure S5C, D, J, L). Beclin‐1 and ATG12 knockdown significantly decreased LC3‐II expression after treatment with MK2206 alone compared with siRNA controls in EES cells (Supporting Information Figure S5F, K). In DES cells, ATG12 knockdown significantly decreased LC3‐II expression, whereas Beclin‐1 knockdown significantly increased LC3‐II expression after treatment with MK2206 alone compared with siRNA controls (Supporting Information Figure S5E, I). Beclin‐1 and ATG12 knockdown had no significant effect on p62 expression in cells transfected with Beclin‐1 or ATG12 after treatment with MK2206 alone compared with siRNA controls in either DES or EES cells (Supporting Information Figure S5E, F, J, L). These results indicate that ATG12 knockdown, but not Beclin‐1 knockdown, inhibits non‐canonical autophagy induced by chloroquine in DES and EES cells and that by MK2206 in DES cells.
Effects of ATG13, Beclin‐1 or ATG12 knockdown on the cell inhibitory effects of treatment with MK2206 and chloroquine alone or in combination
An antagonistic effect of combined treatment with MK2206 and 3‐MA in DES cells (Table 1) suggested that the inhibition of early‐stage autophagy may not sensitize the cell inhibitory effects of MK2206 in DES cells. We then investigated the effects of the inhibition of early‐stage autophagy by Beclin‐1 knockdown on the effects of treatment with MK2206 or chloroquine alone or in combination. Beclin‐1 knockdown significantly attenuated the inhibitory effect of cell proliferation of chloroquine treatment on DES cells (Supporting Information Figure S6A), whereas no significant effects on the inhibitory effects of cell proliferation of either chloroquine alone (Supporting Information Figure S6B) were observed in EES cells. Beclin‐1 knockdown significantly attenuated the inhibitory effects of MK2206 alone and MK2206 + chloroquine in both DES (Supporting Information Figure S6A) and EES cells (Supporting Information Figure S6B). However, the ATG proteins, including Beclin‐1, may not be entirely specific for autophagy (Barth et al., 2010; Mizushima et al., 2010; Klionsky et al., 2012). Thus, we further investigated the effects of knockdown of two other ATG proteins, ATG13 and ATG12. To minimize individual differences, we investigated in parallel the effects of ATG13, Beclin‐1 and ATG12 knockdown in the same cells (Supporting Information Figure S7A–F). ATG13, Beclin‐1 or ATG12 knockdown significantly attenuated the inhibitory effect of cell proliferation of chloroquine treatment in DES cells (Figure 6A), whereas no significant effects on the inhibitory effects of cell proliferation of either chloroquine alone were observed in EES cells (Figure 7A). ATG13 and Beclin‐1 knockdown significantly attenuated the inhibitory effects of MK2206 alone, whereas ATG12 knockdown significantly enhanced the inhibitory effect of MK2206 alone in DES cells (Figure 6B). In EES cells, ATG13, Beclin‐1 and ATG12 knockdown significantly attenuated the inhibitory effects of MK2206 alone (Figure 7B). ATG13, Beclin‐1 and ATG12 knockdown significantly attenuated the inhibitory effects of MK2206 and chloroquine in both DES (Figure 6C) and EES cells (Figure 7C). ATG13, Beclin‐1 nor ATG12 knockdown had significant inhibitory effects on cell proliferation compared with siRNA controls in both EES and DES cells (Supporting Information Figure S8). In NEES cells, no significant effects of ATG13, Beclin‐1 or ATG12 knockdown on the cell proliferation inhibitory effects of chloroquine, MK2206 or MK + chloroquine treatment were observed (Supporting Information Figure S9).
Figure 6.
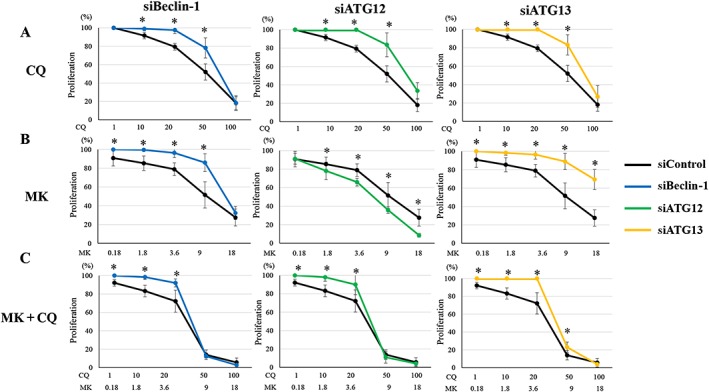
Effects of ATG13, Beclin‐1 or ATG12 knockdown on cell proliferation after treatment with chloroquine (CQ) alone, MK2206 (MK) alone or MK2206 + CQ in DES cells (n = 6). *P < 0.05, siRNA targeting Beclin‐1 (siBeclin‐1), ATG12 (siATG12) or ATG13 (siATG13) significantly different from siRNA negative control (siControl). Cells were transfected with siBeclin‐1, siATG12, siATG13 or siControl. Data are shown as the means ± SD.
Figure 7.
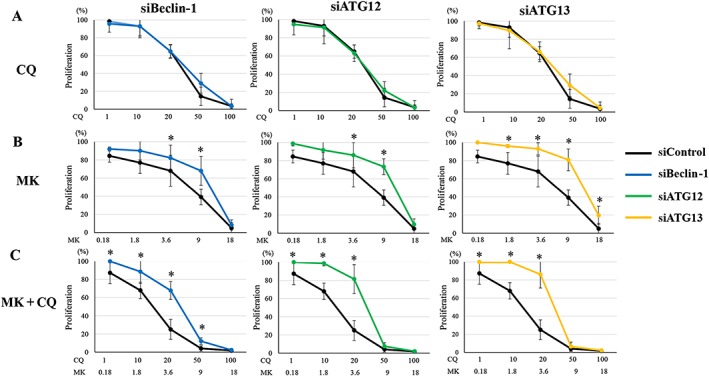
Effects of ATG13, Beclin‐1 or ATG12 knockdown on cell proliferation after treatment with chloroquine (CQ) alone, MK2206 (MK) alone or MK2206 + CQ in EES cells(n = 6). *P < 0.05: siRNA targeting Beclin‐1 (siBeclin‐1), ATG12 (siATG12) or ATG13 (siATG13) versus siRNA negative control (siControl). Cells were transfected with siBeclin‐1, siATG12, siATG13 or siControl. Data shown are means ± SD.
Effects of ATG13, Beclin‐1 or ATG12 knockdown on regrowth of DES, EES and NEES cells after treatment with MK2206 and chloroquine alone or in combination
We further investigated the effects of ATG13, Beclin‐1 and ATG12 knockdown on regrowth of DES, EES and NEES cells after drug treatment in the same cells (Supporting Information Figure S7). In both EES (Figure 8B) and NEES cells (Supporting Information Figure S10), proliferation of cells with ATG13, Beclin‐1 or ATG12 knockdown or with siRNA control was significantly increased after a 72 h discontinuation of treatment with vehicle alone, chloroquine alone, MK2206 alone or MK2206 + chloroquine. Cell proliferation of cells with ATG13, Beclin‐1 or ATG12 knockdown was significantly higher compared with that of siRNA control after chloroquine treatment in both EES (Figure 8B) and NEES cells (Supporting Information Figure S7).
Figure 8.
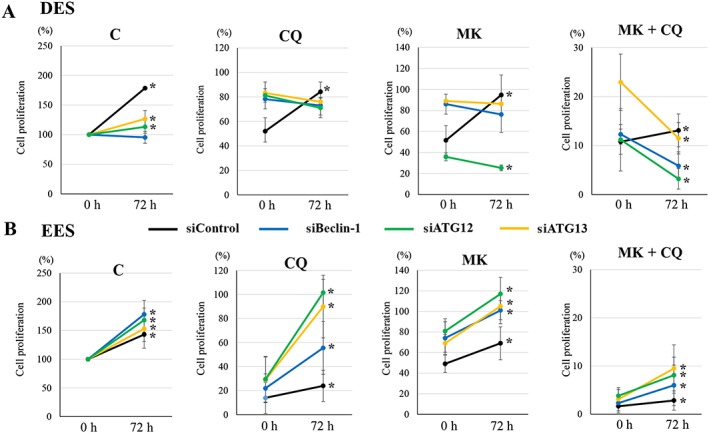
Effects of ATG13, Beclin‐1 or ATG12 knockdown on cell regrowth after drug discontinuation with vehicle alone, chloroquine (CQ; 50 μM) alone, MK2206 (MK, 9 μM) alone or MK (9 μM) + CQ (50 μM), in DES and EES cells from the same patients (n = 6). *P < 0.05, 0 h (after the 48 h treatments) significantly different from 72 h after drug discontinuation. Cells were transfected with siRNA targeting Beclin‐1 (siBeclin‐1), ATG12 (siATG12), ATG13 (siATG13) or siRNA negative control (siControl). Per cent cell proliferation was calculated as per cent of vehicle control after the 48 h treatments (at 0 h). Data shown are means ± SD. C, control (vehicle alone).
In DES cells, proliferation of cells with ATG13 or ATG12 knockdown, or siRNA control, was significantly increased after a 72 h discontinuation of treatment, whereas no significant change was observed with Beclin‐1 knockdown in vehicle‐treated cells (Figure 8A). Cell proliferation of cells with siRNA control was significantly increased after a 72 h discontinuation of treatment with chloroquine alone, MK2206 alone or MK2206 + chloroquine (Figure 8A). However, proliferation of cells with ATG13, Beclin‐1 or ATG12 knockdown was significantly decreased after a 72 h discontinuation of treatment with MK2206 + chloroquine (Figure 8A). No significant change in proliferation of cells with ATG13, Beclin‐1 or ATG12 knockdown after a 72 h discontinuation of treatment with chloroquine alone was observed (Figure 8A). After MK2206 treatment, proliferation of cells with ATG13 or Beclin‐1 knockdown was significantly increased, whereas that with siRNA ATG12 was significantly decreased (Figure 8A).
Effects of chloroquine alone, MK2206 alone or MK2206 + chloroquine on Beclin‐1 and ATG12–ATG5 protein expression
Beclin‐1 protein expression was significantly increased in cells treated with MK2206 alone and MK2206 + chloroquine compared with cells treated with vehicle alone or chloroquine alone in both DES (Supporting Information Figure S11A, B) and EES cells (Supporting Information Figure S11C, D). No significant difference in Beclin‐1 protein expression in cells treated with chloroquine alone compared with cells treated with vehicle alone was observed in either DES (Supporting Information Figure S11E, F) or EES cells (Supporting Information Figure S11G, H). Furthermore, no significant difference in ATG12–ATG5 protein expression was observed in cells treated with chloroquine alone, MK2206 alone or MK2206 + chloroquine compared with cells treated with vehicle alone, in both DES and EES cells (Supporting Information Figure S11E–H).
Discussion
The present study showed that combined treatment with MK2206 + chloroquine significantly inhibited cell growth and regrowth of DES cells in vitro and decreased the size of endometriotic implants in a mouse xenograft model of endometriosis, compared with treatment with either drug alone. The present findings suggest that combined treatment with MK2206 + chloroquine may be effective in patients with endometriosis. The ideal drug for patients with endometriosis should affect only diseased endometriotic lesions and not affect ‘normal’ endometrium in the same patient. However, the IC50 of combined treatment with MK2206 + chloroquine was significantly lower in EES, compared with that of DES cells within the same patients (Supporting Information Table S3). Combined treatment with MK2206 + chloroquine may therefore more significantly affect cell growth of EES, than that of DES cells in the same patient.
In the present study, all of the mice developed histologically confirmed endometriotic lesions with glandular structures and stroma. TUNEL‐positive cells were observed in stromal cells of endometriotic implants, and no or few apoptotic epithelial cells were observed in endometriotic implants in mice treated with MK2206 + chloroquine. It is possible that MK2206 + chloroquine might inhibit cell proliferation to a greater degree in EES cells compared with endometrial epithelial cells (EEE) and so we further investigated the effects of MK2206 + chloroquine on cell proliferation of EEE and EES cells from the same patients. However, the present in vitro analysis showed that the IC50 dose for MK2206 + chloroquine was significantly lower in EEE compared with EES cells within the same patient (Supporting Information Table S4). The EEE cells might be protected by their micro‐environments, as many studies have demonstrated important protective roles of the micro‐environment in cancer (Quail and Joyce, 2013). Combined treatment with MK2206 + chloroquine induced apoptosis in the micro‐environment, resulting in a reduction of the size of the endometriotic implants. However, the present study showed that combined treatment with MK2206 + chloroquine did not significantly induce apoptosis in vitro. Because the duration of the combined treatment in vivo was longer than that in vitro, a potential explanation for the discrepancy between the in vitro and in vivo findings may be that a longer duration of combined treatment might significantly induce apoptosis in vivo. In contrast to the present findings, hydroxychloroquine treatment alone before implantation of uterine fragments onto peritoneum disrupts endometriotic epithelial cells but does not significantly affect the size of the endometriotic implants (Ruiz et al., 2016). These findings suggest that targeting the micro‐environment might be an effective therapeutic strategy for inhibiting the growth of endometriosis.
A limitation of the present mouse model is that it is not possible to investigate whether endometriotic implants can regrow and whether autophagy is required for regrowth after discontinuation of treatment. Currently, no small animal models of endometriosis are available to investigate recurrence after medical treatment (Vanhie et al., 2016). Development of such models that closely mimic the clinical scenario of endometriosis could greatly contribute to the development of novel therapeutic strategies in patients with endometriosis.
The present study showed that the IC50 of chloroquine was significantly lower in EES than DES cells from the same patient (Supporting Information Table S3). The present clonogenic assay showed that chloroquine alone more significantly affected survival of EES cells, compared with that of DES cells from the same patient. In addition, chloroquine alone had no significant effect on the growth inhibition of endometriotic implants in the present mouse model of endometriosis, when treatment was started after development of endometriotic implants. These findings do not support the use of chloroquine or hydroxychloroquine alone for the treatment of patients who have already had endometriosis. However, hydroxychloroquine alone before implantation of uterine fragments onto peritoneum decreased lesion numbers in a mouse model of endometriosis (Ruiz et al., 2016). Further studies are thus required to investigate whether chloroquine or hydroxychloroquine alone could be an effective novel strategy for prevention of the development of endometriosis.
Chloroquine inhibits autophagosome–lysosome fusion, which occurs during late‐stage autophagy, causing accumulation of non‐functional autophagosomes (Mizushima, 2007; Yang and Klionsky, 2009). Autophagy can be also blocked upstream of autophagosome formation, resulting in a limited number of autophagosomes and reduced autophagic activity (Galluzzi et al., 2017). The present study showed that chloroquine also induced non‐canonical autophagy in both DES and EES cells. Non‐canonical autophagy induced by chloroquine was not inhibited by Beclin‐1 knockdown in either DES or EES cells. The present Western blot analysis showed that MK2206 alone significantly increased Beclin‐1 protein expression, whereas chloroquine alone had no effect. The present results revealed no significant change in ATG12 protein expression after treatment with either chloroquine alone or MK2206 alone. However, the conjugation of ATG12 to ATG5 is not a suitable molecular readout of autophagy, because this conjugation is not dependent on induction of autophagy, and ATG5–ATG12 dissociates from the autophagosome. These findings suggest that non‐canonical autophagy induced by chloroquine may be Beclin‐1 independent. The present in vitro findings showed that upstream inhibition of autophagosome formation by ATG13, Beclin‐1 or ATG12 knockdown had no significant effects on the inhibitory effects of chloroquine with respect to cell proliferation in EES cells, suggesting that the inhibitory effects of chloroquine on EES cell proliferation are not due to accumulation of non‐functional autophagosomes. Furthermore, the present results showed no significant difference in the cell inhibitory effects of chloroquine in cells transfected with ATG13, Beclin‐1 or ATG12, suggesting that non‐canonical autophagy may not play a significant role in proliferation of EES cells. In contrast, the inhibitory effects of chloroquine on DES cell proliferation may be due to accumulation of non‐functional autophagosomes, as ATG13, Beclin‐1 or ATG12 knockdown significantly attenuated the inhibitory effects of chloroquine on proliferation. Thus, the inhibitory effects of chloroquine on DES cell proliferation may be autophagy‐dependent, whereas it may not be autophagy‐dependent in EES cells.
Inhibition of canonical autophagy induced by MK2206 by ATG13, Beclin‐1 or ATG12 knockdown attenuated the cell proliferation inhibitory effects of MK2206 on EES cells, suggesting that canonical autophagy plays a growth inhibitory role in these cells. No significant differences in proliferation were observed after a 48 h treatment with chloroquine in cells transfected with siRNA control, siRNA ATG13, siRNA Beclin‐1 or siRNA ATG12. However, inhibition of canonical autophagy by ATG13, Beclin‐1 or ATG12 knockdown significantly enhanced cell regrowth of EES cells, compared with that with siRNA control after discontinuation of chloroquine treatment, suggesting that canonical autophagy plays a growth inhibitory role in EES cells. In contrast, in DES cells, inhibition of canonical and non‐canonical autophagy by ATG12 knockdown enhanced the inhibitory effect of MK2206, whereas inhibition of canonical autophagy alone by either ATG13 or Beclin‐1 knockdown attenuated the inhibitory effects of MK2206, suggesting that non‐canonical autophagy in DES cells may be a type of cytoprotective autophagy in these cells. In addition, ATG13, Beclin‐1 and ATG12 knockdown attenuated cell regrowth of DES cells after discontinuation of drug treatment, suggesting that canonical autophagy may also represent cytoprotective autophagy in DES cells. The present study showed that Beclin‐1 knockdown significantly increased LC3‐II expression and ATG13 knockdown did not change LC3‐II expression compared with siRNA control in DES cells. We speculate that inhibition of canonical autophagy by either ATG13 or Beclin‐1 knockdown alone may further stimulate MK2206‐induced non‐canonical autophagy to support compensatory mechanisms, resulting in attenuation of the inhibitory effects of MK 2206 on DES cells. Further studies are required to investigate the molecular mechanisms of activation and roles of non‐canonical autophagy in endometriosis.
The present results demonstrated that chloroquine markedly sensitized both DES and EES cells to MK2206. A previous study showed that enhanced cell growth inhibition of Akt gene knockdown in combination with chloroquine is due to the accumulation of non‐functional autophagosomes by chloroquine (Degtyarev et al., 2008). The present study revealed antagonistic effects of combined MK2206 + 3‐MA in both DES and EES cells. Inhibition of upstream autophagosome formation by ATG13, Beclin‐1 or ATG12 knockdown attenuated the cell proliferation inhibitory effects of chloroquine + MK2206 on both EES and DES cells. Another study also showed that inhibition of late‐stage autophagy by chloroquine and Rab7 knockdown, but not early‐stages autophagy by 3‐MA and Beclin‐1 knockdown, enhanced the cytotoxicity of an autophagy‐inducing drug, arsenic trioxide, in glioblastoma multiforme cell lines (Li et al., 2015a). These findings suggest that the accumulation of non‐functional autophagosomes is required to enhance the cell growth inhibitory effects of MK2206 in both DES and EES cells.
The present study showed that autophagy inhibition by ATG13, Beclin‐1 or ATG12 knockdown alone had no significant effect on the inhibition of cell proliferation in either EES or DES cells. However, the present results also suggest distinct roles of canonical autophagy on cell regrowth after discontinuation of drug treatment between EES, which are non‐diseased cells, and DES, which are diseased cells. Autophagy plays a role in the induction of senescence and non‐apoptotic cell death (Yang et al., 2011a). Canonical autophagy may maintain normal EES cell proliferation after discontinuation of drug treatment. In contrast, cell regrowth of DES cells transfected with ATG13, Beclin‐1 or ATG12 siRNAs was significantly inhibited after MK 2206 + chloroquine treatment. In DES cells, activation of canonical autophagy may be required for cell regrowth, when the number of cells that can survive drug treatment is sufficiently decreased. Studies have shown that the role of autophagy may differ between cancer stem cells (CSCs) and the bulk cancer cell population (Gong et al., 2013; Ojha et al., 2015). Pro‐survival autophagy is critical for the maintenance and expansion of CSCs, which are responsible for relapse after cancer treatments (Yu et al., 2012; Gong et al., 2013; Li et al., 2015b). Endometriosis, although a benign disease, shares many aspects with cancer. A growing body of evidence suggests that endometriosis originates from endometrial stem or progenitor cells (Gargett et al., 2016). Autophagy may be required for maintenance of endometriotic stem cells that can survive drug treatment. We speculate that DES cells that could survive combination treatment with MK2206 + chloroquine include endometriotic stem cells and that autophagy is critical for maintenance of these cells. Further studies are required to confirm the characteristics of those DES cells that can survive and regrow after MK 2206 + chloroquine treatment.
The present results suggest that a novel treatment strategy for patients with endometriosis could involve decreasing the number of cells that can survive treatment and then preventing regrowth by autophagy inhibition. However, autophagy is critical for many physiological and pathological processes (Mizushima, 2007; Mizushima et al., 2008). The present study showed that autophagy inhibition enhanced regrowth of EES cells after discontinuation of drug treatment. Inhibition of autophagy may increase the risk of healthy endometrial tissues undergoing malignant transformation. In addition, autophagy is also critical for optimal immune function (Levine and Kroemer, 2008). As recently proposed by Galluzzi et al. (2017), patients with endometriosis may benefit from a sequential approach in which autophagy is selectively inhibited in endometriotic cells, diseased cells, and then selectively activated in endometrial cells, non‐diseased cells, after discontinuation of drug treatment. However, to date, only a few studies have investigated the role of autophagy in endometriosis, as well as in the endometrium, and the results remain controversial (Choi et al., 2014; Allavena et al., 2015; Mei et al., 2015; Ruiz et al., 2016; Liu et al., 2017). Further studies are required to determine whether long‐term inhibition of autophagy prevents recurrence of endometriosis after discontinuation of drug treatment and whether it results in any adverse effects on the endometrium of patients with endometriosis.
Author contributions
S.M. was involved in the concept and design, sample collection, experiments, acquisition of the data, analysis, interpretation of the data, drafting the article and critical revision of the article. J.‐L.P. was involved in the concept and design, sample collection, interpretation of the data and critical revision of the article. M.C. was involved in concept and design, sample collection, interpretation of the data and critical revision of the article. All authors read and approved the final version of the paper.
Conflict of interest
The authors declare no conflicts of interest.
Declaration of transparency and scientific rigour
This http://onlinelibrary.wiley.com/doi/10.1111/bph.13405/abstract acknowledges that this paper adheres to the principles for transparent reporting and scientific rigour of preclinical research recommended by funding agencies, publishers and other organisations engaged with supporting research.
Supporting information
Figure S1 A, B: Beclin‐1 protein expression in DES (n = 6) after transfection with either Beclin‐1 siRNAs or siRNA negative controls. C, D: ATG12‐ATG5 protein expression in DES (n = 6) after transfection with either ATG12 siRNAs or siRNA negative control. E, F: ATG13 protein expression in DES (n = 5) after transfection with either ATG13 siRNAs or siRNA negative control.
Figure S2 A, B: Experimental design for the mouse experiment.
Figure S3 Effects of treatment with either CQ (50 μM) alone, MK2206 (9 μM) alone, or the combination of MK2206 (9 μM) + CQ (50 μM) on Annexin V‐positive cells of DES and EES within the same patients (n = 6).
Figure S4 Effects of treatment with either vehicle alone (n = 10), CQ alone (n = 10), MK2206 alone (n = 10), or MK2206 + CQ (n = 10) on endometriotic implants in a mouse model of endometriosis.
Figure S5 Effects of ATG13, Beclin‐1, and ATG12 knockdown on light chain 3 (LC3)‐II and p62 protein expression in DES and EES within same patients (n = 6) after treatment with vehicle alone, CQ alone, BafA1 alone, or MK2206 alone.
Figure S6 Effects of Beclin‐1 knockdown on cell proliferation after treatment with CQ alone, MK2206 alone, or MK2206 + CQ in DES and EES within the same patients (n = 12).
Figure S7 Beclin‐1, ATG12‐ATG5 or ATG13 protein expression in DES (A, C, E) and EES (B, D, F) within the same patients (n = 6) after transfection with either Beclin‐1 siRNA, ATG12 siRNA, ATG13 siRNA or siRNA negative control.
Figure S8 Effects of Beclin‐1, ATG12 or ATG13 knockdown on cell growth in DES and in EES within the same patients (n = 6) after treatment with vehicle alone.
Figure S9 Effects of Beclin, ATG12, or ATG13 knockdown on cell growth after treatment with CQ alone, MK2206 alone or MK2206 + CQ in endometrial stromal cells of patients without endometriosis (NEES) (n = 5).
Figure S10 Effects of Beclin‐1, ATG12, or ATG13 knockdown on cell regrowth after drug discontinuation with either vehicle alone, CQ alone, MK2206 alone or MK2206 + CQ in NEES (n = 5).
Figure S11 Effects of CQ alone, MK2206 alone, or MK2206 +CQ on Beclin‐1 (A‐D) and ATG12‐ATG5 (E‐H) protein expression in DES (A, B, E, F) and EES (C, D, G, H) within the same patients (n = 6) A, C, E, G: Relative expression level of Beclin‐1 (A, C) and ATG12‐ATG5 (E, G) protein.
Table S1 Clinical characteristics of patients.
Table S2 The numbers of samples of DES, EES, and/or NEES used for each experiment.
Table S3 IC50 for CQ alone, BafA1 alone, MK2206 alone, MK2206 + CQ, or MK2206 + BafA1 in DES versus EES within the same patients (n = 12).
Table S4 IC50 for CQ alone, MK2206 alone or MK2206 + CQ in EEE versus EES within the same patients (n = 6).
Acknowledgements
We are most grateful to all the patients who participated in the present study. We acknowledge the use of the confocal imaging platform (ICCF, https://www.gred‐clermont.fr/directory/platform/) at the GReD Laboratory, Faculty of Medicine, University of Auvergne. We thank Ms Chrsitelle Picard (Department of Pathology, CHU Estaing, CHU Clermont‐Ferrand) for her excellent technical assistance. This study was supported in part by the Karl Storz Endoscopy & GmbH (Tuttlingen, Germany).
Matsuzaki, S. , Pouly, J.‐L. , and Canis, M. (2018) In vitro and in vivo effects of MK2206 and chloroquine combination therapy on endometriosis: autophagy may be required for regrowth of endometriosis. British Journal of Pharmacology, 175: 1637–1653. doi: 10.1111/bph.14170.
References
- Alexander SPH, Fabbro D, Kelly E, Marrion N, Peters JA, Benson HE et al (2017). The Concise Guide to PHARMACOLOGY 2017/18: enzymes. Br J Pharmacol 174: S272–S359. [DOI] [PMC free article] [PubMed] [Google Scholar]
- Allavena G, Carrarelli P, Del Bello B, Luisi S, Petraglia F, Maellaro E (2015). Autophagy is upregulated in ovarian endometriosis: a possible interplay with p53 and heme oxygenase‐1. Fertil Steril 103: 1244–1251. [DOI] [PubMed] [Google Scholar]
- Barth S, Glick D, Macleod KF (2010). Autophagy: assays and artifacts. J Pathol 221: 117–124. [DOI] [PMC free article] [PubMed] [Google Scholar]
- Bokobza SM, Jiang Y, Weber AM, Devery AM, Ryan AJ (2014). Combining AKT inhibition with chloroquine and gefitinib prevents compensatory autophagy and induces cell death in EGFR mutated NSCLC cells. Oncotarget 5: 4765–4778. [DOI] [PMC free article] [PubMed] [Google Scholar]
- Cheng Y, Zhang Y, Zhang L, Ren X, Huber‐Keener KJ, Liu X et al (2012). MK‐2206, a novel allosteric inhibitor of Akt, synergizes with gefitinib against malignant glioma via modulating both autophagy and apoptosis. Mol Cancer Ther 11: 154–164. [DOI] [PMC free article] [PubMed] [Google Scholar]
- Choi J, Jo M, Lee E, Kim HJ, Choi D (2014). Differential induction of autophagy by mTOR is associated with abnormal apoptosis in ovarian endometriotic cysts. Mol Hum Reprod 20: 309–317. [DOI] [PubMed] [Google Scholar]
- Chou TC (2006). Theoretical basis, experimental design, and computerized simulation of synergism and antagonism in drug combination studies. Pharmacol Rev 58: 621–681. [DOI] [PubMed] [Google Scholar]
- Chou TC (2010). Drug combination studies and their synergy quantification using the Chou–Talalay method. Cancer Res 70: 440–446. [DOI] [PubMed] [Google Scholar]
- Codogno P, Meijer AJ (2005). Autophagy and signaling: their role in cell survival and cell death. Cell Death Differ 12 (Suppl 2): 1509–1518. [DOI] [PubMed] [Google Scholar]
- Curtis MJ, Bond RA, Spina D, Ahluwalia A, Alexander SP, Giembycz MA et al (2015). Experimental design and analysis and their reporting: new guidance for publication in BJP. Br J Pharmacol 172: 3461–3471. [DOI] [PMC free article] [PubMed] [Google Scholar]
- Dagda RK, Zhu J, Kulich SM, Chu CT (2008). Mitochondrially localized ERK2 regulates mitophagy and autophagic cell stress: implications for Parkinson's disease. Autophaby 4: 770–782. [DOI] [PMC free article] [PubMed] [Google Scholar]
- Das G, Shravage BV, Baehrecke EH (2012). Regulation and function of autophagy during cell survival and cell death. Cold Spring Harb Perspect Biol 4: a008813. [DOI] [PMC free article] [PubMed] [Google Scholar]
- Degtyarev M, De Mazière A, Orr C, Lin J, Lee BB, Tien JY et al (2008). Akt inhibition promotes autophagy and sensitizes PTEN‐null tumors to lysosomotropic agents. J Cell Biol 183: 101–116. [DOI] [PMC free article] [PubMed] [Google Scholar]
- Florey O, Gammoh N, Kim SE, Jiang X, Overholtzer M (2015). V‐ATPase and osmotic imbalances activate endolysosomal LC3 lipidation. Autophagy 11: 88–99. [DOI] [PMC free article] [PubMed] [Google Scholar]
- Galluzzi L, Bravo‐San Pedro JM, Levine B, Green DR, Kroemer G (2017). Pharmacological modulation of autophagy: therapeutic potential and persisting obstacles. Nat Rev Drug Discov 16: 487–511. [DOI] [PMC free article] [PubMed] [Google Scholar]
- Gargett CE, Schwab KE, Deane JA (2016). Endometrial stem/progenitor cells: the first 10 years. Hum Reprod Update 22: 137–163. [DOI] [PMC free article] [PubMed] [Google Scholar]
- Giudice LC, Kao LC (2004). Endometriosis. Lancet 364: 1789–1799. [DOI] [PubMed] [Google Scholar]
- Gong C, Bauvy C, Tonelli G, Yue W, Deloménie C, Nicolas V et al (2013). Beclin 1 and autophagy are required for the tumorigenicity of breast cancer stem‐like/progenitor cells. Oncogene 32: 2261–2272. [DOI] [PMC free article] [PubMed] [Google Scholar]
- Grümmer R (2006). Animal models in endometriosis research. Hum Reprod Update 12: 641–619. [DOI] [PubMed] [Google Scholar]
- Guo SW (2009). Recurrence of endometriosis and its control. Hum Reprod Update 15: 441–461. [DOI] [PubMed] [Google Scholar]
- He C, Klionsky DJ (2009). Regulation mechanisms and signaling pathways of autophagy. Annu Rev Genet 43: 67–93. [DOI] [PMC free article] [PubMed] [Google Scholar]
- Holle AW, Young JL, Spatz JP (2016). In vitro cancer cell‐ECM interactions inform in vivo cancer treatment. Adv Drug Deliv Rev 97: 270–279. [DOI] [PubMed] [Google Scholar]
- Jacquin E, Leclerc‐Mercier S, Judon C, Blanchard E, Fraitag S, Florey O (2017). Pharmacological modulators of autophagy activate a parallel noncanonical pathway driving unconventional LC3 lipidation. Autophagy 13: 854–867. [DOI] [PMC free article] [PubMed] [Google Scholar]
- Janku F, McConkey DJ, Hong DS, Kurzrock R (2011). Autophagy as a target for anticancer therapy. Nat Rev Clin Oncol 8: 528–539. [DOI] [PubMed] [Google Scholar]
- Kaminskyy VO, Piskunova T, Zborovskaya IB, Tchevkina EM, Zhivotovsky B (2012). Suppression of basal autophagy reduces lung cancer cell proliferation and enhancescaspase‐dependent and ‐independent apoptosis by stimulating ROS formation. Autophagy 8: 1032–1044. [DOI] [PMC free article] [PubMed] [Google Scholar]
- Kimmelman AC (2011). The dynamic nature of autophagy in cancer. Genes Dev 25: 1999–2010. [DOI] [PMC free article] [PubMed] [Google Scholar]
- Kilkenny C, Browne WJ, Cuthill IC, Emerson M, Altman DG (2010). Improving bioscience research reporting: the ARRIVE guidelines for reporting animal research. J Pharmacol Pharmacothe 1: 94–99. [DOI] [PMC free article] [PubMed] [Google Scholar]
- Klionsky DJ, Abdalla FC, Abeliovich H, Abraham RT, Acevedo‐Arozena A, Adeli K et al (2012). Guidelines for the use and interpretation of assays for monitoring autophagy. Autophagy 8: 445–544. [DOI] [PMC free article] [PubMed] [Google Scholar]
- Levine B, Kroemer G (2008). Autophagy in the pathogenesis of disease. Cell 132: 27–42. [DOI] [PMC free article] [PubMed] [Google Scholar]
- Levy JM, Thorburn A (2011). Targeting autophagy during cancer therapy to improve clinical outcomes. Pharmacol Ther 131: 130–141. [DOI] [PMC free article] [PubMed] [Google Scholar]
- Li C, Liu Y, Liu H, Zhang W, Shen C, Cho K et al (2015a). Impact of autophagy inhibition at different stages on cytotoxic effect of autophagy inducer in glioblastoma cells. Cell Physiol Biochem 35: 1303–1316. [DOI] [PubMed] [Google Scholar]
- Li Y, Rogoff HA, Keates S, Gao Y, Murikipudi S, Mikule K et al (2015b). Suppression of cancer relapse and metastasis by inhibiting cancer stemness. Proc Natl Acad Sci U S A 112: 1839–1844. [DOI] [PMC free article] [PubMed] [Google Scholar]
- Liu H, Zhang Z, Xiong W, Zhang L, Xiong Y, Li N et al (2017). Hypoxia‐inducible factor‐1α promotes endometrial stromal cells migration and invasion by upregulating autophagy in endometriosis. Reproduction 153: 809–820. [DOI] [PMC free article] [PubMed] [Google Scholar]
- Matsuzaki S, Darcha C (2013a). In vitro effects of a small‐molecule antagonist of the Tcf/ß‐catenin complex on endometrial and endometriotic cells of patients with endometriosis. PLoS One 8: e61690. [DOI] [PMC free article] [PubMed] [Google Scholar]
- Matsuzaki S, Darcha C (2013b). Involvement of the Wnt/β‐catenin signaling pathway in the cellular and molecular mechanisms of fibrosis in endometriosis. PLoS One 8: e76808. [DOI] [PMC free article] [PubMed] [Google Scholar]
- Matsuzaki S, Darcha C (2014). Antifibrotic properties of epigallocatechin‐3‐gallate in endometriosis. Hum Reprod 29: 1677–1687. [DOI] [PubMed] [Google Scholar]
- Matsuzaki S, Darcha C (2015). Co‐operation between the AKT and ERK signaling pathways may support growth of deep endometriosis in a fibrotic microenvironment in vitro . Hum Reprod 30: 1606–1616. [DOI] [PubMed] [Google Scholar]
- Matsuzaki S, Canis M, Pouly JL, Darcha C (2016). Soft matrices inhibit cell proliferation and inactivate the fibrotic phenotype of deep endometriotic stromal cells in vitro . Hum Reprod 31: 541–553. [DOI] [PubMed] [Google Scholar]
- Matsuzaki S, Pouly JL, Canis M (2017). Effects of U0126 and MK2206 on cell growth and re‐growth of endometriotic stromal cells grown on substrates of varying stiffness. Sci Rep 7: 42939. [DOI] [PMC free article] [PubMed] [Google Scholar]
- Mauvezin C, Neufeld TP (2015). Bafilomycin A1 disrupts autophagic flux by inhibiting both V‐ATPase‐dependent acidification and Ca‐P60A/SERCA‐dependent autophagosome–lysosome fusion. Autophagy 11: 1437–1438. [DOI] [PMC free article] [PubMed] [Google Scholar]
- McGrath JC, Lilley E (2015). Implementing guidelines on reporting research using animals (ARRIVE etc.): new requirements for publication in BJP. Br J Pharmacol 172: 3189–3193. [DOI] [PMC free article] [PubMed] [Google Scholar]
- Mei J, Zhu XY, Jin LP, Duan ZL, Li DJ, Li MQ (2015). Estrogen promotes the survival of human secretory phase endometrial stromal cells via CXCL12/CXCR4 up‐regulation‐mediated autophagy inhibition. Hum Reprod 30: 1677–1689. [DOI] [PubMed] [Google Scholar]
- Mizushima N (2007). Autophagy: process and function. Genes Dev 21: 2861–2873. [DOI] [PubMed] [Google Scholar]
- Mizushima N, Levine B, Cuervo AM, Klionsky DJ (2008). Autophagy fights disease through cellular self‐digestion. Nature 451: 1069–1075. [DOI] [PMC free article] [PubMed] [Google Scholar]
- Mizushima N, Yoshimori T, Levine B (2010). Methods in mammalian autophagy research. Cell 140: 313–326. [DOI] [PMC free article] [PubMed] [Google Scholar]
- Ojha R, Bhattacharyya S, Singh SK (2015). Autophagy in cancer stem cells: a potential link between chemoresistance, recurrence, and metastasis. Biores Open Access 4: 97–108. [DOI] [PMC free article] [PubMed] [Google Scholar]
- Quail DF, Joyce JA (2013). Microenvironmental regulation of tumor progression and metastasis. Nat Med 19: 1423–1437. [DOI] [PMC free article] [PubMed] [Google Scholar]
- Rebecca VW, Massaro RR, Fedorenko IV, Sondak VK, Anderson AR, Kim E et al (2014). Inhibition of autophagy enhances the effects of the AKT inhibitor MK‐2206 when combined with paclitaxel and carboplatin in BRAF wild‐type melanoma. Pigment Cell Melanoma Res 27: 465–478. [DOI] [PMC free article] [PubMed] [Google Scholar]
- Ruiz A, Rockfield S, Taran N, Haller E, Engelman RW, Flores I et al (2016). Effect of hydroxychloroquine and characterization of autophagy in a mouse model of endometriosis. Cell Death Dis 7: e2059. [DOI] [PMC free article] [PubMed] [Google Scholar]
- Soares SR, Martínez‐Varea A, Hidalgo‐Mora JJ, Pellicer A (2012). Pharmacologic therapies in endometriosis: a systematic review. Fertil Steril 98: 529–555. [DOI] [PubMed] [Google Scholar]
- Southan C, Sharman JL, Benson HE, Faccenda E, Pawson AJ, Alexander SP et al (2016). The IUPHAR/BPS Guide to PHARMACOLOGY in 2016: towards curated quantitative interactions between 1300 protein targets and 6000 ligands. Nucleic Acids Res 44: D1054–D1068. [DOI] [PMC free article] [PubMed] [Google Scholar]
- Syed S, Karadaghy A, Zustiak S (2015). Simple polyacrylamide‐based multiwell stiffness assay for the study of stiffness‐dependent cell responses. J Vis Exp 97: e52643. [DOI] [PMC free article] [PubMed] [Google Scholar]
- Sui X, Chen R, Wang Z, Huang Z, Kong N, Zhang M et al (2013). Autophagy and chemotherapy resistance: a promising therapeutic target for cancer treatment. Cell Death Dis 4: e838. [DOI] [PMC free article] [PubMed] [Google Scholar]
- Tirado‐González I, Barrientos G, Tariverdian N, Arck PC, García MG, Klapp BF et al (2010). Endometriosis research: animal models for the study of a complex disease. J Reprod Immunol 86: 141–147. [DOI] [PubMed] [Google Scholar]
- Yu Y, Ramena G, Elble RC (2012). The role of cancer stem cells in relapse of solid tumors. Front Biosci (Elite Ed) 4: 1528–1541. [DOI] [PubMed] [Google Scholar]
- Vanhie A, Tomassetti C, Peeraer K, Meuleman C, D'Hooghe T (2016). Challenges in the development of novel therapeutic strategies for treatment of endometriosis. Expert Opin Ther Targets 20: 593–600. [DOI] [PubMed] [Google Scholar]
- White E (2015). The role for autophagy in cancer. J Clin Invest 125: 42–46. [DOI] [PMC free article] [PubMed] [Google Scholar]
- Yang Z, Klionsky DJ (2009). An overview of the molecular mechanism of autophagy. Curr Top Microbiol Immunol 335: 1–32. [DOI] [PMC free article] [PubMed] [Google Scholar]
- Yang ZJ, Chee CE, Huang S, Sinicrope FA (2011a). The role of autophagy in cancer: therapeutic implications. Mol Cancer Ther 10: 1533–1541. [DOI] [PMC free article] [PubMed] [Google Scholar]
- Yang S, Wang X, Contino G, Liesa M, Sahin E, Ying H et al (2011b). Pancreatic cancers require autophagy for tumor growth. Genes Dev 25: 717–729. [DOI] [PMC free article] [PubMed] [Google Scholar]
- Yang YP, Hu LF, Zheng HF, Mao CJ, Hu WD, Xiong KP et al (2013). Application and interpretation of current autophagy inhibitors and activators. Acta Pharmacol Sin 34: 625–635. [DOI] [PMC free article] [PubMed] [Google Scholar]
- Zustiak S, Nossal R, Sackett DL (2014). Multiwell stiffness assay for the study of cell responsiveness to cytotoxic drugs. Biotechnol Bioeng 111: 396–403. [DOI] [PMC free article] [PubMed] [Google Scholar]
Associated Data
This section collects any data citations, data availability statements, or supplementary materials included in this article.
Supplementary Materials
Figure S1 A, B: Beclin‐1 protein expression in DES (n = 6) after transfection with either Beclin‐1 siRNAs or siRNA negative controls. C, D: ATG12‐ATG5 protein expression in DES (n = 6) after transfection with either ATG12 siRNAs or siRNA negative control. E, F: ATG13 protein expression in DES (n = 5) after transfection with either ATG13 siRNAs or siRNA negative control.
Figure S2 A, B: Experimental design for the mouse experiment.
Figure S3 Effects of treatment with either CQ (50 μM) alone, MK2206 (9 μM) alone, or the combination of MK2206 (9 μM) + CQ (50 μM) on Annexin V‐positive cells of DES and EES within the same patients (n = 6).
Figure S4 Effects of treatment with either vehicle alone (n = 10), CQ alone (n = 10), MK2206 alone (n = 10), or MK2206 + CQ (n = 10) on endometriotic implants in a mouse model of endometriosis.
Figure S5 Effects of ATG13, Beclin‐1, and ATG12 knockdown on light chain 3 (LC3)‐II and p62 protein expression in DES and EES within same patients (n = 6) after treatment with vehicle alone, CQ alone, BafA1 alone, or MK2206 alone.
Figure S6 Effects of Beclin‐1 knockdown on cell proliferation after treatment with CQ alone, MK2206 alone, or MK2206 + CQ in DES and EES within the same patients (n = 12).
Figure S7 Beclin‐1, ATG12‐ATG5 or ATG13 protein expression in DES (A, C, E) and EES (B, D, F) within the same patients (n = 6) after transfection with either Beclin‐1 siRNA, ATG12 siRNA, ATG13 siRNA or siRNA negative control.
Figure S8 Effects of Beclin‐1, ATG12 or ATG13 knockdown on cell growth in DES and in EES within the same patients (n = 6) after treatment with vehicle alone.
Figure S9 Effects of Beclin, ATG12, or ATG13 knockdown on cell growth after treatment with CQ alone, MK2206 alone or MK2206 + CQ in endometrial stromal cells of patients without endometriosis (NEES) (n = 5).
Figure S10 Effects of Beclin‐1, ATG12, or ATG13 knockdown on cell regrowth after drug discontinuation with either vehicle alone, CQ alone, MK2206 alone or MK2206 + CQ in NEES (n = 5).
Figure S11 Effects of CQ alone, MK2206 alone, or MK2206 +CQ on Beclin‐1 (A‐D) and ATG12‐ATG5 (E‐H) protein expression in DES (A, B, E, F) and EES (C, D, G, H) within the same patients (n = 6) A, C, E, G: Relative expression level of Beclin‐1 (A, C) and ATG12‐ATG5 (E, G) protein.
Table S1 Clinical characteristics of patients.
Table S2 The numbers of samples of DES, EES, and/or NEES used for each experiment.
Table S3 IC50 for CQ alone, BafA1 alone, MK2206 alone, MK2206 + CQ, or MK2206 + BafA1 in DES versus EES within the same patients (n = 12).
Table S4 IC50 for CQ alone, MK2206 alone or MK2206 + CQ in EEE versus EES within the same patients (n = 6).