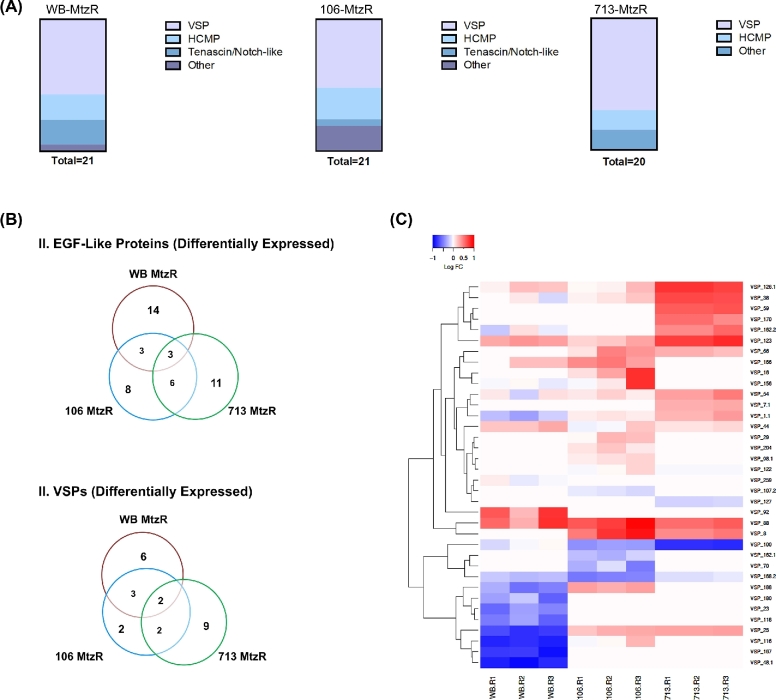
Figure 2:
EGF-like differentially expressed proteins and VSP subpopulations. (A) Distribution of differentially expressed EGF-like proteins within Giardia protein families by MtzR line. (B) Proportional Venn diagrams showing overlapping identities of all differentially expressed EGF-like proteins in MtzR lines (above) and all differentially expressed VSP proteins (below). (C) Heat map showing fold change in expression of VSPs in MtzR lines compared to the MtzS parents; replicate details are shown on the bottom axis to represent biological variation within lines. Lower fold changes are represented by blue, while higher fold changes are represented in red.

