

Abstract
In the presence of excess nickel, Escherichia coli NikR regulates cellular nickel uptake by suppressing the transcription of the nik operon, which encodes for the nickel uptake transporter, NikABCDE. Previously published in vitro studies have shown that NikR is capable of binding a range of divalent transition metal ions in addition to Ni2+, including Co2+, Cu2+, Zn2+, and Cd2+. To understand how the high-affinity nickel binding site of NikR is able to accommodate these other metal ions, and to better understand NikR’s mechanism of binding to DNA, we have determined structures of the metal-binding domain (MBD) of NikR in the apo form and in complex with Cu2+ and Zn2+ ions and compare them with the previously published structures with Ni2+. We observe that Cu2+ ions bind in a very similar manner to Ni2+, with a square planar geometry but with longer bond lengths. Crystals grown in the presence of Zn2+ reveal a protein structure similar to that of apo MBD with a disordered α3 helix, but with two electron density peaks near the Ni2+ binding site corresponding to two Zn2+ ions. These structural findings along with biochemical data on NikR support a hypothesis that ordering of the α3 helix is important for repressor activation.
PDB IDs: Zn-MBD: 3BKF, Cu-MBD: 3BKT, apo-MBD: 3BKU
TOC image
A number of microorganisms use nickel as an essential cofactor, including the extensively studied Escherichia coli and Helicobacter pylori. In E. coli, nickel is necessary under anaerobic conditions for proper functioning of hydrogenase (1). H. pylori, which colonize the acidic environment of the stomach, require the nickel-containing enzymes urease and hydrogenase to maintain a neutral pH within the cell and as an energy source, respectively (2, 3). An excess of nickel ions in either organism can lead to cell death (3, 4). Both organisms use the transcription factor NikR to inhibit the transcription of the nickel-uptake machine in the presence of surplus nickel (5, 6). In E. coli, this metal uptake machinery is an ABC-transporter (NikABCDE) (7), while in H. pylori, the monomeric metal-uptake protein, NixA is the key player (6). Although the apo form of NikR has no detectable affinity for DNA (8, 9), stoichiometric amounts of nickel induce a binding affinity of 5 × 10⁻⁹ M to the nik operon in E. coli (10) and 5 × 10⁻⁸ M to the nixA operon in H. pylori (11). In addition to controlling the transcription of NixA (6), NikR regulates a number of genes in H. pylori, including the urease accessory protein UreA (12) and outer membrane proteins FepA3 (13), FrpB4 (2, 13), and ExbB (14).
Despite the variety of metals in the cell, most metalloproteins bind a given metal with great specificity (15). The origin of this specificity remains an active area of research in the bioinorganic field. For NikR, in vitro spectroscopic studies and metal binding experiments seem to contradict this basic principle, as they indicate that NikR binds a number of transition metals including Ni2+, Co2+, Zn2+, Cd2+, and Cu2+ with significant affinity (16). While nickel is best able to stabilize NikR (16-18), a number of different transition metal ions induce substantial DNA binding affinity to NikR (10). To investigate how different metals bind NikR and to explore the issue of specificity we have determined the structures of the E. coli NikR metal-binding domain (MBD) with Zn2+ and Cu2+ bound and with no metals bound.
Structures of NikR from E. coli (19, 20), H. pylori (21), and Pyrococcus horikoshii (22) have provided insight into the tertiary structure of the protein and the changes that occur upon nickel and DNA binding. NikR is a homotetrameric protein arranged with a central tetrameric MBD and two flanking dimeric DNA-binding ribbon-helix-helix (RHH) domains (Figure 1). A comparison between E. coli apo-NikR (PDB 1Q5V) and Ni2+-bound MBD and NikR structures (PDBs 1Q5Y and 2HZA) indicates that the α3 helices of the MBD are flexible in the absence of nickel and become structured when nickel binds to the protein (19, 20). An array of structures of Ni2+-NikR from each of the organisms listed above (20-22) compared to the one structure of NikR bound to DNA (20) illustrate that the RHH domains are not pre-arranged into the correct DNA-binding configuration upon nickel binding (Figure 1). Only in the presence of DNA are both RHH domains oriented “down” in a productive DNA binding configuration. In this “down” DNA-binding configuration in E. coli, a second metal-binding site, occupied by K+ in the crystal structure, is formed at the interface of the RHH and MBD (20). Binding of a cation such as K+ to this site may serve to help lock NikR onto its DNA operator (20).
Figure 1.

Structures of E. coli NikR. Each monomer composing the tetramer is a different color. (a) Alignment of apo-MBD (in color, this work) and apo full-length NikR (in grey, PDB 1Q5V). (b) Alignment of Ni2+-bound structures of MBD (in color, PDB 1Q5Y) and full-length NikR (in grey, PDB 2HZA). (c) DNA- and Ni2+-bound full-length NikR (PDB 2HZV). K+, which was observed bound in NikR-DNA structure, are represented by black spheres. Asterisks indicate loops and α3 helices that make connections to the DNA.
We have previously proposed that the MBD α3 helices play an important role in the metal-dependent response of NikR for DNA (19, 20). Here we test this hypothesis by examining whether metals yielding high NikR-DNA affinity indeed stabilize the α3 helix. The structures we describe here, in combination with previously published biochemical studies, lead to a mechanism for NikR-DNA binding.
Experimental Procedures
Structure determination of apo-MBD NikR
MBD NikR was over-expressed and purified with nickel bound as described previously (19). Nickel was removed from the sample by incubation with 10 mM EDTA (representing a 10-fold molar excess over MBD) at 4°C for 48 hours. The sample changed color from light yellow to colorless. To remove Ni-EDTA and excess EDTA, the sample was passed twice through Micro Bio-Spin P-6 columns (Bio-Rad).
Apo-MBD was crystallized using the hanging drop technique in a drop containing 1.5 μl of 10 mg/ml apo-MBD in buffer (20 mM Tris pH 8.0, 300 mM NaCl) and 1.5 μl of precipitant solution (0.2 M sodium tartrate, 20% w/v PEG 3350) at room temperature. Colorless, plate-shaped crystals were cryoprotected in precipitant solution containing 30% ethylene glycol.
Data were collected on beamline X12-B at the National Synchrotron Light Source, Brookhaven National Laboratory at 100 K with an oscillation step size of 0.5° per frame, data collection statistics in Table 1. Reliable reflections were collected to 2.1 Å and reduced using DENZO/SCALEPACK (23).
Table 1.
Data collection and refinement statistics.a
| Crystal | Apo-MBD | Cu2+-MBD | Zn2+-MBD | |
|---|---|---|---|---|
| Inflection | Remote | |||
| Space Group | C2 | P212121 | P6222 | P6222 |
| Cell Dimensions | ||||
| a (Å) | 67.35 | 45.95 | 46.22 | 46.27 |
| b (Å) | 59.67 | 78.44 | – | – |
| c (Å) | 75.14 | 81.46 | 124.90 | 125.05 |
| β(°) | 94.01 | – | – | – |
| Wavelength (Å) | 1.100 | 0.9791 | 1.2829 | 1.0 |
| Resolution Range (Å) | 50-2.1 (2.18-2.10) | 50-1.5 (1.55-1.5) | 40-1.9 (2.0-1.9) | 28.9-1.9 (1.9-2.0) |
| Unique Reflections | 17408 (1685) | 46684 (4006) | 6755 (957) | 6765 (965) |
| Average Redundancy | 7.3 (2.6) | 8.1 (6.1) | 9.8 (6.0) | 11.0 (11.4) |
| Completeness (%) | 99.5 (96.7) | 97.9 (85.2) | 99.5 (99.6) | 99.6 (100) |
| I/σ(I) | 17.8 (1.7) | 16.9 (5.3) | 28.1 (3.4) | 30.6 (5.7) |
| Rsym (%)b | 6.9 (45.1) | 5.7 (25.4) | 5.2 (34.5) | 5.1 (35.6) |
| Rcryst (Rfree) (%)c | 28.8 (33.5) | 19.5 (22.7) | 24.9 (27.3) | |
| Number of protein atoms | 2262 | 2618 | 509 | |
| Number of metal ions | 0 | 4 | 2 | |
| Number of water molecules | 15 | 171 | 22 | |
| R.m.s. deviations | ||||
| Bond lengths (Å) | 0.008 | 0.011 | 0.005 | |
| Bond angles (°) | 1.53 | 1.35 | 1.1 | |
| Ramachandran (%) | ||||
| Most favored | 81.3 | 92.2 | 92.9 | |
| Additionally Allowed | 18.7 | 7.8 | 5.4 | |
| Generously Allowed | 0.0 | 0.0 | 1.8 | |
| Disallowed | 0.0 | 0.0 | 0.0 | |
The number in parentheses is for the highest resolution shell.
Rsym = Σihkl|Ii(hkl) − <I(hkl)>|/Σhkl <I(hkl)>, where Ii(hkl) is the ith measured diffraction intensity and <I(hkl)> is the mean of the intensity for the miller index (hkl).
Rwork = Σhkl ║Fo(hkl)| − |Fc(hkl)║/Σhkl |Fo(hkl)|. Rfree = Rcryst for a test set of reflections (5%) not included in refinement.
The structure of apo-MBD was solved by molecular replacement in the program EPMR (24) using the protein component of the Ni2+-MBD structure as a model (PDB ID: 1Q5Y) (19). The structure was refined in CNS (25) with model rebuilding and adjustments made in Xfit (26) or Coot (27) to a final Rwork = 28.8% and Rfree = 33.5%, with refinement statistics in Table 1. Residues 72-78 of chain A and 64-79 in chain D were not observed in electron density maps and are therefore not present in the final model.
Structure determination of Cu2+-MBD NikR
Apo-MBD NikR was obtained as described above. Cu2+ was added by slow addition with vortex mixing of a 50 mM CuCl2 stock solution until a stoichiometry of 1.2:1 CuCl2:MBD was reached. Upon addition of CuCl2, the sample became a dark yellow-orange color. Cu2+-MBD was crystallized in the same form and under the same conditions as Ni2+-MBD, the structure of which is published (PDB ID: 1Q5Y) (19). Briefly, 1.5 μL of 10 mg/mL Cu2+-MBD in 300 mM NaCl, 20 mM Tris, pH 8.0 was mixed with 1.5 μL of 0.2 M disodium tartrate dehydrate, 20% w/v PEG 3350 in a hanging-drop vapor diffusion experiment at room temperature. Deep yellow-orange crystals appeared within 2-4 days.
Crystals were cryoprotected by briefly soaking in a precipitant solution with 20% ethylene glycol. A dataset was collected on beamline 8-BM of the Advanced Photon Source, Argonne National Lab, at 100 K to 1.5 Å resolution (Table 1). Data were reduced using DENZO/SCALEPACK (23).
Crystals of Ni2+-MBD and Cu2+-MBD were isomorphous, so the protein component of the Ni2+- MBD structure (1Q5Y) was used directly as a starting model for refinement. Refinement was carried out in Refmac 5 from the CCP4 program suite (28). Rigid body refinement of the MBD tetramer and individual subunits was followed by rounds of positional and B-factor refinement and manual refitting of the model in Xfit (26). After refinement of anisotropic thermal displacement parameters and addition of hydrogens in their riding positions, Rwork = 19.5% and Rfree = 22.7% (Table 1). The final model contains residues 50-132 of NikR. One molecule of the tetramer is missing residues 64-66, which were not clearly observed in the electron density maps.
Structure determination of Zn2+-MBD NikR
Apo MBD was produced as described above and Zn2+ ions were added to the protein from a stock of 20 mM Zn-NTA complex to avoid MBD precipitation. The protein was allowed to equilibrate overnight at 4 degrees and then was desalted by passing through a Micro Bio-Spin P-6 column (Bio-Rad) to remove NTA. The final Zn:MBD ratio was 1:1 as confirmed spectrophotometrically with 4-(2-pyridylazo)resorcinol (PAR) (16). Crystals were obtained by mixing 1.5 μL Zn2+-MBD solution (5 mg/mL MBD in 300 mM NaCl, 20 mM Tris, pH 8.0) with 1.5 μL of precipitant (0.1 M Bis-Tris pH 5.5-6.5, 0.2 M (NH4)2SO4, and 25% w/v PEG 3350) in a hanging drop vapor diffusion experiment at room temperature. Colorless hexagonal crystals with dimensions 140×80×80 μm grew in 2-5 days. Three brief, consecutive soaks in solutions of increasing ethylene glycol concentration (5%–12%–20%) were performed to prevent the crystals from cracking during cryoprotection.
A dataset was collected on the Zn2+MBD crystals at the Stanford Synchrotron Radiation Laboratory (SSRL) in Palo Alto, CA, on beam line 9-2 at 100 K at both the zinc inflection wavelength (1.2829 Å) and a remote wavelength (1.00 Å). Crystals diffracted to 1.9 Å and data were integrated in MOSFLM (29) and scaled in Scala (30).
The protein crystallized as a tetramer as in all other NikR structures, but with one molecule of MBD per asymmetric unit (asu) instead of the typical four. The whole protein component of one MBD monomer from the Ni2+-MBD structure (1Q5Y) was used as a search model for molecular replacement using PHASER (31). A good solution was found in P6222 (Z-score of 24) and was refined in CNS (25) against the inflection wavelength (1.2829 Å) dataset by rigid body refinement followed by simulated annealing. The α3 helix of the MBD is mostly disordered, as in the apo-MBD and apo-NikR (1Q5V) (19) structures. This helix was removed from the model and alternating cycles of positional and B-factor refinement with manual refitting in Coot (27) were carried out. The final model refined to an Rwork of 24.9% and Rfree of 27.3%, and includes one subunit of the MBD NikR (residues 50-61 and 80-130), 22 water molecules, and two zinc ions (Table 1).
All structures were validated using composite omit maps generated in CNS (25) and examined in Xfit (26) or Coot (27).
Criteria for including α3 in model
NikR crystal structures sometimes show little or no electron density in the region of helix α3. In some cases, we have left some or all residues in the α3 helix out of the final coordinates due to a lack of confidence about the positioning of these atoms. Our criteria for deeming α3 too disordered to model are as follows: (1) B-factors are 25 Å2 or more higher for α3 residues than for the rest of the structure; (2) 50% or more of the Cα atoms are not in 2Fo-Fc density following a few rounds of refinement; (3) more negative Fo-Fc density is around this portion of the structure than is typical; (4) composite omit map density is missing for more than 50% of the helical atoms.
Circular dichroism of Ni2+, Cu2+, Zn2+, and Apo-MBD
The MBD of NikR was expressed and purified on a Ni2+-NTA column (Qiagen, Valencia, CA), followed by incubation with EDTA and anion exchange chromatography, as previously described (8, 16). An assay with Ellman’s reagent and β-mercaptoethanol as a standard was used to confirm that the MBD was fully reduced, and an HPLC assay was used to confirm that the protein was apo (32). Circular dichroism spectra were collected on a Jasco model J-710 spectropolarimeter in a cylindrical cell of 0.1 cm optical path length over a wavelength range from 260 to 195 nm at room temperature, as previously described (16). Each CD spectrum was the average of five accumulations at a scanning speed of 50 nm/min, a 1.0 nm spectral band width, a data pitch of 0.1 nm, and a 4 s response time. The experiments were performed by using protein stocks dialyzed against 10 mM HEPES, 100 mM KCl, pH 7.6, at concentrations ranging from 5 to 40 μM. For experiments performed in the presence of metal, the protein was first incubated overnight with stoichiometric amounts of metal sulfate at room temperature. The concentrations of the holo-protein stocks were verified by diluting the protein in 6 M GuHCl and EDTA and measuring the absorbance at 280 nm, using the calculated extinction coefficient of 2680 M−1cm−1 (33). Following data collection, the absorbance at 220 nm was analyzed to determine the percent helicity of each structure using Equation 1.
Equation 1: % alpha-helix = [(−θ222nm + 3000)/39000] × 100; where θ222nm is the mean residue ellipticity at 222nm (34-36).
RESULTS
Full Length versus MBD NikR Structures
The isolated MBD of NikR is a simple model system that can be used to study the structural consequences of transition metal ion binding to the protein. The MBD of NikR (residues 48-133) contains the residues involved in high-affinity metal binding, but lacks the N-terminal ribbon-helix-helix (RHH) DNA binding domains. This domain retains all key metal-binding features of the full-length NikR while crystallizing much more readily. The isolated MBD is tetrameric and has identical topology to the MBD portion of the full-length NikR protein (Figure 1). The RMSD for structural alignment of Ni2+-MBD (PDB 1Q5Y) (19) and full-length Ni2+-NikR (PDB 2HZA) (20) is 0.89 Å for 321 Cα atoms and 1.13 Å for all 2387 common atoms. Similarly, the apo-MBD aligns with the previously described apo-NikR (PDB 1Q5V) (19) with an RMSD of 0.67 Å for 261 Cα atoms and 0.96 Å for all 1910 common atoms. All structural alignments and RMSD calculations were done in LSQMAN (37).
Metal-Binding Sites
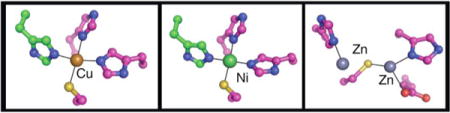
The previous crystal structure of Ni2+-MBD (PDB 1Q5Y) (19) shows that nickel binds in a square planar geometry at the interface between two subunits of the NikR tetramer, and is coordinated by H87, H89, and C95 of one monomer and H76 of a neighboring monomer (Figure 2a). The Cu2+-MBD structure described here illustrates that copper binds with the same square planar geometry and ligands as nickel (Figure 2b), with slightly longer metal-ligand distances than in the Ni2+-MBD structure (Table 2). The two distances that lengthen the most are from residues directly opposite each other (H89 and C95), creating a slightly asymmetric square planar site.
Figure 2.

Metal binding sites with 2Fo-Fc electron density (blue) contoured at 1σ around metal and ligands. One monomer is in magenta and the other in green. (a) Ni2+-MBD, (b) Cu2+-MBD, (c) Zn2+-MBD. The dispersive difference map (orange) was calculated by subtracting data collected at 1.2829 Å (zinc inflection wavelength) from 1.00 Å (a remote wavelength) and indicates the presence of zinc, contoured at −8.0 σ. (d) Zn2+-MBD with Fo-Fc difference density maps around the zinc binding sites with positive difference electron density in green contoured at +3σ and negative difference electron density in red contoured at −3σ.
Table 2.
Distances and angles around the metals in the metal-bound MBD structures. Distances and angles were averaged over the four monomers of the Ni2+ and Cu2+-bound structures. The numbers in parentheses refer to the last digits of the mean and represent the standard deviation of the measurement.
| Ni-MBD | Cu-MBD | Zn1 | Zn2 | |
|---|---|---|---|---|
| M-H76′ (Å) | 1.85(7) | 2.00(5) | ||
| M-H87 (Å) | 1.94(5) | 2.09(6) | 1.99 | |
| M-H89 (Å) | 2.01(4) | 2.40(2) | 2.21 | |
| M-C95 (Å) | 2.22(3) | 2.43(3) | 2.32 | |
| M-E97 (Å) | 2.34 | |||
| H76′-M-C95 (°) | 88(2) | 94(4) | ||
| H76′-M-H87 (°) | 175(2) | 164(7) | ||
| H76′-M-H89 (°) | 88(2) | 76(16) | ||
| C95-M-H87 (°) | 93(1) | 99(3) | 131 | |
| C95-M-H89 (°) | 175(2) | 170(3) | ||
| H87-M-H89 (°) | 91(1) | 84(5) | ||
| H87-M-E97 (°) | 90 | |||
| C95-M-E97 (°) | 120 |
The protein used for crystallization contained one Zn2+ ion per MBD monomer, yet two zinc binding sites were detected in each monomer through dispersive difference electron density maps (Figure 2c). After refinement of the protein structure, the occupancies of the zinc sites were refined in CNS (25) while restraining the B-factors of the zinc ions to values similar to the surrounding ligands. This refinement provided occupancies for the two zinc sites of 25% and 57%. It should be noted that the refinement of occupancies in this manner is not quantitative as we had to estimate the B-factors of the metals ions based on those of surrounding residues, and were not able to refine B-factors with occupancies simultaneously at this resolution. While the relative occupancy values are meaningful, the total occupancy is less so.
Zinc binding sites are located in the same region of the MBD as the copper and nickel sites, and use three of the same ligands (Figure 2c). Approximately 25% of the monomers in the crystal have Zn in zinc site Zn1, located near H89 (Supplemental Figure 2a). Closer to 57% of the monomers in the crystal have Zn coordinated by residues C95, E97, and H87 in zinc site Zn2 (Supplemental Figure 2b). Both Zn1 and Zn2 are poor zinc binding sites with only 1 or 3 ligands in our structure ordered for coordination, respectively. Zinc ions prefer a tetrahedral environment (38) and neither site has 4 ligands or angles befitting a tetrahedral geometry (Table 2). Water molecules (or another small ligand), which should be visible at 1.9 Å resolution, are not indicated by the presence of positive Fo-Fc density near either zinc ion. In addition, H76 from α3, which ligates both nickel and copper from a neighboring MBD monomer, is disordered and cannot be modeled in the zinc structure. Even the residues that can be modeled at these sites are not well ordered as indicated by the presence of both positive and negative Fo-Fc difference electron density around these residues (Figure 2d). Since the electron density observed is an average of all molecules in the crystal, it is likely that residues H87, H89, and C95 adopt different conformations in molecules that have Zn in site Zn1 than in molecules that have Zn in site Zn2, as indicated by the positive and negative difference electron density shown in Figure 2d. The dominant conformation of the residues is the one that provides better coordination of Zn2 as shown in Figure 2c and Supplemental Figure 2b. The minor conformation in the crystal, where zinc is bound at Zn1, is shown in Supplemental Figure 2a.
The nickel (19) and copper structures maintain two hydrogen bonding networks that each connect two of the four metal binding sites in the tetrameric MBD. This network stretches across the MBD interface and includes two residues from the α3 helix, but the network is not ordered in the apoNikR (19) or apoMBD structures. Thus, this network could be involved in stabilizing both helix α3 and the overall structure of NikR for DNA binding. In contrast to Ni2+- and Cu2+-MBD structures, this hydrogen bonding network is greatly disturbed in the Zn2+-MBD structure (Figure 3).
Figure 3.
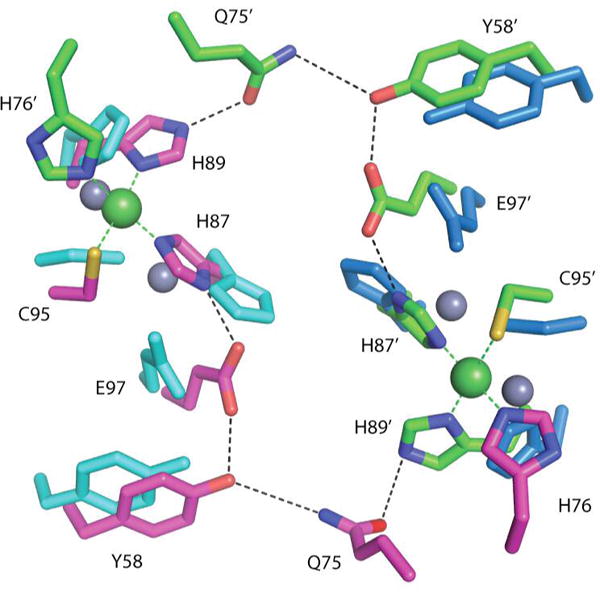
Hydrogen bonding network connecting two nickel binding sites. Zn2+-MBD colored in cyan and blue aligned to the Ni2+-MBD structure with carbon atoms in green and magenta, oxygen in red, sulfur in yellow, and nitrogen in blue.
Alpha α3 Helix
The α3 helix, residues 65-78, (Figure 1b,c) has been implicated in the mechanism of NikR binding to DNA, due to the fact that nickel binding orders this helix and that there are contacts made by residues of this helix and the preceeding loop to DNA (Figure 1c) (20). Therefore, it is important to consider each metal’s ability to order the α3 helix. The Ni2+-MBD and Cu2+-MBD structures have fully-ordered α3 helices (Figure 4a,b; Supplementary Figure S1), with B-factors of the amino acids very similar to those in the rest of the structure (Table 3). The alignment of Ni2+-MBD with Cu2+-MBD indicates no significant change in the overall structure, with an RMSD of only 0.47 Å for all 2469 atoms in the copper and nickel structures.
Figure 4.
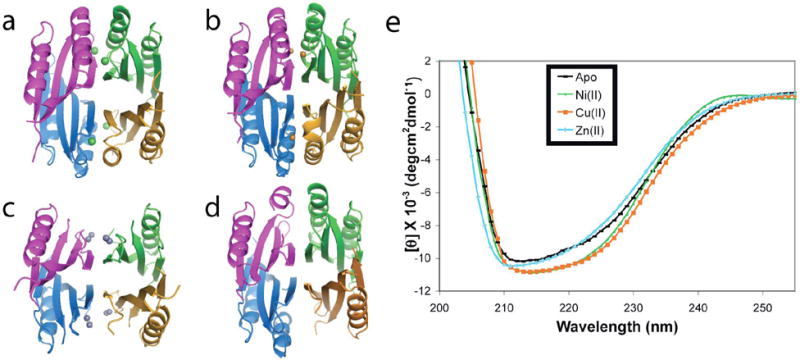
Ordering of the α3 helix. Ribbon diagrams of the (a) Ni2+-MBD, (b) Cu2+-MBD, (c) Zn2+-MBD, (d) apo-MBD; with each monomer represented in a separate color. (e) Circular dichroism spectra of apo-, Ni2+-, Cu2+-, and Zn2+-MBD.
Table 3.
Average B-factors (in Å2) for different portions of the apo, Zn2+−, Cu2+−, and Ni2+-bound MBD structures.
| Apo-MBD | Zn2+-MBD | Cu2+-MBD | Ni2+-MBD (19) | |
|---|---|---|---|---|
| Overall Structure | 62.2 | 45.1 | 21.0 | 28.0 |
| Protein | 62.3 | 44.6 | 20.6 | 26.8 |
| α3 Helixa (Res. 65–78) | 87.7 | 97.8 | 25.2 | 32.7 |
| Metals | – | 47.6 | 23.9 | 19.1 |
| Metal Ligands | – | 42.2 | 18.9 | 22.0 |
| Water | 51.7 | 60.7 | 27.1 | 39.3 |
The B-factor for the Zn structure is an average following a single round of refinement when the α3 helix was modeled into the structure.
The α3 helix in the Zn2+-MBD structure, however, is disordered and untraceable in the electron density map (Figure 4c, Supplemental Figure S1). When helix α3 is modeled into the Zn2+-MBD structure there are large regions of the helix in negative Fo-Fc difference electron density, insufficient 2Fo-Fc density, and higher atomic B-factors than in the rest of the protein (Table 3, Supplementary Figure S1). Therefore, residues 62-78 were omitted from the Zn2+-MBD structure. The RMSD for 66 Cα atoms in the Zn2+-MBD and Ni2+-MBD monomers is 1.24 Å, and it is 1.98 Å for all 491 identical atoms, much higher than for Cu2+-MBD compared to Ni2+-MBD.
Similar to the full-length apo-NikR structure, the apo-MBD structure (Figure 4d) has poorly ordered α3 helices (Supplemental Figure S1). When modeled into the structure, the helices do not refine well in 2 of the 4 monomers, have insufficient 2Fo-Fc density, high B-factors, and are therefore either modeled as incomplete helices (monomer A) or are entirely omitted (monomer D). In no case is there sufficient density to model the sidechains of any α3 helix residue longer than alanine or serine. When the apo-MBD structure is aligned to the Ni2+-MBD structure, the RMSD for 305 Cα atoms is 1.40 Å.
Circular dichroism was used to confirm differences in α helical character of the MBD between the apo and metal-bound forms in solution. The Ni2+- and Cu2+-MBD structures have comparable amounts of α helicity, while the apo- and Zn2+-MBD structures have less α helicity as indicated by the ellipticity at 222 nm (Figure 4e). Using Equation 1, the Ni2+- and Cu2+-MBD have approximately 9% more alpha-helicity than the apo- and Zn2+-MBD forms. A fully formed α3 helix would represent about 50% of the helicity for the MBD. Thus, a decrease of 9% helicity suggests that in solution some but not all of the α3 is disordered in apo- and Zn2+-MBD. This result is consistent with the broken electron density and high B-factors for α3 residues in these structures.
DISCUSSION
NikR’s nickel-specific response in binding the nik operon suggests that the protein would be similarly specific to binding nickel over other metals. However, studies have shown that a number of metals are able to bind NikR, some with affinities similar to those of nickel (16). The measured binding affinities using competition assays for copper, nickel, and zinc to full length NikR are, 1 × 10⁻¹⁷, 9 × 10⁻¹³, and <1 × 10⁻¹² M, respectively (16). These comparable affinities raise the questions of how NikR specifically responds to nickel within the cell. The data presented here allow us to discuss how a metal’s ability to order the α3 helix corresponds to its ability to increase NikR’s affinity for DNA.
Metal binding to NikR
EXAFS and XANES studies by the Maroney laboratory have indicated that Ni2+ and Cu2+ ions bind to NikR in square-planar environments (18). The known Ni2+-MBD and full-length Ni2+-NikR structures are consistent with this geometry, and now we show that Cu2+ also binds in the same site as Ni2+ with the same ligands and a nearly identical coordination environment (Figure 2). The Cu2+-MBD has slightly longer metal-ligand bond distances than the distances in the Ni2+-MBD structure (Table 2), also consistent with the trend observed through the EXAFS studies where the metal-Nimd distances were measured as 1.905 Å and 1.928 Å and metal-S distances as 2.130 Å and 2.210 Å for nickel and copper, respectively (18). The absolute values measured from the crystallographic data tend to be longer (Ni-S 2.22 Å; Cu-S 2.43 Å, Ni-Nimd 1.93 Å, Cu-Nimd 2.16 Å).
The Zn2+ sites observed in our structure are partially occupied and the ligands to the metals are highly flexible. The zinc XANES data have been modeled in terms of a single Zn2+ ion bound to NikR with four coordinating ligands, interpreted as a tetrahedral coordination environment (18), which is common for divalent zinc ions. We do not observe a tetrahedral site nor can we imagine a ligand rearrangement that would allow for a tetrahedral geometry (see angles in Table 2 and Figure 2c). Reported distances from EXAFS are 2.229 Å for the Zn-S bond and 1.990 Å for the Zn-Nimd bonds (18). Crystallographic metal-ligand distances are similar but again somewhat longer (we find 2.32 Å for Zn-S and 2.18 Å for Zn-N/O on average). We also observe four unique ligands to the zinc ions, three of which are N/O donors and one that is a S-donor, again consistent with the EXAFS data (18). Re-evaluation of the Zn2+ EXAFS data using our model would determine if the zinc data can be fit as well to a partially occupied dinuclear zinc model as it can to a single tetrahedral zinc site.
Ordering of the α3 helix is metal-dependent
The initial structures of E. coli NikR provided insight into the structural changes nickel induces upon binding to the apo protein (19, 20). In apo-NikR, three of the four α3 helices are disordered and not traceable in the electron density maps (residues 62-77). The Ni2+-bound MBD and full-length NikR structures have complete electron density for all α3 helices with B-factors similar to the rest of the protein (Table 3). Divalent nickel and copper bind tightly to NikR and both are able to order the α3 helix, while divalent zinc binds less tightly and is incapable of ordering the α3 helix (Figure 4, Supplementary Figure S1). Circular dichroism experiments (Figure 4e) also indicate that the Zn2+- and apo-MBD complexes contain less α-helicity than the Cu2+- and Ni2+-MBD complexes. In addition, examination of the RMSDs between different structures indicate that apo and Zn2+-MBD are similar to each other, while the Ni2+- and Cu2+-MBD structures are structurally homologous (Table 4).
Table 4.
Root-mean-squared deviations (RMSDs) between the Cα atoms in apo and metal-bound MBD NikR structures in Å. The number of aligned atoms is in parentheses.
| Apo MBD | Zn2+ MBD | Ni2+ MBD | Cu2+ MBD | |
|---|---|---|---|---|
| Apo MBD | – | 1.18 (65) | 1.40 (305) | 1.43 (305) |
| Zn2+ MBD | 1.18 (65) | – | 1.24 (66) | 1.20 (66) |
| Ni2+ MBD | 1.40 (305) | 1.24 (66) | – | 0.22 (321) |
| Cu2+ MBD | 1.43 (305) | 1.20 (66) | 0.22 (321) | – |
Our results are consistent with previous experiments investigating the stability of the protein in the presence of different metals. In proteolysis experiments, nickel, and copper to a lesser extent, are able to stabilize residues 66-133, which includes the α3 helix, protecting them from proteolysis, while zinc offers no (or little) protection (17). Chemical and thermal stability assays indicate that nickel-bound NikR requires a larger amount of guanidine HCl or a higher temperature to be denatured in comparison to any other metal-bound NikR, though copper did stabilize the protein more than zinc (16). Hydrogen-deuterium exchange experiments indicate that when nickel or copper are bound to the protein the exchange rate is much slower than when zinc or no metal is bound, which the authors relate to the ordering of the α3 helix (18).
An obvious difference between the Zn2+/apo and the Cu2+/Ni2+ structures is the disorder of H76, a residue in α3, in the former and the involvement of this residue in metal ligation in the latter. In Cu2+-and Ni2+-bound MBD, H76 bridges the tetrameric interface by becoming the fourth ligand of the square planar metal site. It is our proposal that nickel and copper’s ability to ligate this residue and in turn “tie down” the α3 helix and its preceding loop is related to the ability of Ni2+- and Cu2+-bound NikR’s ability to bind DNA. The hydrogen bonding network across the tetrameric interface in the MBD formed only in presence of Ni2+ and Cu2+ may also be responsible for inducing some ordering of the α3 helix (Figure 4). The disruption of this hydrogen bonding network in the apo or Zn2+-bound NikR forms could play a role in determining the overall flexibility of the α3 helix observed crystallographically and by circular dichroism.
Ordering of α3 helix is linked to DNA binding
Ordering of the α3 helix and loop preceding it (loop 64-65) has previously been implicated in the mechanism of NikR binding to DNA (19, 20). The structure of Ni2+-NikR-DNA illustrates an interaction between the MBD and backbone phosphates on the DNA (marked with * in Figure 1c). Some of the residues of the MBD that make these contacts are in loop 64-65, which, along with the α3 helix, is disordered in the absence of Ni2+. The structures of apo-, Zn2+-, and Cu2+-MBD in combination with previously solved structures and DNA-binding data provide further evidence that the ordering of the α3 helix is an important step in NikR’s recognition of DNA.
In vitro DNA foot printing and mobility shift assays indicate that although Cu2+, Ni2+, Zn2+, Co2+, and Cd2+ are capable of inducing some DNA binding, Cu2+ and Ni2+ are the most efficient (10). Cu2+- and Ni2+-bound NikR have nanomolar affinity to the nik operon, while Zn2+-NikR has a binding affinity two orders of magnitude less for the operon (10). In vivo, LacZ reporter assays indicate that only nickel and not Mn, Fe, Co, Cu, or Zn is capable of repressing transcription of the nik operon (18). While the inability of copper to repress transcription in vivo is seemingly inconsistent with the DNA-binding (10) and structural data, these latter results are for Cu2+, not Cu+, which is the form of copper that would be most abundant in the cell (39, 40). While specificity of a nickel-regulatory protein for nickel makes logical sense, if there is no free Cu2+ in the cell there would be no evolutionary pressure for NikR to have evolved such that Cu2+ wouldn’t activate it (39, 40).
Mechanism of NikR binding to DNA
The data presented here along with previous studies suggest that there are at least three factors that are likely important in forming a stable complex between NikR and the nik operator DNA with stoichiometric nickel present: (1) hydrogen bonding and electrostatic interactions formed between MBD and DNA upon α3 ordering; (2) the proper orientation of the RHH domains “down” such that residues of this domain can make specific contacts to DNA; and (3) the binding of K+, or a similar cellular abundant cation, to a site between the RHH domains and MBD, stabilizing the RHH domain in a “down”, cis DNA-binding orientation. It should be noted that one turn of helix α2 of the RHH domain must unwind for the “down” RHH conformation to be obtained (20, 22). It has been reported that with excess nickel NikR binds DNA with greater affinity (8, 10). Whether this greater affinity is due to a specific low affinity nickel site in NikR or to a general electrostatic effect is unknown. It is also not known if this ‘low affinity’ nickel effect is physiologically relevant. For simplicity, here we will only consider the mechanistic situation for NikR with stoichiometric nickel and with a second metal cation like K+.
Figure 5 shows many possible DNA binding pathways, but the process most likely to occur in the cell on a regular basis consists of steps I to V. Ni2+ binds to the high-affinity site of NikR, stabilizing the α3 helix and its preceding loop (I ➔ II). The NikR molecule makes initial contacts to DNA, stabilized via hydrogen bonds and electrostatic interactions between residues in the loop of the MBD and the phosphate backbone (II ➔ III). The conformationally flexible DNA-binding RHH domains are then capable of finding their binding sites in the major grooves of the DNA, enforcing contacts between the NikR molecule and DNA (III ➔ IV). Finally, an abundant intracellular metal ion such as potassium binds at the interface of the MBD and RHH domains, serving to stabilize this NikR configuration (IV ➔ V).
Figure 5.

Proposed NikR regulatory mechanism. Dimeric RHH domains are represented by white triangles, each monomer of the MBD is represented in a different color, bold empty rectangles represent an ordered α3 helix, nickel ions are represented by green circles outlined in black, and potassium ions are represented in large black spheres.
While there is no experimental evidence to indicate when a cation like K+ might bind to the RHH-MBD interface, the affinity of NikR for a cation like K+ should be greater in the NikR-DNA complex where the RHH are stably positioned near the MBD (Figure 5, IV). In the absence of DNA, RHH domains are highly mobile and K+ binding sites only exist transiently when the RHH domains sample cis (I′) or trans (I″) conformations. Thus, while K+ may bind weakly to multiple forms of NikR (I′, I″, II′ in Figure 5), high occupancy of K+ is likely only in the NikR-DNA state (V). Again, it is not known if the RHH domain or MBD binds DNA first, but we find it easiest to think about the MBD making the first contacts. The interactions between residues in the MBD with backbone phosphates in the DNA are not specific but could initially localize NikR to DNA while the protein searches for the ideal binding site. With NikR localized on DNA, the floppy RHH domains will occasionally sample a “down” conformation and when they do, they will make specific contacts to DNA when the correct operator sequence is available. The fact that apo-NikR does not bind DNA with measurable affinity suggests that if the RHH domains bind first, they would have weak affinity until a metal-ordered MBD is also stably bound to DNA.
Conclusions
To control nickel concentrations in the cell, Nature developed a transcription factor both flexible enough to bind two half sites separated by two turns of DNA and conformationally regulated by the binding of nickel. Interestingly, the only conformational change observed upon Ni2+ binding is the ordering of α3 and its preceding loop (20-22), the RHH domains remain flexible (20-22). To prevent untimely repression of the nik operon, it is important that NikR be highly responsive toward nickel ions, but not be activated by other intracellular transition metals. Divalent copper is the only metal known to induce DNA-binding affinities in vitro equivalent to that of nickel. Current research suggests that any free copper in the cell is reduced to Cu+ (39, 40), which would negate any evolutionary pressure for NikR to be able to distinguish between Ni2+ and Cu2+. Unlike Cu2+, there is a significant amount of Zn2+ within the cell, although the amount of free zinc may be small. While Zn2+ can bind NikR with some affinity, it does not induce the ordering of the α3 helix, and Zn2+-NikR’s affinity to DNA is decreased compared to Ni2+-NikR. Here we illustrate a correlation between the ability of a metal to order the α3 helix and that metal’s ability to induce DNA binding, and use this information along with previous results to describe a mechanism for NikR binding to DNA.
Supplementary Material
Supplemental Figure 1. 2Fo-Fc electron density around the area of the α3 helix. Wall-eyed stereo images. Monomers are colored separately and two of the four monomers in the apoNikR, apoMBD, ZnMBD, NiNikR, NiMBD, and CuMBD structures are shown. Map is contoured in grey at 1.0 σ. Nickel ions are in green, copper ions in orange, and zinc ions in aqua spheres. Splotchy or poor density in the apoNikR, apoMBD, and ZnMBD structures indicated disordered helices in the crystal, while in the Ni- and Cu-bound forms the helices are well ordered with complete electron density for the helices.
Supplemental Figure 2. Two monomer “states” in the Zn-MBD crystal. a. The Zn1 (less prevalent site) is occupied in about 25% of all monomers of the crystal and is ligated by H89, H87, and C95. b. The Zn2 (more prevalent site) is occupied is about 57% of monomers in the crystal and is ligated by H87, C95, and E97. The occupancies are estimates based on refinement with fixed B-factors. Figures 2c and 2d show the observed average site. Here we show the two main components that comprise the average.
Acknowledgments
Portions of this research were carried out at the Stanford Synchrotron Radiation Laboratory (SSRL), a national user facility operated by Stanford University on behalf of the U.S. Department of Energy, Office of Basic Energy Sciences. The SSRL Structural Molecular Biology Program is supported by the Department of Energy, Office of Biological and Environmental Research, and by the National Institutes of Health, National Center for Research Resources, Biomedical Technology Program, and the National Institute of General Medical Sciences. Use of the Advanced Photon Source (Contract No. DE-AC02-06CH11357) and the National Synchrotron Light Source at Brookhaven National Laboratory (Contract No. DE-AC02-98CH10886) was supported by the U.S. Department of Energy, Office of Science, and Office of Basic Energy Sciences.
Abbreviations
- EXAFS
extended X-ray absorption fine structure
- HEPES
4-(2-hydroxyethyl)-1-piperazineethanesulfonic acid
- GuHCl
guanidine hydrochloride
- MBD
the metal-binding domain of NikR, residues 49-133
- NTA
nitrilotriacetic acid
- PAR
4-(2-pyridylazo)resorcinol
- RHH
the ribbon-helix-helix domain of NikR, residues 1-48
- RMSD
root-mean-squared deviation
- Tris
tris(hydroxymethyl)aminomethane
- XANES
X-ray absorption near-edge spectroscopy
Footnotes
This work was sponsored by the National Institutes of Health Grant GM69857 (C.L.D.), CEHS Grant P30-ES002109, the Gray Fund for Undergraduate Research (Y.G.), the Natural Sciences and Engineering Research Council Postgraduate Scholarship (S.C.W.), Natural Sciences and Engineering Council of Canada (D.B.Z.) and the Canada Research Chairs Program (D.B.Z.).
References
- 1.Unden G, Bongaerts J. Alternative respiratory pathways of Escherichia coli: energetics and transcriptional regulation in response to electron acceptors. Biochim Biophys Acta. 1997;1320:217–234. doi: 10.1016/s0005-2728(97)00034-0. [DOI] [PubMed] [Google Scholar]
- 2.Davis GS, Flannery EL, Mobley HLT. Helicobacter pylori HP1512 is a nickel-responsive NikR-regulated outer membrane protein. Infect Immun. 2006;74:6811–6820. doi: 10.1128/IAI.01188-06. [DOI] [PMC free article] [PubMed] [Google Scholar]
- 3.Mulrooney SB, Hausinger RP. Nickel uptake and utilization by microorganisms. FEMS Microbiol Rev. 2003;27:239–261. doi: 10.1016/S0168-6445(03)00042-1. [DOI] [PubMed] [Google Scholar]
- 4.Wu LF, Navarro C, de Pina K, Quenard M, Mandrand MA. Antagonistic Effect of Nickel on the Fermentative Growth of Escherichia coli K-12 and Comparison of Nickel and Cobalt Toxicity on the Aerobic and Anaerobic Growth. Environ Health. 1994;102:297–300. doi: 10.1289/ehp.94102s3297. [DOI] [PMC free article] [PubMed] [Google Scholar]
- 5.de Pina K, Desjardin V, Mandrand-Berthelot MA, Giordano G, Wu LF. Isolation and Characterization of the nikR Gene Encoding a Nickel-Responsive Regulator in Escherichia coli. J Bacteriol. 1999;181:670–674. doi: 10.1128/jb.181.2.670-674.1999. [DOI] [PMC free article] [PubMed] [Google Scholar]
- 6.Wolfram L, Haas E, Bauerfeind P. Nickel Represses the Synthesis of the Nickel Permease NixA of Helicobacter pylori. J Bacteriol. 2006;188:1245–1250. doi: 10.1128/JB.188.4.1245-1250.2006. [DOI] [PMC free article] [PubMed] [Google Scholar]
- 7.Navarro C, Wu LF, Mandrand-Berthelot MA. The nik operon of Escherichia coli encodes a periplasmic binding-protein-dependent transport system for nickel. Mol Microbiol. 1993;9:1181–1191. doi: 10.1111/j.1365-2958.1993.tb01247.x. [DOI] [PubMed] [Google Scholar]
- 8.Chivers PT, Sauer RT. Regulation of high affinity nickel uptake in bacteria. Ni2+-Dependent interaction of NikR with wild-type and mutant operator sites. J Biol Chem. 2000;275:19735–19741. doi: 10.1074/jbc.M002232200. [DOI] [PubMed] [Google Scholar]
- 9.Chivers PT, Sauer RT. NikR Repressor: High-Affinity Nickel Binding to the C-Terminal Domain Regulates Binding to Operator DNA. Chem Biol. 2002;9:1141–1148. doi: 10.1016/s1074-5521(02)00241-7. [DOI] [PubMed] [Google Scholar]
- 10.Bloom SL, Zamble DB. Metal-Selective DNA-Binding Response of Escherichia coli NikR. Biochemistry. 2004;43:10029–10038. doi: 10.1021/bi049404k. [DOI] [PubMed] [Google Scholar]
- 11.Benanti EL, Chivers PT. The N-terminal Arm of the Helicobacter pylori Ni2+-dependent Transcription Factor NikR Is Required for Specific DNA Binding. J Biol Chem. 2007;282:20365–20375. doi: 10.1074/jbc.M702982200. [DOI] [PubMed] [Google Scholar]
- 12.Ernst FD, Kuipers EJ, Heijens A, Sarwari R, Stoof J, Penn CW, Kusters JG, van Vliet AHM. The Nickel-Responsive Regulator NikR controls Activation and Repression of Gene Transcription in Helicobacter pylori. Infect Immun. 2005;73:7252–7258. doi: 10.1128/IAI.73.11.7252-7258.2005. [DOI] [PMC free article] [PubMed] [Google Scholar]
- 13.Ernst FD, Stoof J, Horrevoets WM, Kuipers EJ, Kusters JG, van Vliet AHM. NikR Mediates Nickel-Responsive Transcriptional Repression of the Helicobacter pylori Outer Membrane Proteins FecA3 (HP1400) and FrpB4 (HP1512) Infect Immun. 2006;74:6821–6828. doi: 10.1128/IAI.01196-06. [DOI] [PMC free article] [PubMed] [Google Scholar]
- 14.Delany I, Ieva R, Soragni A, Hilleringmann M, Rappuoli R, Scarlato V. In Vitro Analysis of Protein-Operator Interactions of the NikR and Fur Metal-Responsive Regulators of Coregulated Genes in Helicobacter pylori. J Bacteriol. 2005;187:7703–7715. doi: 10.1128/JB.187.22.7703-7715.2005. [DOI] [PMC free article] [PubMed] [Google Scholar]
- 15.Pennella MA, Shokes JE, Cosper NJ, Scott RA, Giedroc DP. Structural elements of metal selectivity in metal sensor proteins. Proc Natl Acad Sci U S A. 2003;100:3713–3718. doi: 10.1073/pnas.0636943100. [DOI] [PMC free article] [PubMed] [Google Scholar]
- 16.Wang SC, Dias AV, Bloom SL, Zamble DB. Selectivity of Metal Binding and Metal-Induced Stability of Escherichia coli NikR. Biochemistry. 2004;43:10018–10028. doi: 10.1021/bi049405c. [DOI] [PubMed] [Google Scholar]
- 17.Dias AV, Zamble DB. Protease digestion analysis of Escherichia coli NikR: evidence for conformational stabilization with Ni(II) J Bio Inorg Chem. 2005;10:605–612. doi: 10.1007/s00775-005-0008-2. [DOI] [PubMed] [Google Scholar]
- 18.Leitch S, Bradley MJ, Rowe JL, Chivers PT, Maroney MJ. Nickel- Specific Response in the Transcriptional Regulator, Escherichia coli NikR. J Am Chem Soc. 2007;129:5085–5095. doi: 10.1021/ja068505y. [DOI] [PubMed] [Google Scholar]
- 19.Schreiter ER, Sintchak MD, Guo Y, Chivers PT, Sauer RT, Drennan CL. Crystal structure of nickel-responsive transcription factor NikR. Nat Struct Bio. 2003;10:794–799. doi: 10.1038/nsb985. [DOI] [PubMed] [Google Scholar]
- 20.Schreiter ER, Wang SC, Zamble DB, Drennan CL. NikR-operator complex structure and the mechanism of repressor activation by metal ions. Proc Natl Acad Sci U S A. 2006;103:13676–13681. doi: 10.1073/pnas.0606247103. [DOI] [PMC free article] [PubMed] [Google Scholar]
- 21.Dian C, Schauer K, Kapp U, McSweeney SM, Labigne A, Terradot L. Structural Basis of the Nickel Response in Helicobacter pylori: Crystal Structures of HpNikR in Apo and Nickel-bound States. J Mol Bio. 2006;361:715–730. doi: 10.1016/j.jmb.2006.06.058. [DOI] [PubMed] [Google Scholar]
- 22.Chivers PT, Tahirov TH. Structure of Pyrococcus horikoshii NikR: Nickel Sensing and Implications for the Regulation of DNA Recognition. J Mol Bio. 2005;348:597–607. doi: 10.1016/j.jmb.2005.03.017. [DOI] [PubMed] [Google Scholar]
- 23.Otwinowski Z, Minor W. Processing of X-ray Diffraction Data Collected in Oscillation Mode. Methods Enzymol. 276 Macromolecular Crystallography, part A. 1997:307–326. doi: 10.1016/S0076-6879(97)76066-X. [DOI] [PubMed] [Google Scholar]
- 24.Kissinger CR, Gehlhaar DK, Fogel DB. Rapid automated molecular replacement by evolutionary search. Acta Crystallogr D. 1999;55:484–491. doi: 10.1107/s0907444998012517. [DOI] [PubMed] [Google Scholar]
- 25.Brünger AT, Adams PD, Clore GM, DeLano WL, Gros P, Grosse-Kunstleve RW, Jiang JS, Kuszewski J, Nilges M, Pannu NS, Read RJ, Rice LM, Simonson T, Warren GL. Crystallography & NMR system: A new software suite for macromolecular structure determination. Acta Crystallogr D. 1998;54:905–21. doi: 10.1107/s0907444998003254. [DOI] [PubMed] [Google Scholar]
- 26.McRee DE. XtalView/Xfit – A Versatile Program for Manipulating Atomic Coordinates and Electron Density. J Struct Bio. 1999;125:156–165. doi: 10.1006/jsbi.1999.4094. [DOI] [PubMed] [Google Scholar]
- 27.Emsley P, Crowtan K. Coot: model-building tools for molecular graphics. Acta Crystallogr D. 2004;60:2126–2132. doi: 10.1107/S0907444904019158. [DOI] [PubMed] [Google Scholar]
- 28.Collaborative Computational Project, N. The CCP4 Suite: Programs for Protein Crystallography. Acta Crystallogr D. 1994;50:760–763. doi: 10.1107/S0907444994003112. [DOI] [PubMed] [Google Scholar]
- 29.Leslie AGW. MOSFLM, 6.2.5. Cambridge, UK: 2005. [Google Scholar]
- 30.Evans P. Scala, 3.2.5. Cambridge, UK: 2006. [Google Scholar]
- 31.Storoni LC, McCoy AJ, Read RJ. Likelihood-enhanced fast rotation functions. Acta Crystallogr. 2004;D60:432–438. doi: 10.1107/S0907444903028956. [DOI] [PubMed] [Google Scholar]
- 32.Atanassova A, Lam R, Zamble DB. A high-performance liquid chromatography method for determining transition metal content in proteins. Anal Biochem. 2004;335:103–111. doi: 10.1016/j.ab.2004.08.013. [DOI] [PubMed] [Google Scholar]
- 33.Gill SC, von Hippel PH. Calculation of protein extinction coefficients from amino acid sequence data. Anal Biochem. 1989;182:319–326. doi: 10.1016/0003-2697(89)90602-7. [DOI] [PubMed] [Google Scholar]
- 34.Greenfield NJ, Fasman GD. Computed circular dichroism spectra for the evaluation of protein conformation. Biochemistry. 1969;8:4108–4116. doi: 10.1021/bi00838a031. [DOI] [PubMed] [Google Scholar]
- 35.Morrisett JD, David JSK, Pownall HJ, Gotto AM. Interaction of an apolipoprotein (apoLP-alanine) with phosphatidylcholine. Biochemistry. 1973;12:1290–1299. doi: 10.1021/bi00731a008. [DOI] [PubMed] [Google Scholar]
- 36.Taylor JW, Kaiser ET. Structure-function analysis of proteins through the design, synthesis, and study of peptide models. Methods Enzymol. 1987;154:473–498. doi: 10.1016/0076-6879(87)54091-5. [DOI] [PubMed] [Google Scholar]
- 37.Kleywegt GJ, Jones TA. A super position. CCP4/ESF-EACBM Newsletter Protein Crystallography. 1994;31:9–14. [Google Scholar]
- 38.Rulisek L, Vondrasek J. Coordination geometries of selected transition metal ions (Co2+, Ni2+, Cu2+, Zn2+, Cd2+, and Hg2+) in metalloproteins. J Inorg Biochem. 1998;71:115–127. doi: 10.1016/s0162-0134(98)10042-9. [DOI] [PubMed] [Google Scholar]
- 39.Finney LA, O’Halloran TV. Transition metal speciation in the cell: insights from the chemistry of metal ion receptors. Science. 2003;300:931–936. doi: 10.1126/science.1085049. [DOI] [PubMed] [Google Scholar]
- 40.Rosenzweig AC. Copper delivery by metallochaperone proteins. Acc Chem Res. 2001;34:119–128. doi: 10.1021/ar000012p. [DOI] [PubMed] [Google Scholar]
Associated Data
This section collects any data citations, data availability statements, or supplementary materials included in this article.
Supplementary Materials
Supplemental Figure 1. 2Fo-Fc electron density around the area of the α3 helix. Wall-eyed stereo images. Monomers are colored separately and two of the four monomers in the apoNikR, apoMBD, ZnMBD, NiNikR, NiMBD, and CuMBD structures are shown. Map is contoured in grey at 1.0 σ. Nickel ions are in green, copper ions in orange, and zinc ions in aqua spheres. Splotchy or poor density in the apoNikR, apoMBD, and ZnMBD structures indicated disordered helices in the crystal, while in the Ni- and Cu-bound forms the helices are well ordered with complete electron density for the helices.
Supplemental Figure 2. Two monomer “states” in the Zn-MBD crystal. a. The Zn1 (less prevalent site) is occupied in about 25% of all monomers of the crystal and is ligated by H89, H87, and C95. b. The Zn2 (more prevalent site) is occupied is about 57% of monomers in the crystal and is ligated by H87, C95, and E97. The occupancies are estimates based on refinement with fixed B-factors. Figures 2c and 2d show the observed average site. Here we show the two main components that comprise the average.