 Despite recent remarkable advances in microscopic techniques, it still remains very challenging to directly observe the complex structure of cytoplasmic organelles in live cells without a fluorescent label.
Abstract
Despite recent remarkable advances in microscopic techniques, it still remains very challenging to directly observe the complex structure of cytoplasmic organelles in live cells without a fluorescent label. Here we report label-free and live-cell imaging of mammalian cell, Escherischia coli, and yeast, using interferometric scattering microscopy, which reveals the underlying structures of a variety of cytoplasmic organelles as well as the underside structure of the cells. The contact areas of the cells attached onto a glass substrate, e.g., focal adhesions and filopodia, are clearly discernible. We also found a variety of fringe-like features in the cytoplasmic area, which may reflect the folded structures of cytoplasmic organelles. We thus anticipate that the label-free interferometric scattering microscopy can be used as a powerful tool to shed interferometric light on in vivo structures and dynamics of various intracellular phenomena.
Introduction
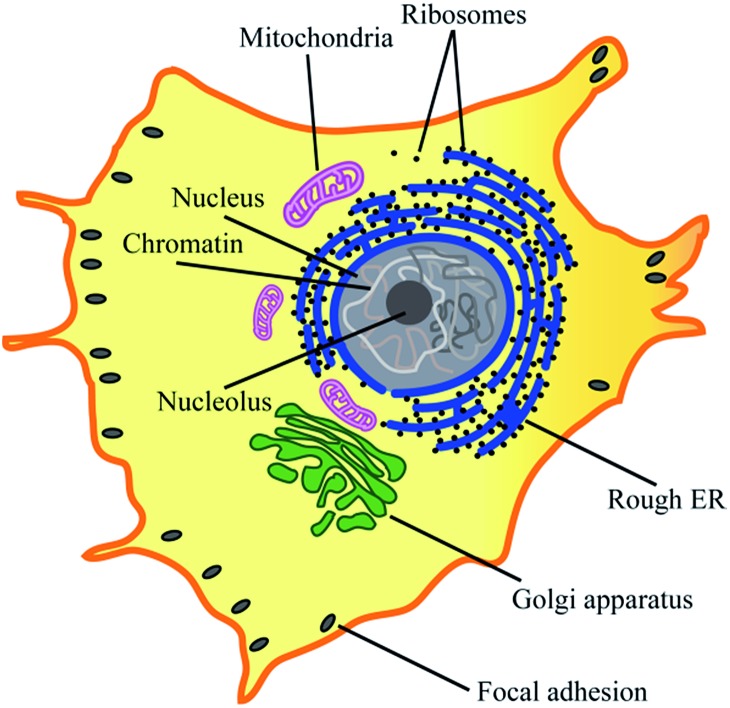
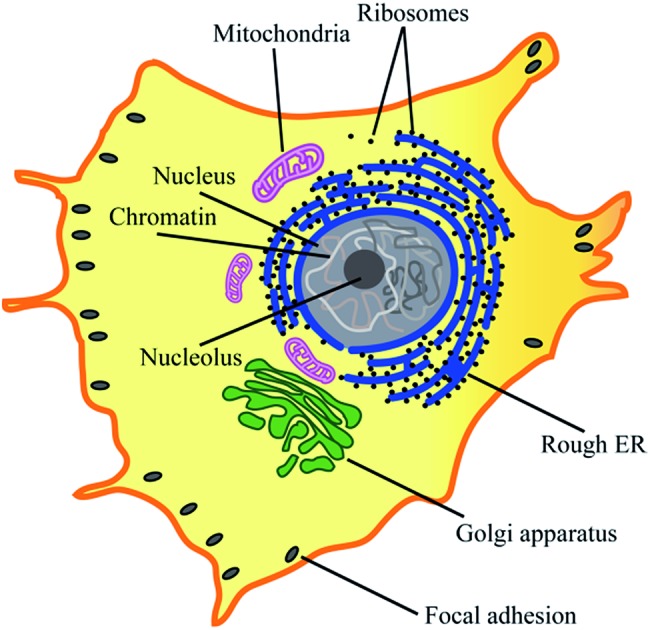
Most eukaryotic cells are composed of various cytoplasmic organelles that are separated from each other and from cytosol by single or double endoplasmic membranes (EMs) (Fig. 1).1–3 The organelle membranes have an important role in a variety of essential cellular functions as many vital biochemical processes between organelles and cytosol occur across them. As one of the morphological features, some EMs are folded to improve their biochemical efficiency by increasing their surface area. For example, as the powerhouse of the cell, mitochondria are covered by two membranes of a smooth outer membrane and a folded inner membrane (violet in Fig. 1).4 Endoplasmic reticulum (ER), the largest membrane-bound organelle in the cell, has a typical folded membrane structure (blue in Fig. 1) that is divided into distinct domains of the nuclear envelop and the peripheral rough/smooth ER. Golgi apparatus, the other cisternae structure in cell, is the main organelle responsible for mediating the transportation of protein and fat within the cell (green in Fig. 1).
Fig. 1. Cytoplasmic organelles inside an eukaryotic cell.
Most of the organelle membranes are composed of lipid bilayers with a thickness of 5–6 nm, and thus they cannot be resolved by bright field microscopy. So far, electron microscopy allows one to visualize the finest structures of those organelles at a subnanometer resolution, but it inevitably requires a dehydration or fixation process resulting in structural deformations of sample cells.5,6 On the other hand, one great advantage of fluorescence microscopy is its capability of imaging the morphological and functional alteration in live cells.7–15 Nevertheless, it also has critical restrictions including limitations in observation time due to photobleaching and undesirable alteration in cellular functions induced by tagging fluorescent molecules to the specific target sites.
Recently, a powerful imaging technique named interferometric scattering (iSCAT) microscopy was developed by the Sandoghdar and Kukura groups, which was found to be of exceptional use in label-free tracking of nano-sized particles beyond a diffraction limit at a high temporal resolution.16–19 Conceptually, it is based on “interference reflection microscopy (IRM)” which was introduced in the 1960s to measure small inter-surface distance between two (upper and lower) planar surfaces of a glass substrate and to observe the underside of adherent cells.20 Since then, IRM has been further developed into several optimized techniques generally referred to as “reflection interference contrast microscopy (RICM)” that enable both absolute height measurement with great accuracy of ∼1 nm in the vertical direction and instantaneous construction of the local surface profile of microscopic objects near surfaces.21–26
In comparison to these RICM techniques, the major difference in iSCAT microscopy is to employ a coherent laser as a light source to detect a very weak signal scattered from a nano-scatterer. The iSCAT technique collects the light (Es) scattered by the object together with a reference light field (Er) reflected at an interface. The total intensity of light is then given by
 |
1 |
where φ is the relative phase between the two electric fields. Due to the interference term that is the third on the right-hand side of eqn (1), the object would appear as a dark dip or a bright peak, depending on the relative phase factor, on top of a constant and large background associated with |Er|2.
Until now, the iSCAT microscopy has been mainly used to identify and track small particles in motion in various artificial bio-mimicking systems such as extracted biopolymers, lipid bilayer substrates, and giant unilamellar vesicles, which have no natural complexity of a living cell.27–33 Here, we for the first time explore a new possibility of iSCAT microscopy toward a label-free live-cell imaging. Surprisingly, the iSCAT cell imaging reveals not only the close contact areas of a cell on a glass substrate, but also a variety of complex fringe patterns that reflect the folded membrane structures of various cytoplasmic organelles.
Results and discussion
iSCAT image of live COS-7 cells
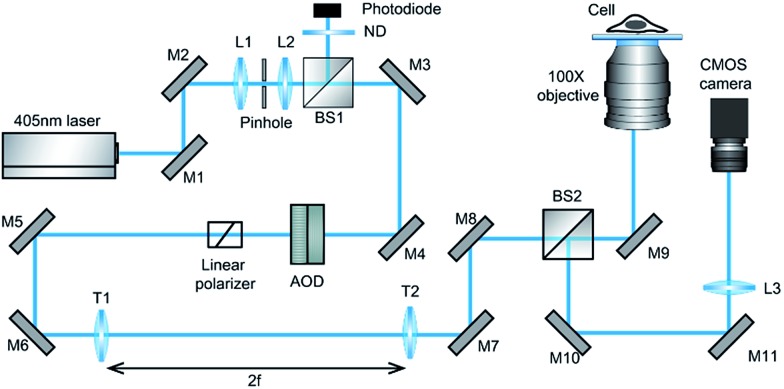
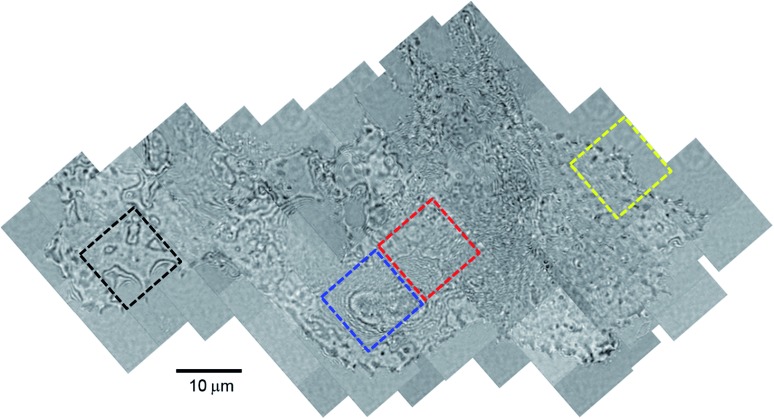
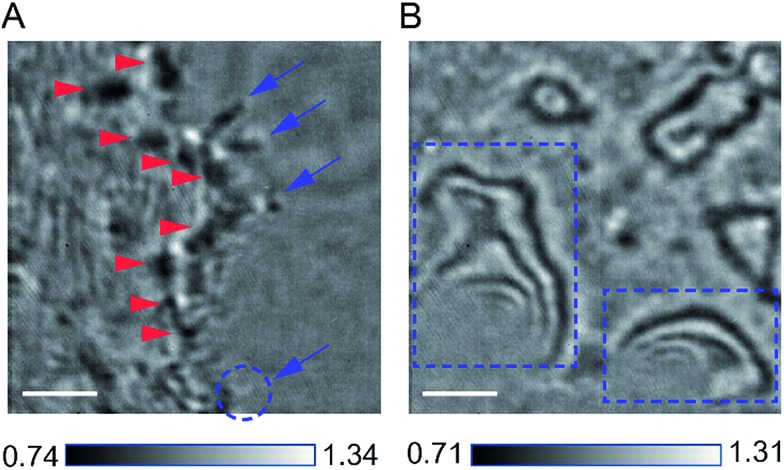
Our design of iSCAT microscopy was built in a similar way to the one originally developed by the Sandoghdar group (Fig. 2; for detail, see the materials and methods section).18Fig. 3 shows a typical iSCAT image of living COS-7 cells, fibroblast-like cell lines derived from monkey kidney tissue. Here, several connected cells form a tissue-like structure, and their boundaries are indistinguishable in our iSCAT image. To construct this mosaic picture in Fig. 3, we captured many snapshots contiguously by manually moving an X–Y piezo-stage at the interval of ∼5 μm in order to construct a whole cell image by patching images of subcellular region (viewfield area: 10 × 10 μm2). As illustrated in the previous RICM experiments, the light intensity has a minimum value when the path length difference between two interfering rays is close to zero. Thus, the close contact areas in the underside of a cell onto a glass substrate would appear to be dark.22 Indeed, the focal adhesion sites of cells are the dark spots that are broadly and mainly distributed at the cell boundary (see the yellow boxed area in Fig. 3 and the structures marked by the red arrowheads in its magnified view of Fig. 4A). Also, the fine structures of filopodia, narrow cytoplasmic projections extended beyond the leading edge of lamellipodia, are clearly visible as dark features (see the structures marked by the blue arrows in Fig. 4A), which is invisible in a bright field microscopy. Furthermore, filopodia with bright intensity (the blue circled area in Fig. 4A) is observed presumably because it is detached from the glass substrate.
Fig. 2. Schematic of iSCAT microscopy used in our experiments. The beam of a 405 nm diode laser is steered by two AODs for the x and y direction in the sample plane to raster-scan on the target cells inside a glass chamber placed on 100× objective [M1-11, mirrors; L1-3, lens; BS1-2, 50 : 50 beam splitters; ND, neutral density filter; AOD, acousto-optic deflector; and T1-2, telecentric lens (f = 500 mm)].
Fig. 3. Interferometric scattering image of COS-7 cells. A typical characteristic feature of COS-7 cells showing the underlying structures of intracellular organelles revealed in iSCAT microscopy: this mosaic image is constructed with a total of 90 iSCAT images contiguously captured by manually moving the X–Y stage at the interval of ∼5 μm. The labyrinth-like fringe structure surrounding the cellular organelle with an oval shape and the irregular fringe structure in the cytoplasmic region are highlighted with blue and red dashed-line boxes, respectively. The image in yellow dashed-line box shows a cell boundary in close contact with the glass substrate. The strong fringe pattern in black dashed-line box corresponds to a cell boundary with great topological variations. In this image are shown several cells tightly connected with each other, but it is difficult to identify boundaries between them. The viewfield area of a single snapshot image is 10 × 10 μm2.
Fig. 4. Zoom-in iSCAT images of COS-7 cell boundaries. (A) Close contact areas of a COS-7 cell spreading onto a glass substrate. The narrow filopodia structures extended from the thin lamellipodium are shown as dark marks (blue arrows), except one dim blob, which seems to be a detached filopodium from a glass substrate (blue circle). Also, the focal adhesions appear as dark spots (red arrowheads) that are scattered within the rim of a cell lamellipodium. (B) Strong fringe patterns formed along the cell boundary. These fringes can be formed by either overhanging structure at the edge of a cell or second reflection from the top surface of a cell (blue boxed areas). The scale bar is 2 μm.
Strong fringe pattern around the cell boundary
The image in Fig. 3 shows very strong fringe patterns formed along the cell boundary (see the black boxed area and its magnified view in Fig. 4B), which can be induced by either the overhanging structure of the cell membrane,20 slightly lifted up from the glass substrate, or the reflection from the upper cell membrane as shown in the RICM experiment on red blood cells.34 In both cases, the fringes sensitive to the inter-surface distance are produced by the interference between the reference light reflected by the glass surface and the scattering light from membrane – note that, when the path length difference between the two lights equals integer multiples of the wavelength of the incident light (λi), the two fields constructively interfere. If we only consider the refractive index of culture medium, n ∼ 1.3, the vertical distance (h) between adjacent dark (or bright) bands in the fringe of Fig. 4B is estimated to be about 150 nm by a simple calculation, h = λi/(2 × n), where λi is 405 nm. On the other hand, the intracellular space is filled with a complex mixture of cytosol and many organelles with a broad range of refractive indices. Thus, it is difficult to estimate the exact value of h from the iSCAT image of Fig. 4B. To confirm that the fringe pattern in the iSCAT image is directly related to the h of scattering point on a cell surface, we carried out iSCAT measurements of Escherischia coli (E. coli) OP50 of which the head part is anchored on the glass surface at a standing angle (θs). The fringe spacing in the iSCAT image of E. coli can be well-described by assuming a rod shape for the cell (Fig. S4 and ESI Video-E. coli.avi†).
Labyrinth-like fringe patterns in cytoplasm
The RICM technique has been primarily utilized to observe the underside of cells close to the glass substrate due to the lack of contrast for the light reflected or scattered from intracellular structures in the presence of inhomogeneity in refractive index, n. Indeed, it has been known that the cell outer membrane has a relatively high value of n in the range of 1.46–1.60 depending on its composition, compared to cytosol (n = 1.36–1.39).35–38 Recently, it was shown that the nucleus has the n values of 1.355–1.365, which is lower than that of cytoplasm.39 Despite such complexity in the distribution of n values, our iSCAT microscopy is found to be of great use in studying various intracellular structures.
Interestingly, we found a labyrinth-like fringe pattern enveloping the cytoplasmic organelle with an oval shape (blue boxed area in Fig. 3 and its zoom-in image in Fig. S5A†). Noting that the artifactual images produced by diffraction usually exhibit simply connected ring patterns, this labyrinth-like structure reflects an existence of any specific organelle inside a cell. In addition, quite a few fringe patterns fill in the scanned cell image in a random fashion. For example, the zoom-in image of the red boxed area marked in Fig. 3 is depicted in Fig. S5B.† Also, we note that the amplitude variations in these fringe patterns do not show any noticeable regularity (Fig. S5C and S5D†), while it is gradually decreased as the h of scattering point on a cell body of E. coli OP50 is increased (Fig. S4B†). This indicates that these interior fringe structures may represent the folded structures of membrane organelles, which has not been reported in the previous RICM experiments for other types of cells including monocyte, neutrophil, and macrophage.22,23
Real-time tracking
In principle, iSCAT technique is similar to RICM. However, the sensitivity of iSCAT becomes much enhanced by using a coherent laser as a light source as well as by focusing light on a small spot. Thanks to these modifications, the iSCAT microscopy has a few useful capabilities. We could even track the Brownian motion of a dancing body, which is usually observed as a vividly moving insoluble polyphosphate complexes with the size of <1 μm in the vacuole of yeast Saccharomyces cerevisiae (Fig. S6 and ESI Video-yeast.avi†).40,41 From the analyses of fringe spacing, we could calculate the standing angle of a given E. coli, which is anchored but thermally fluctuating (Fig. S4 and ESI Video-E. coli.avi†). Most importantly, we here show that the spatial variation of refractive indices associated with cell outer membrane and the internal organelles can be investigated by means of analyzing iSCAT images of living cells.
Direct comparison of iSCAT images with phase contrast microscopy for the same fixed cells
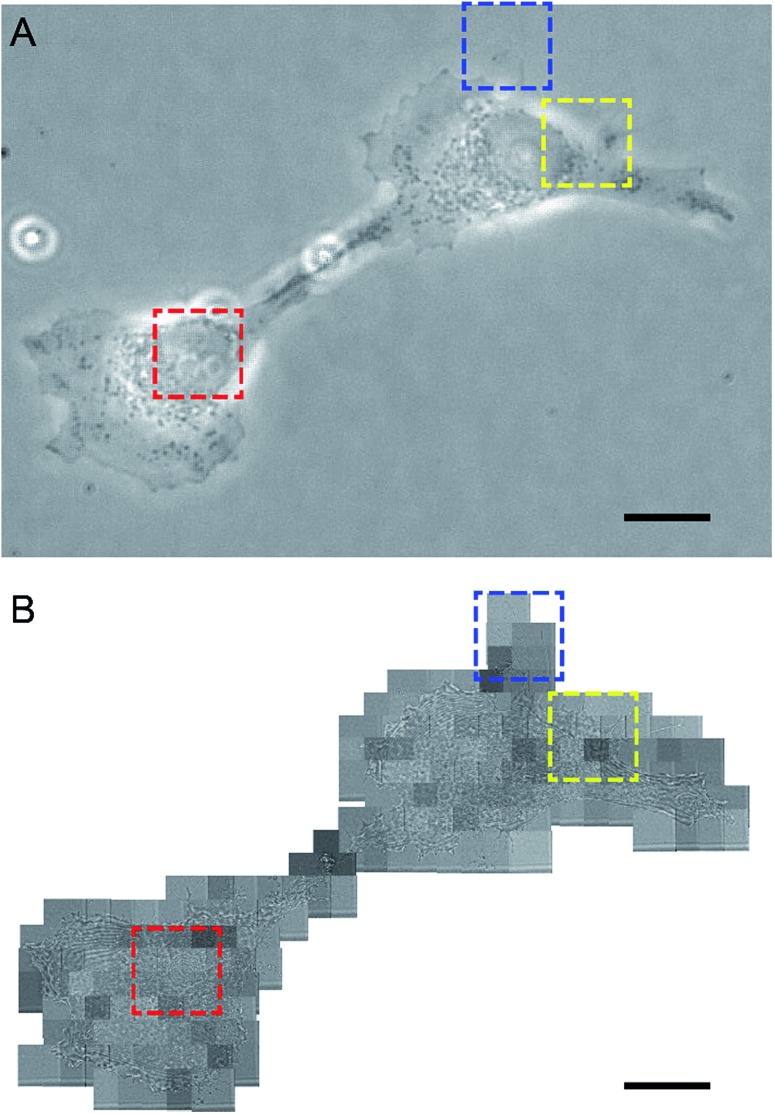
Next, we directly compare the iSCAT image with the phase contrast image to address the advantages as well as weaknesses in cell imaging via iSCAT microscopy. It required a long experimental time to complete the whole experimental procedure because scanning a whole cell by iSCAT microscopy is time-consuming and the two microscopy systems are located in separated places, which makes simultaneous imaging impossible. To avoid any undesirable morphological changes that may occur to living cells over the prolonged experimental time, we used fixed COS-7 cells inside a shallow glass chamber. Fig. 5 and S8† are typical examples of cell images (here, two cells are linked together by a narrow tubular bridge) taken with the two microscopic techniques, which allowed us to directly compare the characteristics and qualities of those techniques. Here, their magnifications were similar: 400× and 500× in phase contrast and iSCAT microscopy, respectively. Then, to clearly demonstrate the strength of iSCAT microscopy, we directly compared images taken for intracellular and extracellular regions including a cell nucleus, thin branches of filopodia, and a wide lamellipodium, which are highlighted in three dashed-line boxes in Fig. 5 (see Fig. S7† for enlarged image).
Fig. 5. Direct comparison between the phase contrast cell image (A) and the iSCAT cell image (B) taken for the same fixed COS-7 cells. As shown in the phase contrast image (A), two cells are linked together by a narrow tubular bridge. The corresponding iSCAT image (B) is constructed with a total of 179 iSCAT snapshots. The area of the nucleus in the lower-left cell is indicated by red dashed-line boxes in (A) and (B). Also, the areas of lamellipodium and thin filopodia branches at cell boundary in the upper-right cell are marked with yellow and blue dashed-line boxes in (A) and (B), respectively. Here, the phase contrast image (A) was taken at 400× magnification while the iSCAT image (B) was taken at about 500× magnification. The viewfield area of a single iSCAT snapshot image (B) is 10 × 10 μm2. For the zoomed-in images, see Fig. S7.† The scale bars in (A) and (B) are 20 μm.
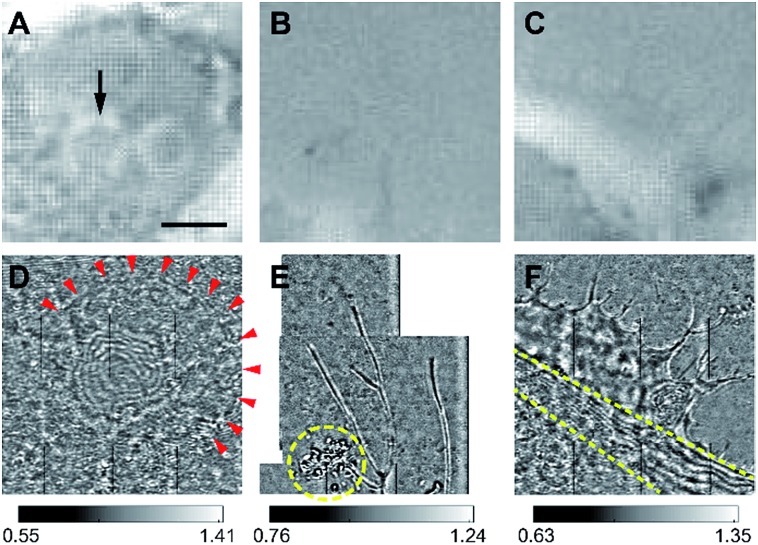
First of all, a cell nucleus is the largest cellular organelle occupying about 10% of the total cell volume. In general, in phase contrast microscopy, it appears visible as its refractive index differs from that of cytoplasm. Also, there are bright phase halos near the nucleus, which are usually observed at the boundary regions of a large specimen (such as a nucleus) (red dashed-line box in Fig. 5A). In iSCAT microscopy (see red dashed-line box in Fig. 5B or 6A), contrary to phase contrast microscopy, the boundary of a nucleus is conspicuous by dark fringes (red arrowheads in Fig. 6D). Interestingly, we found that the fringed region at the center of the iSCAT image in Fig. 6D reflects 3-dimensionally rounded structures inside a cell nucleus, which might be nucleoli or other membranous or non-membranous granular objects revealed by phase contrast microscopy (black arrow in Fig. 6A). We further note that the intensity of interfered light significantly varies inside the nucleus, reflecting inhomogeneous distribution of organelles and macromolecule complexes such as nucleolus and chromosomes, etc. within a nucleus. According to our observations, the internal architecture of a nucleus is only partly accessible by iSCAT microscopy due to the limited depth-of-field of iSCAT along z-axis.
Fig. 6. Zoomed-in images for several cellular features from fixed COS-7 cells observed by phase contrast and iSCAT microscopy. (A and D) The cell nucleus visualized in phase contrast microscopy (A) and iSCAT microscopy (B). The boundary of a nucleus is visible in the iSCAT image (D) as indicated by red arrowheads for visual guidance. Moreover, the fringe pattern in the middle of iSCAT image corresponds to a round nuclear structure shown in the phase contrast image (A). (B and E) Narrow filopodia around the cell boundary revealed in phase contrast microscopy (B) and iSCAT microscopy (E). Compared to the phase contrast image (B), the iSCAT image shows significantly higher optical contrast, clearly displaying fine branched structures of filopodia as well as a number of nano-sized debris spreading around one branch (E). (C and F) Flat and thin lamellipodium revealed in phase contrast microscopy (C) and iSCAT microscopy (F). Although the boundary is still identifiable due to slight but detectable optical contrast, the lamellipodium basically appears to be flat in the phase contrast image (C). On the contrary, the height variation of the upper cell membrane manifests itself by forming strong fringes in the iSCAT image (F). For example, a region of cell membrane has a sharp incline towards the middle of the cell between two yellow dotted lines, while the boundary area of the cell appears to be so flat that approximately one run of contrast variation (from dark to bright and vice versa) occurs in the iSCAT image over a large region of lamellipodium (F). The scale bar is 10 μm.
The benefit of iSCAT imaging becomes quite clear when it is directly compared with phase contrast images obtained near cell boundaries. While the morphologies of thin filopodia appear in poor contrast in phase contrast microscopy (Fig. 6B), one can see the fine structures of filopodia in iSCAT microscopy (Fig. 6E) with similar magnification. Furthermore, the iSCAT microscopy can capture the existence of nano-sized debris scattered near a branch of filopodia (yellow dotted circled area in Fig. 6E), which is almost invisible in the corresponding phase contrast image (Fig. 6B). Finally, the iSCAT microscopy gives detailed information about 3-dimensional architectural features near cell boundary structure via formation of strong fringes (Fig. 6F) while it appears to be flat and featureless in the phase contrast image (Fig. 6C).
To address the sensitivity of iSCAT technique in cell imaging, we performed the following experiments shown in Fig. 7. Up to now, the issue of sensitivity has been only addressed for nano-scatterers in a highly homogeneous medium. Therefore, for the first time, we tried to test the sensitivity of iSCAT technique in the context of cell imaging assay. To do this, we gradually increase the value of refractive index inside and outside the cell membrane up to that of cell membrane, n ∼ 1.50, by increasing the sucrose concentration in the sample chamber (from Fig. 7G–K, n ∼ 1.33, 1.36, 1.39, 1.43 and 1.46). From the raw image near cell boundary by iSCAT microscopy, a long extended filopodium was selected (black dotted boxed area in Fig. 7A). As shown in the cross-sectional profile of iSCAT signal taken from the dotted line drawn in Fig. 7B, a thin single filopodium is recognizable in an aqueous environment with refractive index as high as n ∼ 1.43 (Fig. 7J). Above this critical value of n, the iSCAT signal becomes undistinguishable from the environmental noise (Fig. 7K).
Fig. 7. Measurements of the sensitivity in iSCAT cell imaging: image contrast degrades with reduction of refractive index difference between a cell lipid membrane and intra- and extracellular media. (A) Typical iSCAT snapshot image obtained from a cell boundary area. (B–F) iSCAT images of a single filopodium marked by the black dotted-dash box in (A) for various values of the refractive index of the surrounding medium from n ∼ 1.33 to 1.46, and (G–K) iSCAT signal profiles taken along the white dotted line drawn in (B). Each profile is obtained from the corresponding image shown above. The dip marked by an arrow in each iSCAT image corresponds to the center line of a filopodium. Here, the refractive index in the surrounding medium was gradually increased by increasing the concentration of sucrose in the medium. From B to F (G to K), the value of n is 1.33, 1.36, 1.39, 1.43, and 1.46, respectively.

Conclusions
In summary, we investigated the intracellular structure of a living COS-7 cell, using iSCAT microscopy. Compared to RICM, the iSCAT technique revealed intracellular structures in a living cell more clearly due to its enhanced detection sensitivity by employing a coherent light source and utilizing interference. The strength of the technique is even more obvious when the iSCAT image was directly compared with phase contrast image taken for exactly the same cell. The raster scanning by a tightly focused beam makes the iSCAT imaging, which utilizes the effect of confocal imaging, most sensitive to refractive index variations near the surface, since its sensitivity decreases far away from the surface.
As a first application of iSCAT microscopy to cellular imaging, it would be important to understand the capability of iSCAT microscopy in comparison with other label-free nonlinear optical techniques such as second-harmonic generation and third-harmonic generation microscopy,42–45 or coherent Raman scattering microscopy.46–51 One of the greatest advantages in these techniques is their ability to directly prove a structural and molecular specificity at a subcellular resolution. On the contrary, iSCAT microscopy does not provide any chemical specificity/selectivity by itself because it is an optical detection that relies on collecting light scattered by a small object. On the other hand, as shown in our iSCAT cell imaging, the sensitivity of iSCAT is remarkable enough to detect very weak scattering signals, e.g., from very thin filopodia, or tiny changes in the value of refractive index in intrinsically scattering biomaterials such as the inside of cells.
Currently, we are applying an immunostaining technique to label specific target sites such as ER, Golgi apparatus, mitochondria, and focal adhesions to establish clear correspondence between intracellular organelles and specific fringe patterns observed in the in vitro interferometric scattering images of cells. Furthermore, we anticipate that the present method can be used to study long-term dynamics of endoplasmic membranes, which are highly dependent on their functional states, in real time.
Materials and methods
Cell preparation
The African green monkey kidney fibroblast-like cell lines (COS-7 cells, ATCC, CRL-1651) were plated in a 35 mm confocal dish (SPL, Korea) at a density of 3 × 10⁵ cells per dish and maintained at 37 °C in a humidified 5% CO2 and 95% air atmosphere in the growth medium of Dulbecco's modified Eagle's medium (DMEM, Invitrogen) supplemented with 10% fetal bovine serum (FBS, Gibco) and 1% penicillin/streptomycin (Gibco). After a 24 hour incubation, the confocal dish was equipped onto the X–Y stage for iSCAT live-cell imaging. For cell fixation, we used 4% paraformaldehyde (PFA) solution in 1X phosphate buffer solution (PBS). After removing the culture medium in a glass chamber where cultured COS-7 cells were grown, 4% PFA solution was injected to fix the cells. After incubation for 20 minutes at room temperature, it was washed three times with 1X PBS.
Escherichia coli (E. coli) OP50 was purchased from the Caenorhabditis genetic center (CGC, Univ. Minnesota). For an aseptic transfer, a single colony was obtained from a streak plate of Luria–Bertani (LB) agar [10 g Bacto-tryptone (BD), 5 g Bacto-yeast (BD), 5 g NaCl, 15 g Bacto-agar (BD), H2O to 1 liter, pH 7.5]. Then, it was mixed in the round-bottom tube (5 ml, BD Falcon) containing the autoclaved solution of 3 ml Luria broth [10 g Bacto-tryptone (BD), 5 g Bacto-yeast (BD), 5 g NaCl, H2O to 1 liter, pH 7.0 using 1 M NaOH] and incubated overnight in a rotary shaker (IST-3075R, Jeio Tech) at 200 rpm and 37 °C.
Budding yeast Saccharomyces cerevisiae (S. cerevisiae) from the Korean collection for type cultures (KCTC, Korea) were also incubated in the round-bottom tube containing the 3 ml glucose-peptone-yeast extract (GPY) solution [40 g glucose, 5.0 Bacto-peptone (BD), 5.0 Bacto-yeast (BD), H2O to 1 liter] at 200 rpm and 30 °C after obtaining a single colony from the streak plate of GPY agar [40 g glucose, 5 g Bacto-peptone (BD), 5 g Bacto-yeast (BD), 15 g Bacto-agar (BD) H2O to 1 liter].
Design of a cell chamber for iSCAT live-cell imaging
For iSCAT imaging of bacterial and yeast cells, a shallow glass chamber was made by sandwiching a slide glass (size: 76 × 26 mm, thickness: 1 mm, Marienfeld) and a cover glass (size: 25 × 25 mm, thickness: ∼0.13 mm, Fisher Scientific). Here, the cover-glass contacts immersion oil (ne = 1.518, Immersol 618F, Zeiss) dropped on the 100× objective lens. The thickness of the chamber was maintained by a double-sided tape (thickness: 0.089 mm, 3M Tape 665) sandwiched by the slide glass and cover-glass. To prevent leakage or evaporation of liquid in the chamber, the rim of the chamber was sealed by epoxy (standard 24 ml, Araldite) after injecting about 50 μl of solution containing the bacterial or yeast cells into the glass chamber. All data acquisitions took place at room temperature (23 °C). The refractive indices of a coverslip glass and DMEM buffer used in our experiments were 1.518 and 1.337, respectively.
iSCAT setup
The experimental setup of iSCAT microscopy (Fig. 2) is similar to the one previously developed by the Sandoghdar group.18 A diode laser (λ = 405 nm, iBEAM Smart-405-S-HP, Toptica Photonics, Germany) was used as a light source. After passing through a spatial filter (pinhole diameter: 30 μm, P30S, Thorlabs, USA) to remove the optical noise, the laser beam was divided by a 10 : 90 (R : T) cube beam splitter (BS025, Thorlabs, USA). Then, the beam was steered by two acousto-optic deflectors (AODs, DTSXY-400-405, AA opto-electronics, France) to raster-scan on the target area in the sample. The telecentric system with 1-inch focal length lenses (f = 500 mm, LA1908, Thorlabs, USA) images the deflection of the beam path caused by the AODs into the back focal plane (BFP) of a 100×, 1.49 NA oil immersion microscope objective (APON100XOTIRF, Olympus, Japan). The light reflected at the glass/buffer interface and the light scattered at the buffer/cell interface were collected by the same objective and focused onto a CMOS camera (MV-D1024E-160-CL-12, Photonfocus, Switzerland). The CMOS camera in our setup has 1024 × 1024 pixels and each pixel size is 10.6 μm. At this magnification, the full area of viewfield is 23 × 23 μm2. However, to avoid overlapping with ghost fields formed by unwanted reflections from the surfaces of the cube-type BS, the actual viewfield of real iSCAT image is reduced to 10 × 10 μm2 in 400 × 400 pixels with the effective pixel size of 25 nm (Fig. S1†). However, it should be noted that our small viewfield area is not a fundamental limit as shown by the Sandoghdar and Kukura groups. Rapid beam scanning is achieved by driving each of the AOD controllers (variable frequency driver, AA opto-electronics) with two-channel function generator (33600A, Keysight Tech. USA) using a triangle function (oscillating amplitude: 1.1 V, driving frequency: 83 and 79 kHz for the x and y channel). The output power of a laser (10 mW, 25 Hz) was measured by the photodiode detector (PDA-36, Thorlabs, USA) placed in the reflection side of the beam splitter located prior to the AODs, which converts the light intensity to the voltage signal. According to our measurement, the diameter of a beam focused in the image focal plane has about 900 nm (Fig. S2†). The confocal dishes and slide glass chambers prepared for iSCAT live-cell imaging were placed on the microscope stage and the beam scanning area was selected by two piezo translation stages in X–Y direction (RM21-AZ-AXY-RMS-M, Madcity Labs, USA) and Z direction (NFL5DP20/M, NanoFlex, Thorlabs, USA).
iSCAT image processing
In general, the background of a raw image captured by iSCAT microscopy is not uniform due to uneven illumination. To remove an uneven background of a single snapshot iSCAT image, first, the raw image (Fig. S3A†) was processed by 10 × 10 binning. Second, each signal over 10 × 10 bin in the raw image was replaced by the maximum value in each bin, and then it was further smoothened by Gaussian filtering to obtain the background image (Fig. S3B†). Finally, the background image was subtracted from the raw image (Fig. S3C†).
Author contributions
M. C. and S.-C. H. proposed the concept and designed the experiment. J.-S. P. prepared live cells. J.-S. P. and I.-B. L. contributed to this work equally. J.-S. P., I.-B. L., H.-M. M., J.-H. J., and K.-H. K. performed iSCAT imaging experiment. M. C. and J.-S. P. wrote the article and S.-C. H. contributed to the writing. M. C. led the project.
Conflicts of interest
The authors declare no competing financial interests.
Supplementary Material
Acknowledgments
This work was supported by IBS-R023-D1 and NRF-2016R1A2B4 014855 (S.-C. H.).
Footnotes
†Electronic supplementary information (ESI) available: Materials, detailed experimental protocols, supporting figures. See DOI: 10.1039/c7sc04733a
References
- Bottone M. G., Santin G., Aredia F., Bernocchi G., Pellicciari C., Scovassi A. I. Cells. 2013;2:294–305. doi: 10.3390/cells2020294. [DOI] [PMC free article] [PubMed] [Google Scholar]
- Voeltz G. K., Rolls M. M., Rapaport T. A. EMBO Rep. 2002;3:944–950. doi: 10.1093/embo-reports/kvf202. [DOI] [PMC free article] [PubMed] [Google Scholar]
- Tsolis R. M., Celli J. Nat. Rev. Microbiol. 2015;13:71–82. doi: 10.1038/nrmicro3393. [DOI] [PMC free article] [PubMed] [Google Scholar]
- McBride H. M., Neuspiel M., Wasiak S. Curr. Biol. 2006;16:R551–R560. doi: 10.1016/j.cub.2006.06.054. [DOI] [PubMed] [Google Scholar]
- Wilson S., Bacic A. Nat. Protoc. 2012;7:1716–1727. doi: 10.1038/nprot.2012.096. [DOI] [PubMed] [Google Scholar]
- Csordás G., Renken C., Várnai P., Walter L., Weaver D., Buttle K. F., Balla T., Mannella C. A., Hajnóczky G. J. Cell Sci. 2006;174:915–921. doi: 10.1083/jcb.200604016. [DOI] [PMC free article] [PubMed] [Google Scholar]
- Phillips M., Voeltz G. K. Nat. Rev. Microbiol. 2016;17:69–82. doi: 10.1038/nrm.2015.8. [DOI] [PMC free article] [PubMed] [Google Scholar]
- Friedman J. R., Lackner L. L., West M., DiBenedetto J. R., Nunnari J., Voeltz G. K. Science. 2011;334:358–362. doi: 10.1126/science.1207385. [DOI] [PMC free article] [PubMed] [Google Scholar]
- Long C., Friedman N., Xie X. S. Nature. 2006;440:358–362. doi: 10.1038/nature04599. [DOI] [PubMed] [Google Scholar]
- Rust M. J., Bates M., Zhuang X. Nat. Methods. 2006;3:793–796. doi: 10.1038/nmeth929. [DOI] [PMC free article] [PubMed] [Google Scholar]
- Elf J., Li G.-W., Xie X. S. Science. 2007;316:1191–1194. doi: 10.1126/science.1141967. [DOI] [PMC free article] [PubMed] [Google Scholar]
- Taniguchi Y., Choi P. J., Li G. W., Chen H., Babu M., Hearn J., Emili A., Xie X. S. Science. 2010;329:533–538. doi: 10.1126/science.1188308. [DOI] [PMC free article] [PubMed] [Google Scholar]
- Biteen J. S., Thompson M. A., Tselentis N. K., Bowman G. R., Shapiro L., Moerner W. E. Nat. Methods. 2008;5:947–949. doi: 10.1038/NMETH.1258. [DOI] [PMC free article] [PubMed] [Google Scholar]
- Welsher K., Yang H. Nat. Nanotechnol. 2014;9:198–203. doi: 10.1038/nnano.2014.12. [DOI] [PubMed] [Google Scholar]
- Emerson N. T., Hsia C.-H., Ralfalska-Metcalf U., Yang H. Nanoscale. 2014;6:4538–4543. doi: 10.1039/c3nr06468a. [DOI] [PubMed] [Google Scholar]
- Lindfors K., Kalkbrenner T., Stoller P., Sandoghbar V. Phys. Rev. Lett. 2004;93:037401. doi: 10.1103/PhysRevLett.93.037401. [DOI] [PubMed] [Google Scholar]
- Jacobsen V., Klotzsch E. and Sandoghdar V., Interferometric detection and tracking of nanoparticles, in Nano Biophotonics, ed. H. Masuhara, S. Kawata and F. Tokunaga, Elsevior, 2007, pp. 143–160. [Google Scholar]
- Kukura P., Ewers H., Müller C., Renn A., Helenius A., Sandoghdar V. Nat. Methods. 2009;6:923–927. doi: 10.1038/nmeth.1395. [DOI] [PubMed] [Google Scholar]
- Piliarik M., Sandoghdar V. Nat. Commun. 2014;5:4495. doi: 10.1038/ncomms5495. [DOI] [PubMed] [Google Scholar]
- Curtis A. S. J. Cell Biol. 1964;20:199–215. doi: 10.1083/jcb.20.2.199. [DOI] [PMC free article] [PubMed] [Google Scholar]
- Ploem J. S., Reflection-Contrast microscopy as a tool for investigation of the attachment of living cells to a glass surface, Blackwell, Oxford, 1975. [Google Scholar]
- Limozin L., Sengupta K. ChemPhysChem. 2009;10:2752–2768. doi: 10.1002/cphc.200900601. [DOI] [PubMed] [Google Scholar]
- Kovari D. T. Biophys. J. 2016;111:2698–2710. doi: 10.1016/j.bpj.2016.11.009. [DOI] [PMC free article] [PubMed] [Google Scholar]
- Rädler J., Sackmann E. J. Phys. II. 1993;3:727–748. [Google Scholar]
- Schilling J., Senqupta K., Goennenwein S., Bausch A. R., Sackmann E. Phys. Rev. E: Stat., Nonlinear, Soft Matter Phys. 2004;69:021901. doi: 10.1103/PhysRevE.69.021901. [DOI] [PubMed] [Google Scholar]
- Contreras-Naranjo J., Ugaz V. A. Nat. Commun. 2013;4:1919. doi: 10.1038/ncomms2865. [DOI] [PMC free article] [PubMed] [Google Scholar]
- Andrecka J., Arroyo J. O., Takagi Y., de Wit B., Fineberg A., Mackinnon L., Young G., Sellers J. R., Kukura P. eLife. 2015;4:e05413. doi: 10.7554/eLife.05413. [DOI] [PMC free article] [PubMed] [Google Scholar]
- Arroyo J. O., Cole D., Kukura P. Nat. Protoc. 2016;11:617–633. doi: 10.1038/nprot.2016.022. [DOI] [PubMed] [Google Scholar]
- Hsieh C.-L., Spindler S., Ehrig J., Sandoghdar V. J. Phys. Chem. B. 2014;118:1545–1554. doi: 10.1021/jp412203t. [DOI] [PubMed] [Google Scholar]
- Spillane K. M., Arroyo J. O., de Wit G., Eggeling C., Ewers H., Wallace M. I., Kukura P. Nano Lett. 2014;14:5390–5397. doi: 10.1021/nl502536u. [DOI] [PMC free article] [PubMed] [Google Scholar]
- Liebel M., Hugall J. T., van Hulst N. F. Nano Lett. 2017;17:1277–1281. doi: 10.1021/acs.nanolett.6b05040. [DOI] [PubMed] [Google Scholar]
- Huang Y.-F., Zhuo G.-Y., Chou C.-Y., Lin C.-H., Hsieh C.-L. Nanoscale. 2017;9:6567–6574. doi: 10.1039/c7nr00604g. [DOI] [PubMed] [Google Scholar]
- Huang Y.-F., Zhuo G.-Y., Chou C.-Y., Lin C.-H., Chang W., Hsieh C.-L. ACS Nano. 2017;11:2575–2585. doi: 10.1021/acsnano.6b05601. [DOI] [PubMed] [Google Scholar]
- Hategan A., Sengupta K., Kahn S., Sackmann E., Discher D. E. Biophys. J. 2004;87:3547–3560. doi: 10.1529/biophysj.104.041475. [DOI] [PMC free article] [PubMed] [Google Scholar]
- Choi W., Fang-Yen C., Badizadegan K., Oh S., Lue N., Dasari R. R., Feld M. S. Nat. Methods. 2007;4:717–719. doi: 10.1038/nmeth1078. [DOI] [PubMed] [Google Scholar]
- Park Y., Diez-Silva M., Popescu G., Lykotrafitis G., Choi W., Feld M. S., Suresh S. Proc. Natl. Acad. Sci. U. S. A. 2008;105:13730–13735. doi: 10.1073/pnas.0806100105. [DOI] [PMC free article] [PubMed] [Google Scholar]
- Shan M., Kandel M. E., Popescu G. Opt. Express. 2017;25:1573–1581. doi: 10.1364/OE.25.001573. [DOI] [PubMed] [Google Scholar]
- Haseda K., Kanematsu K., Noguchi K., Saito H., Umeda N., Ohta Y. Biomed. Opt. Express. 2015;6:859–869. doi: 10.1364/BOE.6.000859. [DOI] [PMC free article] [PubMed] [Google Scholar]
- Liu P. Y., Chin L. K., Ser W., Chen H. F., Hsieh C. M., Lee C. H., Sung K. B., Ayi T. C., Yap P. H., Liedberg B., Wang K., Bourouina T., Leprince-Wang Y. Lab Chip. 2016;16:634–644. doi: 10.1039/c5lc01445j. [DOI] [PubMed] [Google Scholar]
- Kornberg A. J. Bacteriol. 1995;177:491–496. doi: 10.1128/jb.177.3.491-496.1995. [DOI] [PMC free article] [PubMed] [Google Scholar]
- Puchkov E. O. Yeast. 2010;27:309–315. doi: 10.1002/yea.1754. [DOI] [PubMed] [Google Scholar]
- Campagnola P. J., Millard A. C., Terasaki M., Hoppe P. E., Malone C. J., Mohler W. A. Biophys. J. 2002;81:493–508. doi: 10.1016/S0006-3495(02)75414-3. [DOI] [PMC free article] [PubMed] [Google Scholar]
- Chen X., Nadiarynkh O., Plotnikov S., Campagnola P. J. Nat. Protoc. 2012;7:654–669. doi: 10.1038/nprot.2012.009. [DOI] [PMC free article] [PubMed] [Google Scholar]
- Smith D. R., Winters D. G., Bartels R. A. Proc. Natl. Acad. Sci. U. S. A. 2013;10:18391–18396. doi: 10.1073/pnas.1306856110. [DOI] [PMC free article] [PubMed] [Google Scholar]
- Weigelin B., Bakker G.-J., Friedl P. J. Cell Sci. 2016;129:245–255. doi: 10.1242/jcs.152272. [DOI] [PubMed] [Google Scholar]
- Evans C. L., Potma E. O., Puoris'haag M., Côté D., Lin C. P., Xie X. S. Proc. Natl. Acad. Sci. U. S. A. 2005;102:16807–16812. doi: 10.1073/pnas.0508282102. [DOI] [PMC free article] [PubMed] [Google Scholar]
- Pezacki J. P., Blake J. A., Danielson D. C., Kennedy D. C., Lyn R. K., Singaravelu R. Nat. Chem. Biol. 2011;7:137–145. doi: 10.1038/nchembio.525. [DOI] [PMC free article] [PubMed] [Google Scholar]
- Nan X., Cheng J.-X., Xie X. S. J. Lipid Res. 2003;44:2202–2208. doi: 10.1194/jlr.D300022-JLR200. [DOI] [PubMed] [Google Scholar]
- Evans C. L., Xie X. S. Annu. Rev. Anal. Chem. 2008;1:883–909. doi: 10.1146/annurev.anchem.1.031207.112754. [DOI] [PubMed] [Google Scholar]
- Nan X., Potma E. O., Xie X. S. Biophys. J. 2006;91:728–735. doi: 10.1529/biophysj.105.074534. [DOI] [PMC free article] [PubMed] [Google Scholar]
- Jungst C., Winterhalder M. J., Zumbusch A. J. Biophotonics. 2011;4:435–441. doi: 10.1002/jbio.201000120. [DOI] [PubMed] [Google Scholar]
Associated Data
This section collects any data citations, data availability statements, or supplementary materials included in this article.


