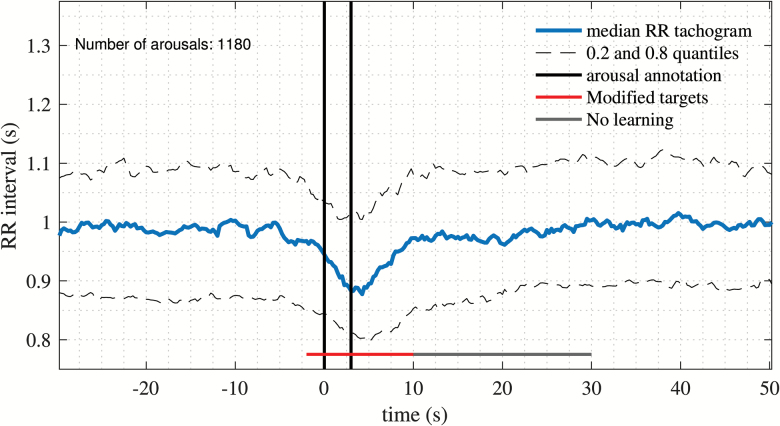
Figure 3.
RR tachogram at time-locked arousals. Median, 0.2 and 0.8 quantiles of RR tachogram time-locked to annotated arousals from 12 randomly selected participants, comprising 1180 arousal events. The targets used for the loss function are indicated with a red line and has a 15 s duration, followed by a 20 s window not included to update the loss function in order to prevent overpenalization of the model.

