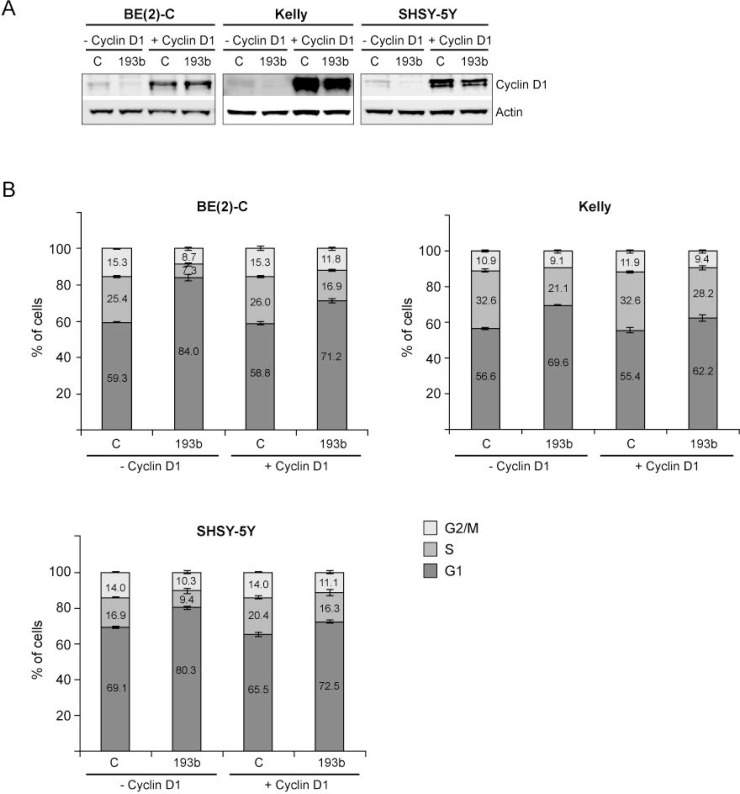
Figure 9. Cyclin D1 overexpression rescues neuroblastoma cells from miR-193b-induced G1 cell cycle arrest.
Cells were co-transfected with control or miR-193b mimics and an empty (− Cyclin D1) or a Cyclin D1 (+ Cyclin D1) overexpression plasmid. 24 hours after transfection, cells were harvested for Western blot analysis to show Cyclin D1 overexpression (A) or cells were fixed with ethanol and cell-cycle profiles were determined by propidium iodide incorporation and flow cytometry analysis (B). Results from cell cycle analysis are presented as percentage of cells in a particular phase. Cell cycle data are mean ± SD of one representative experiment of at least two, each performed in triplicate. Western blot data show one representative experiment. Actin was used to demonstrate equal protein loading.

