Abstract
Background: One of the most critical threats to the validity of any longitudinal research is the bias caused by study attrition. Prevention efforts should be focused on those individuals at high risk of non-participation to improve the generalizability of study findings. Objective: To identify demographic and clinical factors associated with loss to follow-up (FU) at post-injury years 1 to 35 among 25,871 people with spinal cord injury (SCI) enrolled in the National Spinal Cord Injury Database. Methods: Loss to FU was defined as no research information obtained from participants who were eligible for the planned data collection. Generalized linear mixed models were used for analysis of factors at each post-injury year. Results: The loss to FU rates were 23.1% and 32.9% for post-injury years 1 and 5, respectively, and remained >40% between post-injury years 20 and 35. The FU rate varied by study sites and was improved in recent injury cohorts. People who were more seriously injured and those who attained higher levels of education were more likely to return for FU than their counterparts. People who were at risk of being marginalized in society (non-whites, those with less education, the unemployed, victims of violence, and those with no health insurance) had the highest odds of being lost to FU across all post-injury years. Conclusion: These findings can be used to identify individuals who are less likely to participate in follow-up, which may allow targeted attention to improve their response rate.
Keywords: missing data, spinal cord injuries, study retention
One of the most critical threats to the validity of longitudinal research is the bias caused by study attrition.1 Loss to follow-up (FU) seems to be inevitable and usually depends on the length of FU and the complexity of the study protocol.2,3 To improve the generalizability of study findings and better inform the public, it is crucial to know what potential sources of bias and imprecision might be present in a dataset with incomplete FU.4–7 If the loss to FU is predictable, prevention efforts can be focused on those individuals at high risk of non-participation.2,3,8–11
The Spinal Cord Injury Model Systems (SCIMS) program is a collection of rehabilitation facilities throughout the United States that provide continuous, comprehensive, multidisciplinary care for persons with spinal cord injury (SCI).12 These federally designated SCIMS centers also conduct research of the natural course after SCI by contributing longitudinal data to the National SCI Database (NSCID) that captures about 6% of new SCI cases in the United States. Since the early 1970s, the NSCID has been following study participants at post-injury years 1 and 5, and then every 5 years thereafter. FU data collection is primarily conducted by telephone interview, but it may also be conducted by face-to-face interviews in the clinic, mailed questionnaires, or a combination of methods. Data from the NSCID have produced numerous publications that help inform injury prevention, clinical research, clinical practices, and health care policy.12
Like most longitudinal studies, the NSCID has an issue with study attrition through the post-injury years. Few studies, however, have investigated loss to FU exclusively within the SCIMS program. One such report, published in 1995, compared patients who returned for FU data collection at post-injury years 1, 5, and 10 with those who did not.8 Another study analyzed data from four SCIMS centers that were continuously funded during 1979 to 2006 and provided meaningful characteristics of people lost to FU through post-injury year 10.9 Both studies found that those who were not married, not employed, self-responsible for medical expenses, and rated as having less severe injury were more likely to be lost.
As the demographics of SCI have changed in recent years13 and the NSCID now contains more years of FU, this study was conducted to identify factors associated with loss to FU through post-injury year 35 by analyzing data from all 28 SCIMS centers that had ever contributed data to the NSCID by March 2015. The goal of this study was to improve our ability to draw valid conclusions from longitudinal research, particularly regarding long-term outcomes and survival, by identifying mechanisms for reducing study attrition.
Methods
Study participants
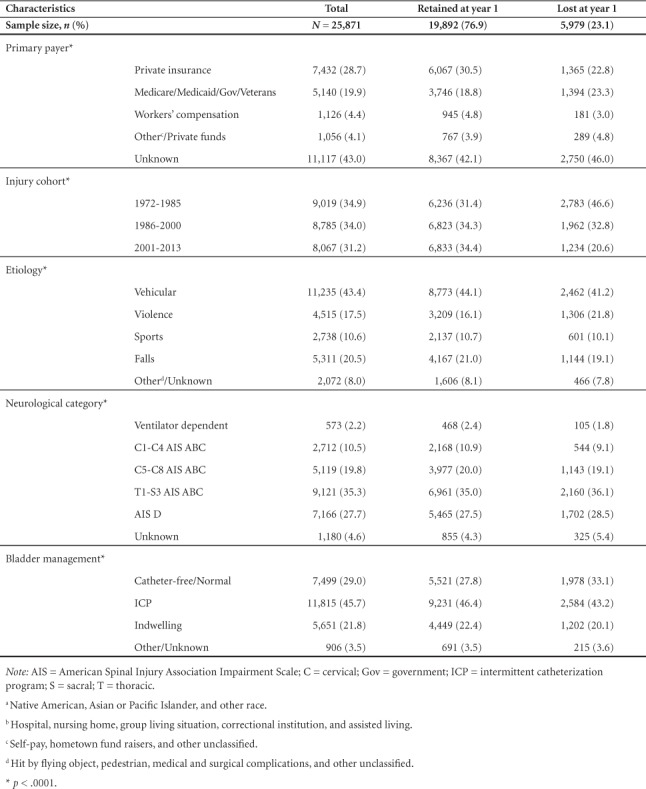
This study began with 25,871 NSCID participants who were eligible for post-injury year 1 FU during the study period. They incurred an SCI between 1972 and 2013, did not gain neurological recovery at discharge from the initial hospitalization, survived the first year of injury, and were discharged from the initial hospitalization by the first anniversary of the injury. We also excluded from analysis people who failed to participate for logistic reasons, including death or incarceration during the data collection window, withdrawal of consent, loss of identity due to breaks in funding, and loss of funding by SCIMS centers. Details regarding breaks in funding and loss of funding were described previously by Chen et al.12 At each post-injury year, the eligibility status of participants for the planned FU data collection was assessed. Loss to FU was defined as having no research information obtained from participants who were eligible for FU. Table 1 shows the characteristics of the participants, overall and by FU status at post-injury year 1.
Table 1.
Characteristics of study participants during initial hospital care
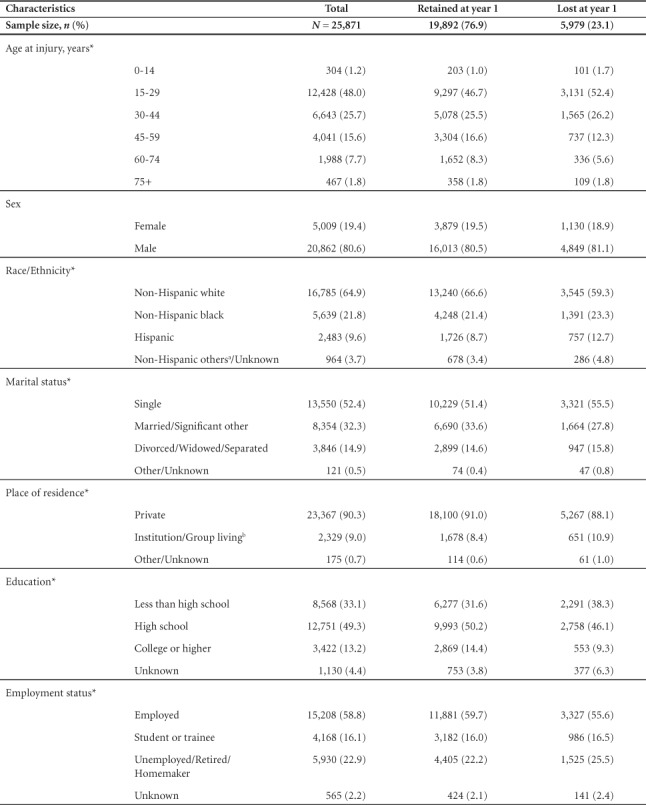
Table 1.
Characteristics of study participants during initial hospital care (CONT.)
Variables
Variables selected for data analyses were based on findings from previous studies.3,5–9,11 Neurological examinations were performed within 7 days of discharge in accordance with the version of the International Standards for Neurological Classification of Spinal Cord Injury (ISNCSCI) that was in use at the time the examinations were performed.14 Ventilator dependency was defined as requiring either partial or total respiratory support (including electrophrenic pacers) on a daily basis. For analysis, ventilator-free participants were further grouped into one of four neurological categories according to the American Spinal Injury Association Impairment Scale (AIS) or Frankel's classification scale15: high tetraplegia with AIS/Frankel A, B, or C (C1-C4 ABC); low tetraplegia with AIS/Frankel A, B, or C (C5-C8 ABC); paraplegia with AIS/Frankel A, B, or C (T1-S3 ABC); and AIS/Frankel D (AIS D), regardless of injury level. Based on the year of injury, three injury cohorts were defined with the intention of having similar duration: 1972–1985, 1986–2000, and 2001–2013.
Demographic characteristics (sex, race/ethnicity), injury year, etiology, and neurological categories were obtained during initial hospital care. Participant status that tends to change over time was updated at each FU survey, including current age, marital status, place of residence, education, employment, primary payer, and bladder management. To account for the skewed distribution of age in the SCI population, categorical age groups were used in data analysis.16 To facilitate interpretation of study results and to address the need for sufficient sample size in statistical models, similar groups within categorical predictors were aggregated as shown in Table 1. A large amount of primary payer data is missing because this information was not collected from 2006 to 2011.
Statistical analysis
Chi-square tests were used to compare categorical variables between groups. It was suspected that the 28 SCIMS centers had non-negligible effects on the probability of loss to FU.17 To account for this hierarchical structure, the SCIMS centers were considered as a random effect in the generalized linear mixed models (GLMM) for the binary outcomes of FU status at each post-injury year.18 The multivariable GLMM included time-varying information obtained at the interview prior to the current survey and time-invariant information obtained during initial hospital care. All analyses were conducted using SAS 9.4 (SAS Institute, Cary, NC). Statistical significance of predictors was assessed at significance levels of .05 and .01.
To translate a complex model into a user-friendly graph, the nomogram that estimates the risk of loss to FU based on participant characteristics was generated from a generalized linear model using the rms R package.19 The nomogram was created specifically for each post-injury year. One example of the online dynamic nomogram, created by the DynNom R package,20 was also built on Shiny R server for demonstration.
Results
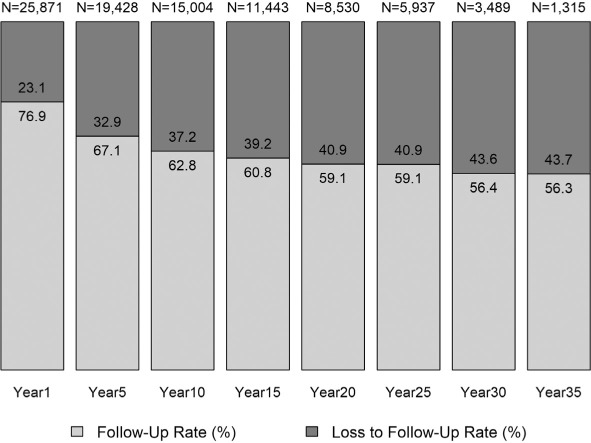
As shown in Figure 1, the loss to FU rate increased from post-injury year 1 to year 5 (23.1% and 32.9%, respectively) and stayed above 40% at post-injury year 20 and beyond.
Figure 1.
Follow-up status by post-injury year.
Table 1 shows the demographic and injury factors at discharge according to FU status at post-injury year 1. Because of the large sample size, all comparisons were significant (p < .05) except by sex. The multivariable GLMM analysis showed SCIMS centers had a significantly non-zero variance for post-injury year 1 FU (σˆa = 0.4349, p = .0009) through post-injury year 30 FU (σˆa = 0.4405, p = .0235), indicating that SCIMS centers explain an important amount of the total variance of loss to FU. Eleven centers that provided data for post-injury year 35 did not show significant variability in study attrition for post-injury year 35 FU (σˆa = 0.1866, p = .0656).
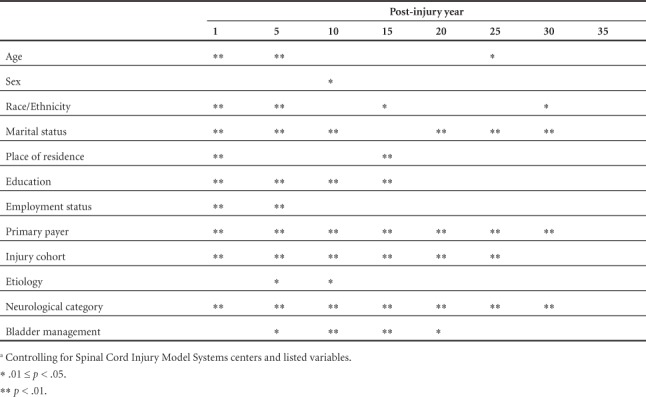
Table 2 provides a quick high-level summary of variables significantly associated with loss to FU over time. Marital status, primary payer, neurological category, and injury cohort were significantly associated with loss to FU for most post-injury years. Sex, employment, and injury etiology were significant during the early years of FU. None of the factors reached statistical significance at post-injury year 35.
Table 2.
Significance of demographic and injury factors associated with loss to follow-up: Results from the multivariable model for each post-injury year a
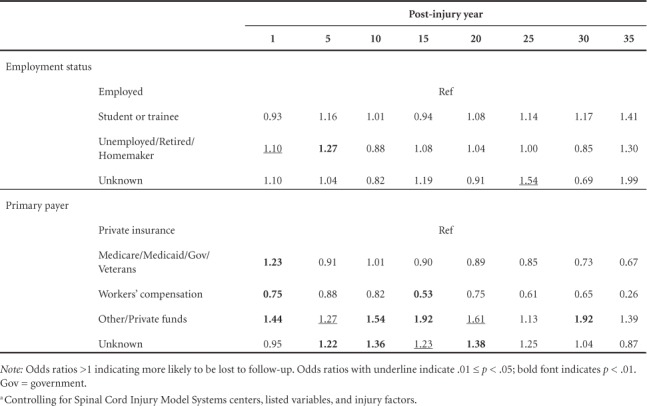
Tables 3 and 4 provide further detail about the effects of demographic and injury factors, respectively, on loss to FU. The confidence intervals corresponding to each odds ratio estimate were depicted in supplementary digital content (eTables 1 and 2). As shown in the Table 3 and eTable 1, people of racial minorities were more likely to be lost to FU than were non-Hispanic whites. The odds of being lost were also higher among people who were not married, were institutionalized or in group living situations, and were unemployed. Those of older age, higher education level, and with workers' compensation sponsorship were less likely to be lost.
Table 3.
Odds ratios of being lost to follow-up – demographic factors: Results from the multivariable model for each post-injury year a
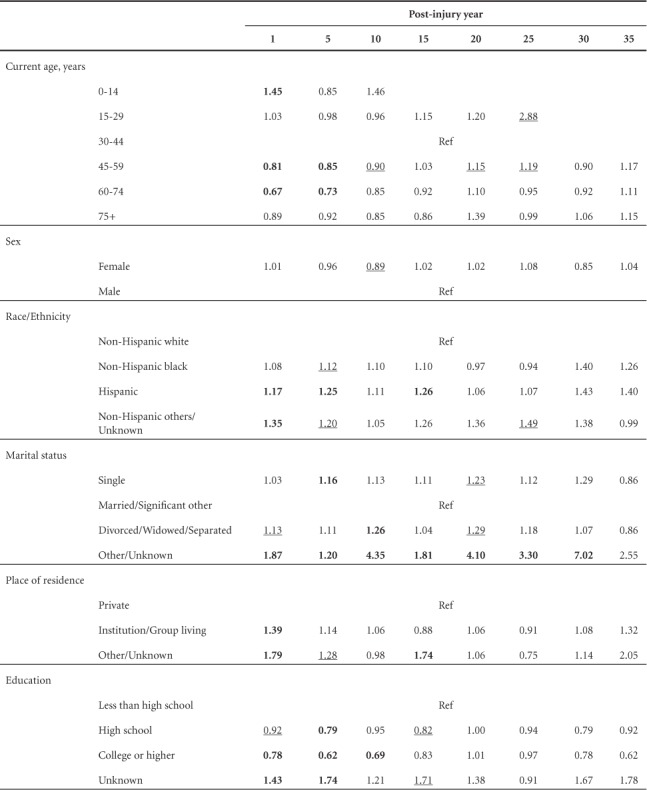
Table 4.
Odds ratios of being loss to follow-up – injury factors: Results from the multivariable model for each post-injury year a
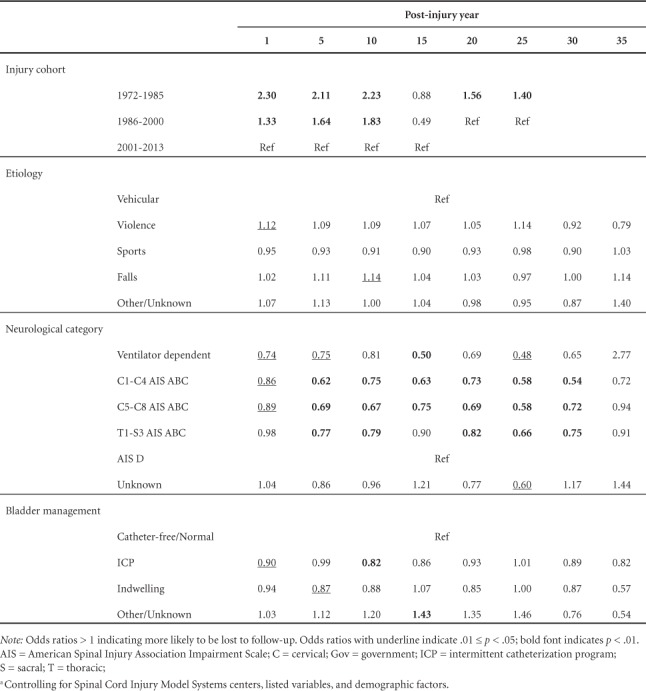
Table 3.
Odds ratios of being lost to follow-up – demographic factors: Results from the multivariable model for each post-injury year a (CONT.)
Cohort, etiology, and medical complications also affected loss to FU (Table 4 and eTable 2). When analyzed as groups, the early injury cohort (1972–1985) had a higher risk of loss to FU than did the recent cohort (2001–2013). The odds of being lost are lower for those with more severe injury. Compared with people with normal bladder function and/or free of catheterization, those who required a special method of bladder management were less likely to be lost. Among all lost participants, the proportion of those previously lost to FU was substantial, ranging from 43.2% at post-injury year 5 to 73.1% at post-injury year 25 (Table 5).
Table 5.
Number of participants who did not return after one or more breaks at each post-injury year
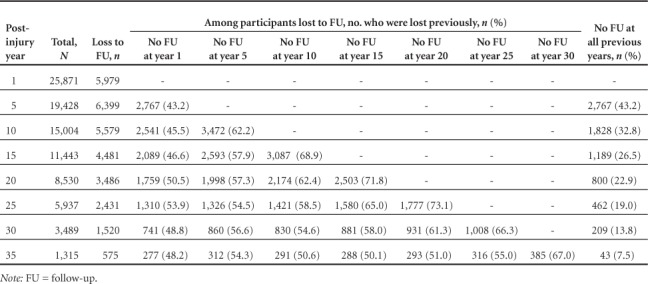
Figure 2 provides an example of a nomogram for post-injury year 1. To find the risk of loss to FU, mark each variable line based on participant characteristics and find the corresponding point at the top. Compute the total points by summing up all the points assigned to each variable. Finally, mark the total points line at the bottom and find the corresponding risk of loss to FU. An interactive online nomogram for Figure 2 is available for hands-on exercise at https://hwasoonkim.shinyapps.io/DynNomapp/.
Figure 2.
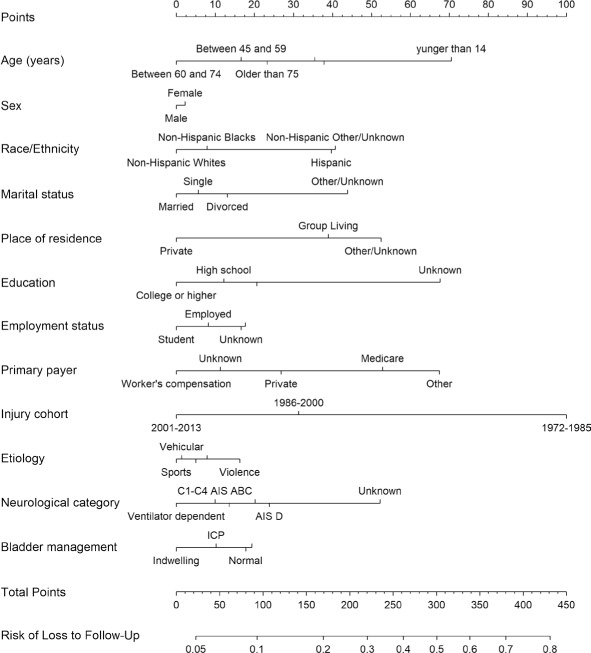
Example of the nomogram: risk of loss to follow-up at post-injury year 1.
Discussion
In this largest and longest FU study of 25,871 persons with SCI enrolled in the NSCID, we identified demographic and injury characteristics of people lost to the system through 35 years of FU. Our findings of a significant association between socioeconomic disadvantage and overall participant retention agree with previous studies of a smaller sample size and shorter duration of FU in the general population3 and in special populations.5–9,11
People who are at risk of being marginalized in society (non-whites, those with less education, the unemployed, victims of violence, and those with no health insurance) tend to be mobile or transient in their locations. For instance, these factors may be associated with moving to find jobs and/or housing and therefore with changing contact information. As a result, these individuals may be more difficult to locate for FU data collection, which coincides with the most common reason for loss to FU among NSCID participants being “unable to contact study participants.”17 It is critical for longitudinal studies to invest time and efforts to keep these disadvantaged groups engaged, as they have been historically underrepresented in research.
People with more severe injury and neurogenic bladder dysfunction are more likely to return to the SCIMS centers for medical care throughout their lifetime, which eases the logistics of research data collection and improves the FU rate among these individuals. The positive relationship between injury severity and study retention is also supported by a previous study conducted in the Traumatic Brain Injury Model Systems.5 Similarly, those with private insurance or workers' compensation sponsorship tend to have better access to health care and with more contacts with the system are less likely to be lost to FU. Although government insurance was not statistically significant after post-injury year 1, we noticed that the direction of odds ratio of government benefit to private insurance reversed and this might be due to larger numbers of people receiving public benefits in later years.
We also noted the variability of FU rate across SCIMS centers, which indicates a critical role that the system can have in study retention through such interventions as support from the leadership, resources devoted to FU, clinical integration of research FU, and an effective FU tracking system. The improvement of study retention in recent decades also emphasizes the importance of institutional priority and supports, increased attention to the longitudinal nature of the now established program, and increasing enforcement of data quality by the funding agency (National Institute of Disability, Independent Living, and Rehabilitation Research). Nevertheless, there are other unmeasured factors that might affect the differences in study retention across SCIMS centers, such as geographic variation in environmental factors and demographic composition of population, which highlights the importance of a study retention plan specifically tailored to the data collection site.
Various strategies for study retention have been recommended21 and some have been adopted by the SCIMS program.22 The emphasis of these strategies is that FU should start at study entry by building rapport with study participants, recording as much contact information as possible, and other similar mechanisms. It is more difficult to relocate lost participants than to retain participants from the start.
Overall, there seem to be two unique groups of people with SCI that require additional attention and efforts for study retention. Those with less severe SCI should be reassured that their contribution to a longitudinal study is highly valuable and should be provided with incentives to stay in contact, as possible. Sites should potentially contact these individuals more often and provide information to reinforce the value of the longitudinal program. People with disadvantaged socioeconomic status are lost to FU for different reasons, such as the lack of valid contact information. These individuals may also need to be contacted more frequently between the planned FU data collection points and may require additional assistance in attending the FU visit. Getting family members involved might also facilitate participant retention, as suggested by the findings of this and other studies that those living with a spouse or significant other were less likely to be lost.3 Sites might need to provide feedback on the program to reinforce why this program is worthy of their participation and how it serves them, even if less severely injured. Interest in mobile technology use and health has soared recently in public health23,24 and in SCI research.25–27 Therefore, the use of mobile phone text messaging to promote study retention deserves further investigation.
Our study findings can be presented in a nomogram, showing the risk score of each participant characteristic in predicting loss to FU. Nomograms are a good tool for translating a complex model into a user-friendly graph,28–30 which can be used to alert researchers to the risk of loss while enrolling study participants and collecting FU data.
Limitations
As study participants were recruited from SCIMS centers, but not from a population-based sample, the study findings may not be generalizable to all people with SCI in the United States. Deaths and other technical reasons for non-participation (eg, incarceration, breaks in funding, and study withdrawal) were excluded from data analysis. As a result, our study is limited in terms of providing a complete picture of study attrition or in assessing the bias due to study attrition of any cause. Other important factors are potentially associated with participant retention, as well, such as data collection practices, retention strategies, interviewers' skills, and participant's burden and incentives. Due to constraints associated with the NSCID design, this study was not able to examine these factors. Our data contain multiple observations over multiple time points for the same subjects, and time-series or panel data analyses might be used to add more inferences.
Conclusion
The present study provides evidence that highlights the importance of incorporating strategies to maximize FU participation from initial enrollment in the NSCID. Important demographic and injury characteristics associated with loss to FU can be obtained at study entry. These individuals can then be targeted for strategies to maintain their participation at FU. These approaches should be targeted based upon the specific risk factors exhibited by participants. Furthermore, this study provides evidence that centers differ in retention, but that overall retention has increased over time, suggesting that improvements can be made. Because it is easier to retain participants than to relocate them once they have been lost to FU and because reducing attrition strengthens the value of longitudinal data, it is critical to develop and validate effective interventions to ensure participant retention.
Supplementary Material
Acknowledgments
The authors have no conflicts of interest. Institutional Review Board approval was obtained at the National Spinal Cord Injury Statistical Center as well as locally at each Spinal Cord Injury Model Systems center. This work is supported by funding from the National Institutes on Disability, Independent Living, and Rehabilitation Research (NIDILRR 90DP0083). NIDILRR is a Center within the Administration for Community Living (ACL), Department of Health and Human Services (HHS). The contents of this article do not necessarily represent the policy of NIDILRR, ACL, and HHS, and you should not assume endorsement by the Federal Government.
REFERENCES
- 1. Greenland S. Response and follow-up bias in cohort studies. Am J Epidemiol. 1977; 106 3: 184– 187. [DOI] [PubMed] [Google Scholar]
- 2. Kristman V, Manno M, Côté P.. Loss to follow-up in cohort studies: How much is too much? Eur J Epidemiol. 2004; 19 8: 751– 760. [DOI] [PubMed] [Google Scholar]
- 3. Bambs C, Kip K, Mulukutla S, . et al. Sociodemographic, clinical, and psychological factors associated with attrition in a prospective study of cardiovascular prevention: The Heart Strategies Concentrating on Risk Evaluation study. Ann Epidemiol. 2013; 23 6: 328– 333. [DOI] [PMC free article] [PubMed] [Google Scholar]
- 4. Hedden S, Woolson R, Carter R, Palesch Y, Upadhyaya H, Malcolm R.. The impact of loss to follow-up on hypothesis tests of the treatment effect for several statistical methods in substance abuse clinical trials. J Subst Abuse Treat. 2009; 37 1: 54– 63. [DOI] [PMC free article] [PubMed] [Google Scholar]
- 5. Corrigan J, Harrison-Felix C, Bogner J, Dijkers M, Terrill M, Whiteneck G.. Systematic bias in traumatic brain injury outcome studies because of loss to follow-up. Arch Phys Med Rehabil. 2003; 84 2: 153– 160. [DOI] [PubMed] [Google Scholar]
- 6. Holavanahalli R, Lezotte D, Hayes M, . et al. Profile of patients lost to follow-up in the burn injury rehabilitation model systems' longitudinal database. J Burn Care Res. 2006; 27 5: 703– 712. [DOI] [PubMed] [Google Scholar]
- 7. de Groot S, Haisma H, Post M, van Asbeck F, van der Woude L.. Investigation of bias due to loss of participants in a Dutch multicenter prospective spinal cord injury cohort study. J Rehabil Med. 2009; 31 5: 382– 389. [DOI] [PubMed] [Google Scholar]
- 8. Richards J, Go B, Rutt R, Lazarus P.. The National Spinal Cord Injury Collaborative Database. : Stover S, DeLisa J, Whiteneck G, . Spinal Cord Injury: Clinical. Outcomes from Model System. Gaithersburg, MD: Aspen Publishers Inc.; 1995: 10– 20. [Google Scholar]
- 9. Lin H, Chen Y, DeVivo M.. Poster 26: Loss to follow-up rates and characteristics in the spinal cord injury model systems database. Arch Phys Med Rehabil. 2007; 88: e13. [Google Scholar]
- 10. Park M, Yamazaki Y, Yonekura Y, . et al. Predicting complete loss to follow-up after a health-education program: Number of absences and face-to-face contact with a researcher. BMC Med Res Methodol. 2011; 11: 145. [DOI] [PMC free article] [PubMed] [Google Scholar]
- 11. Krellman J, Kolakowsky-Hayner S, Spielman L, . et al. Predictors of follow-up completeness in longitudinal research on traumatic brain injury: Findings from the national institute on disability and rehabilitation research traumatic brain injury model systems program. Arch Phys Med Rehabil. 2014; 95 4: 633– 641. [DOI] [PubMed] [Google Scholar]
- 12. Chen Y, DeVivo M, Richards J, SanAgustin T.. Spinal Cord Injury Model Systems: Review of program and national database from 1970 to 2015. Arch Phys Med Rehabil. 2016; 97 10: 1797– 1804. [DOI] [PubMed] [Google Scholar]
- 13. Chen Y, He Y, DeVivo M.. Changing demographics and injury profile of new traumatic spinal cord injuries in the United States, 1972–2014. Arch Phys Med Rehabil. 2016; 97 10: 1610– 1619. [DOI] [PubMed] [Google Scholar]
- 14. Kirshblum S, Burns S, Biering-Sorensen F, . et al. International Standards for Neurological Classification of Spinal Cord Injury (revised 2011). J Spinal Cord Med. 2011; 34 6: 535– 546. [DOI] [PMC free article] [PubMed] [Google Scholar]
- 15. Frankel H, Hancock D, Hyslop G, . et al. The value of postural reduction in the initial management of closed injuries of the spine with paraplegia and tetraplegia. I. Paraplegia. 1969; 7 3: 179– 192. [DOI] [PubMed] [Google Scholar]
- 16. Biering-Sorensen F, DeVivo MJ, Charlifue S, . et al. International Spinal Cord Injury Core Data Set (version 2.0)–including standardization of reporting. Spinal Cord. 2017; 55 8: 759– 764. [DOI] [PubMed] [Google Scholar]
- 17. National Spinal Cord Injury Statistical Center. . 2016 Annual Statistical Report for the Spinal Cord Injury Model Systems public version. Birmingham, AL; University of Alabama at Birmingham: Birmingham, Alabama. https://www.nscisc.uab.edu. Accessed December 2016. [Google Scholar]
- 18. Agresti A. An Introduction to Categorical Data Analysis. New York: John Wiley & Sons, Inc.; 2007. [Google Scholar]
- 19. Harrell FE., Jr. Regression modeling strategies. https://cran.r-project.org/web/packages/rms/rms.pdf. Accessed January 10, 2018.
- 20. Jalali A, Roshan D, Alvarez-Iglesias A, Newell J.. Dynamic nomograms for linear, generalized linear and proportional hazard models. https://cran.r-project.org/web/packages/DynNom/DynNom.pdf. Accessed January 10, 2018.
- 21. Hunt J, White E.. Retaining and tracking cohort study members. Epidemiol Rev. 1998; 20 1: 57– 70. [DOI] [PubMed] [Google Scholar]
- 22. National Spinal Cord Injury Statistical Center. . Standard operating procedures and policies of the Spinal Cord Injury Model Systems. October 1, 2016–September 30, 2021. Published April 2017.
- 23. Safreed-Harmon K. Mobile technologies playing a growing role in HIV care and treatment support. 2012. http://www.aidsmap.com/Mobile-technologies-playing-a-growing-role-in-HIV-care-and-treatment-support/page/2454372/. Accessed August 10, 2017.
- 24. Horvath T, Azman H, Kennedey G, Rutherford G.. Mobile phone text messaging for promoting adherence to antiretroviral therapy in patients with HIV infection [review]. Cochrane Database Syst Rev. 2012; 14 3: CD009756. [DOI] [PMC free article] [PubMed] [Google Scholar]
- 25. Goodman N, Jette A, Houlihan B, Williams S.. Computer and internet use by persons after traumatic spinal cord injury. Arch Phys Med Rehabil. 2008; 89 8: 1492– 1498. [DOI] [PubMed] [Google Scholar]
- 26. Roach M, Harrington A, Powell H, Nemunaitis G.. Cell telephone ownership and social integration in persons with spinal cord injury. Arch Phys Med Rehabil. 2011; 92 3: 472– 476. [DOI] [PubMed] [Google Scholar]
- 27. Drainoni M-L, Houlihan B, Williams S, . et al. Patterns of internet use by persons with spinal cord injuries and relationship to health-related quality of life. Arch Phys Med Rehabil. 2004; 85 11: 1872– 1879. [DOI] [PubMed] [Google Scholar]
- 28. Lubelski D, Derakhshan A, Wang ANJ, Steinmetz M, Benzel E, Mroz T.. Predicting C5 palsy via the use of preoperative anatomic measurements. Spine J. 2014; 14 9: 1895– 1901. [DOI] [PubMed] [Google Scholar]
- 29. Pereira P, McLaughlin L, Janssen S, . et al. The SORG nomogram accurately predicts 3- and 12- months survival for operable spine metastatic disease: External validation. J Surg Oncol. 2017; 115 8: 1019– 1027. [DOI] [PubMed] [Google Scholar]
- 30. Smith A, Averch T, Shahrour K, . et al. A nephrolithometric nomogram to predict treatment success of percutaneous nephrolithotomy. J Urol. 2013; 190 1: 149– 156. [DOI] [PubMed] [Google Scholar]
Associated Data
This section collects any data citations, data availability statements, or supplementary materials included in this article.


