Abstract
Purpose
To quantify microvasculature changes in the superficial (SCP), middle (MCP), and deep capillary plexuses (DCP) in diabetic retinopathy (DR).
Methods
Retrospective cross-sectional study at a tertiary academic referral center, in which 26 controls (44 eyes), 27 diabetic subjects without retinopathy (44 eyes), 32 subjects with nonproliferative retinopathy (52 eyes), and 27 subjects with proliferative retinopathy (40 eyes) were imaged with optical coherence tomography angiography (OCTA). Outcome measures included parafoveal vessel density (VD), percentage area of nonperfusion (PAN), and adjusted flow index (AFI) at the different plexuses.
Results
MCP VD and MCP AFI decreased with worsening DR, while PAN increased, mirroring changes within the DCP. The fitted regression line for MCP and DCP AFI were significantly different than the SCP, while DCP PAN differed from SCP PAN with disease progression. Higher SCP AFI and PAN were different in eyes with diabetes without retinopathy compared with controls. Unexpectedly, sex was found to independently influence MCP VD and AFI with worsening disease.
Conclusions
OCTA parameters in the MCP and DCP displayed parallel changes with DR progression, different from the SCP, emphasizing the importance of physiologic considerations in the retinal capillaries. Thus, segmentation protocols that include the MCP within the SCP may be confounded. A difference in DCP PAN with worsening DR was unmasked relative to a prior study that included the MCP with SCP. We confirm that SCP AFI and PAN may serve as early indicators of microvascular changes in DR and identify an interaction between sex and the MCP deserving further study.
Keywords: OCT angiography, middle capillary plexus, segmentation
Optical coherence tomography angiography (OCTA) is a new modality that images retinal blood flow by detecting changes in OCT reflectivity related to erythrocyte movement by comparing sequential spectral-domain OCT scans obtained in the same location.1 One primary advantage is its ability to map the retinal microvasculature three-dimensionally, allowing clinicians to study the individual retinal capillary plexuses.
OCTA studies in diabetic retinopathy (DR) have largely concentrated on the superficial (SCP) and deep retinal capillary plexuses (DCP).2–7 However, the middle capillary plexus (MCP) has been well-defined histopathologically,8–12 and has been shown to be controlled by distinct developmental and autoregulatory cues.13,14 When the standard commercial software is used, the MCP is partially incorporated into the other plexuses, possibly confounding the results of previous OCTA studies.2–7 Although disruption of the retinal structure from DR and projection artifact from the SCP are the most salient issues that complicate automated segmentation of the MCP,15,16 we have recently shown that manual segmentation of OCTA volumes can effectively visualize the MCP.17 Since then, several studies have used OCTA to examine the three plexuses in patients with DR, finding differences in the vasculature and perfusion between the layers.15,18,19
In this study, we build upon our recent analysis, which identified a decline in retinal capillary density with increasing DR severity.20 Our goal in the current study was to better understand the pathophysiology of DR by characterizing the vascular changes at the individual macular capillary plexuses. In particular, we were most interested in the role of the MCP, which is generally incorporated with the SCP in current software algorithms (as in our previous study). Given the known distinct autoregulation of the MCP compared with the SCP and DCP,13 we hypothesized that evaluating the MCP separately from the SCP would reveal new insights about this former layer, compared with previous reports that used segmentation algorithms that incorporate the MCP within the SCP. Also, given the importance of identifying patients who would benefit from metabolic interventions before the onset of DR, we were interested in confirming our previous finding of OCTA biomarkers at the SCP that could distinguish healthy eyes from those with subclinical DR.20,21 We believe our study advances our understanding of how the various retinal capillary layers are affected in DR.
Methods
This was a retrospective study of healthy and diabetic subjects who underwent OCTA imaging between June 2015 and July 2016 in the Department of Ophthalmology at Northwestern University in Chicago, Illinois. All participants provided written informed consent. The study was conducted with approval from the institutional review board of Northwestern University, and in compliance with the Health Insurance Portability and Accountability Act of 1996 and the tenets of the Declaration of Helsinki.
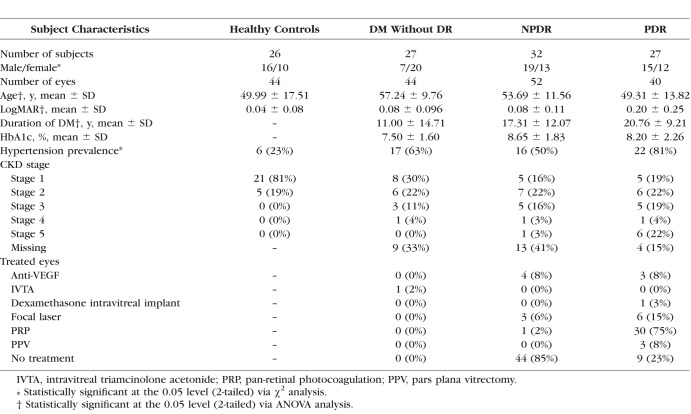
Inclusion criteria were healthy subjects or diabetics with no DR, nonproliferative (NPDR), or proliferative diabetic retinopathy (PDR). Staging of retinopathy was based on color fundus photographs analyzed by one of two board-certified experienced retina specialists (AAF or LMJ) using Early Treatment Diabetic Retinopathy Study (ETDRS) guidelines.22 We included both treated and treatment-naïve eyes (Table 1). Additional prerequisites were OCTA images without significant movement or shadow artifacts, and a signal strength index (SSI) score above 50. Exclusion criteria included eyes with other retinal vascular diseases, astigmatism (>3 diopters [D]), high myopia (>6 D), or cataracts graded above nuclear opalescence or nuclear color grade three. The presence of DR pathology including edema or retinal hard exudates was noted, but the eyes were included.
Table 1.
Demographic and Disease-Related Subject Characteristics
Electronic medical records were reviewed for demographic and clinical data, and best-corrected visual acuity was converted to logMAR.23 Chronic kidney disease (CKD) stages were determined according to the Kidney Disease Outcome Quality Initiative guidelines, where estimated glomerular filtration rates were calculated using the Modification of Diet in Renal Disease Study equation and serum creatinine, age, and racial information.24 Controls without known serum creatinine were assumed to have CKD stage 1.
Imaging and Processing
The RTVue-XR Avanti OCTA System (Optovue, Inc., Fremont, CA, USA) system uses the split-spectrum amplitude-decorrelation angiography (SSADA) algorithm (AngioVue Analytics; version 2016.1.0.26; Optovue, Inc.).25 This device has an A-scan rate of 70,000 scans/s using a light source centered on 840 nm and a bandwidth of 45 nm. To produce three-dimensional angiograms, two consecutive B-scans (M-B frames), each with 304 A-scans, were captured in a 3 × 3-mm2 area centered on the fovea. SSADA was applied to extract OCTA information, and the SSI for each image was recorded.
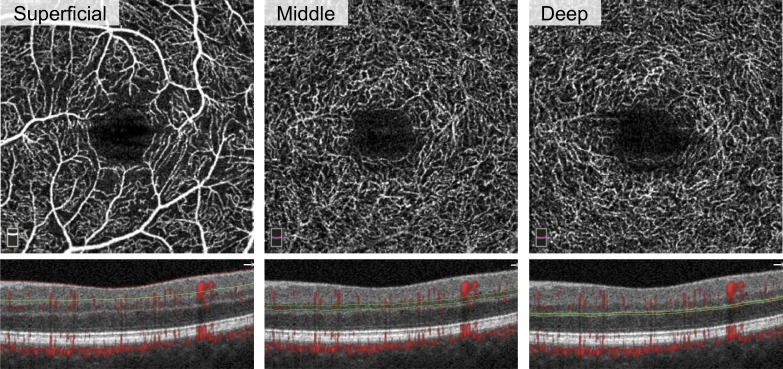
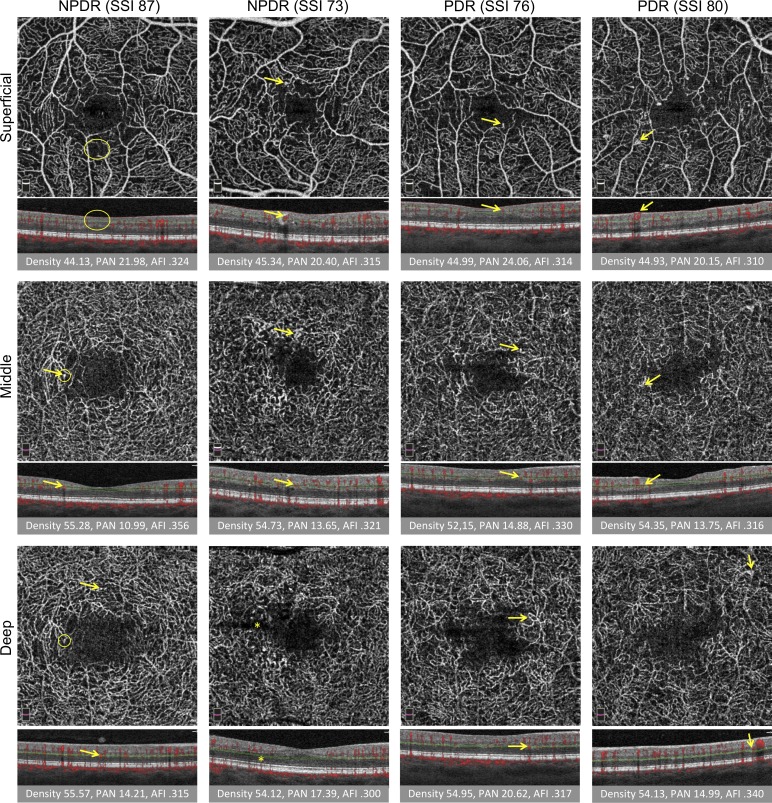
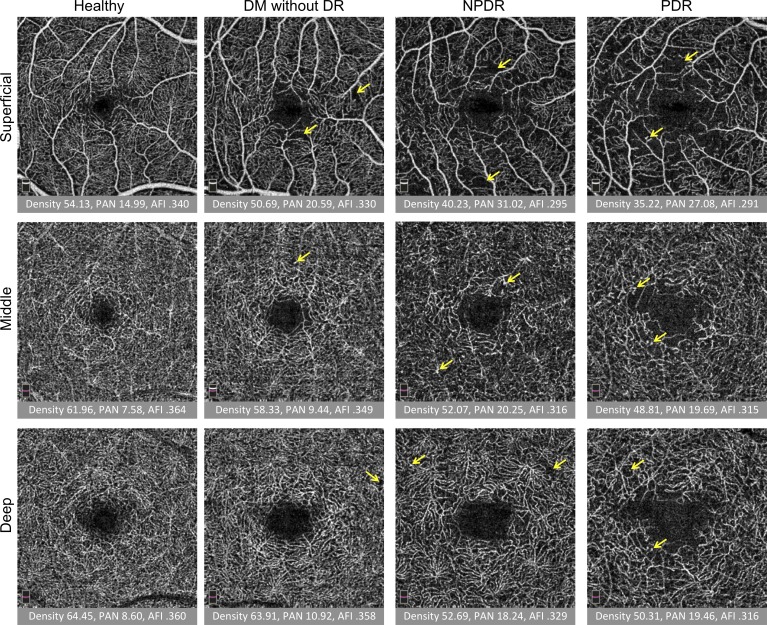
En face OCT angiographs were segmented into the SCP, MCP, and DCP according to the protocol we recently reported as Method 3 (Figs. 1–3).17 We used MCP boundaries that included the inner nuclear layer (INL), while SCP and DCP slabs were thinner and did not overlap with the INL.
Figure 1.
Segmentation of three capillary plexuses on OCTA. Left eye of patient with DM without DR. En face (top row) and cross-sectional (bottom row) OCTA of the superficial (left), middle (center), and deep (right) capillary plexuses. The red and green lines on cross-sectional OCTA show the segmentation boundaries for each layer.
Figure 3.
Vascular abnormalities in three capillary plexuses in NPDR and PDR. First two columns are NPDR and last two columns are PDR. SSI is reported. Rows from top to bottom: SCP, MCP, and DCP. Under each image, the corresponding B-scan shows red flow overlay and red and green segmentation boundaries. Below B-scans, the vessel density (density), PAN, and AFI are reported. Arrows represent vascular abnormalities, including microaneurysms, dilated vessels, intraretinal microvascular abnormalities, and neovascularization. Large oval (SCP, left) represents nonperfusion, small circles (DCP, left) indicate one instance of projection artifact of a microaneurysm from the MCP onto the DCP. Ovals and arrows on the B-scan correspond to the en face to show the location of the abnormality within the retina. Projection artifact was minimized using our segmentation scheme, as discussed. Straight dark line in the deep plexus results from a failure in the segmentation algorithm (asterisk).
Figure 2.
Quantitative analysis of three capillary plexuses in a series of eyes with increasing disease severity. Columns from left to right: healthy subject, DM without DR, NPDR, and PDR. Rows from top to bottom: superficial, middle, and deep capillary plexus. Under each image, the vessel density (density), PAN, and AFI are reported. Overall, density and AFI decreased and PAN increased with severity. Projection artifact is seen as superficial vessels are cast onto the deeper layers, but was minimized by the exclusion of the hyperreflective plexiform layers in the segmentation scheme. Arrows represent vascular abnormalities, including microaneurysms, dilated vessels, and neovascularization.
OCTA quantitative measures were extracted for the capillary layers according to a previously described protocol.20
Parafoveal Vessel Density (VD)
The parafovea was defined as a ring around the fovea with an inner ring diameter of 1 mm and an outer ring diameter of 3 mm. The percentage of total parafoveal area occupied by blood vessels was recorded as VD.
Adjusted Flow Index (AFI) and Percentage Area of Nonperfusion (PAN)
The noise level for each eye was determined as the average mean pixel intensity of three areas within the foveal avascular zone (FAZ) selected with a 30-pixel radius circle on the SCP angiogram. All pixels with intensities above this noise level were interpreted as vessels, whereas those with intensities below this threshold were considered nonperfusion for each vascular layer. The AFI, a surrogate for flow index, was calculated as the average decorrelation value of all the pixels over the noise threshold for the SCP, MCP, and DCP, thereby correcting for background noise. PAN was defined as the percentage of pixels below the threshold in each layer.
Statistical Analysis
Analyses were conducted in SPSS 24 (IBM Corp., Armonk, NY, USA) and R (R 3.0.2.; The R Foundation, Vienna, Austria). For all tests, P values < 0.05 were considered statistically significant. All data were reported as means and SD. ANOVA was performed to compare continuous demographic variables (age, duration of DM, logMAR, and hemoglobin A1c [HbA1c]) across disease groups. Pearson and Spearman correlations were used to study the association between ordered disease stage (healthy: 0; DM without DR: 1; NPDR: 2; PDR: 3) and the demographic variables. Similar methods were used to analyze parafoveal VD, PAN, and AFI across disease groups in the three major plexuses. χ2 tests were used to analyze dichotomous variables (sex, hypertension, and DM type) while considering the disease groups as categoric and ordered (Table 1).
Linear mixed-effects models were used (implemented in the lme4 package in R) to control for sex and age. We considered random intercepts for patients because eyes from the same subject could be correlated. The data were analyzed considering disease severity groups as either a continuous or categoric variable. With disease severity assumed categoric, we compared major OCTA parameters in healthy eyes to each disease severity group. Then, models were fit to test whether the DR groups differed in outcome measures across the three plexuses. The fitted regression lines for each OCTA parameter across the disease groups were plotted, comparing the MCP and DCP with the SCP.
Because sex was found to impact OCTA parameters independent of disease group, an additional mixed-effects analysis was conducted to study the interaction between sex and disease group.
Results
Of 194 eyes eligible for this study, 14 were excluded due to SSI <50 or presence of significant artifact, leaving 44 eyes from 26 healthy controls, 44 eyes from 27 diabetic patients without clinical evidence of retinopathy, 52 eyes from 32 patients with NPDR, and 40 eyes from 27 patients with PDR (Table 1).
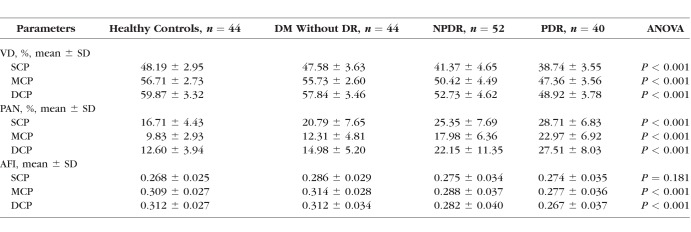
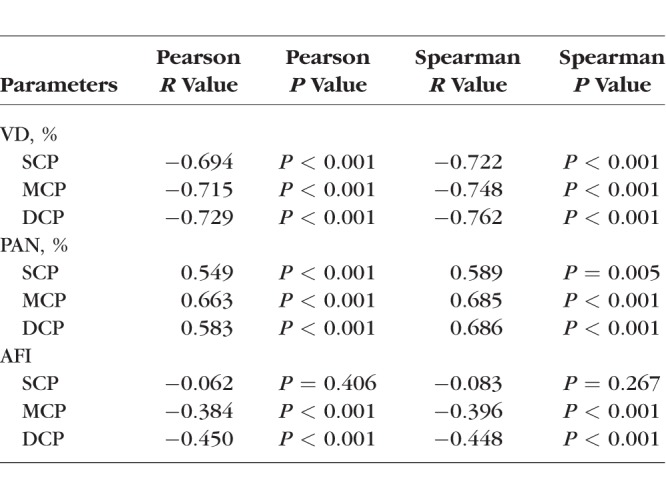
We evaluated OCTA parameters across disease severity groups using the following univariate analyses with consistent results, ANOVA (Table 2) and Pearson and Spearman correlations (Table 3). In general, VD decreased and retinal nonperfusion increased significantly in all three plexuses with worsening DR (Table 2).
Table 2.
Analysis of Variance of Optical Coherence Tomography Angiography Parameters by Disease Group
Table 3.
Pearson and Spearman Correlations Between OCTA Parameters and Disease Group
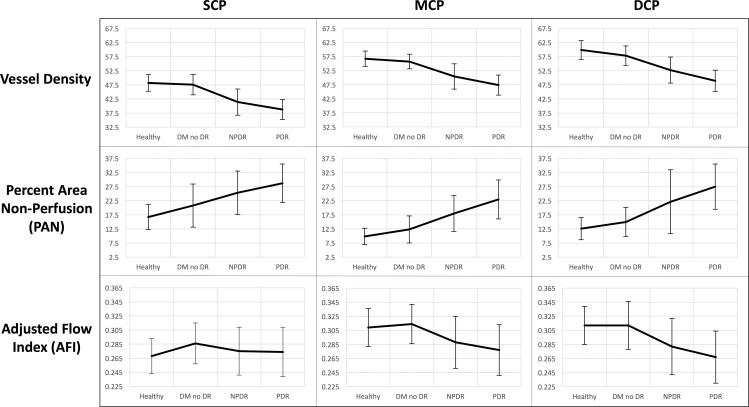
Conversely, AFI showed a nonlinear pattern, with an increase when comparing healthy controls with the DM without DR group. A post hoc two-tailed t-test comparing SCP AFI between the two groups resulted in a P value of 0.067. With advancing stages of DR, AFI decreased in the MCP and DCP with less prominent changes in the SCP (Fig. 4). Overall, SCP AFI was the only OCTA parameter in this study that did not show a significant difference across disease groups in either the ANOVA or Pearson analyses (Tables 2, 3).
Figure 4.
OCTA parameters across disease groups graphed continuously. Columns from left to right: SCP, MCP, and DCP. Rows from top to bottom: mean values for parafoveal vessel density, PAN, and AFI, respectively, graphically represented across healthy controls, eyes with DM without DR, NPDR, and PDR. Error bars: 1 SD.
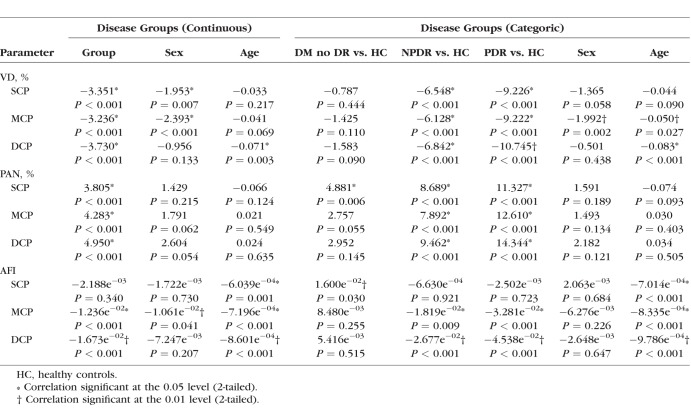
Next, we applied mixed-effects models to adjust for sex and age, and found that disease severity was a significant modifier of VD, PAN, and AFI (except SCP AFI) across the three plexuses when disease groups were considered as a continuous variable, confirming the univariate results (Table 4). When disease groups were considered categoric variables, the mixed-effects models showed that each disease group could be distinguished from healthy controls by at least two OCTA parameters in two plexus layers (Table 4). Elevated SCP PAN and AFI were the only parameters significantly different between DM without DR group and healthy eyes.
Table 4.
Linear Mixed-Effects Models of Optical Coherence Tomography Angiography Parameters and Disease Group
To investigate how parafoveal VD, PAN, and AFI changed with DR severity across the three layers, a linear mixed-model fit was used to compare MCP and DCP parameters with those in the SCP (Table 5). The model included interactions between the OCTA parameters and DR severity groups. Only AFI had significant changes in both the MCP (estimate = 3.550e−02, P < 0.001) and DCP (estimate = 3.740e−02, P < 0.001) compared with the SCP. PAN increased more steeply in the DCP (estimate = 1.102, P = 0.017) relative to the SCP (Table 5), but not significantly so in the MCP (estimate = 0.409, P = 0.374).
Table 5.
Linear Mixed-Effects Model to Compare the Middle and Deep Capillary Plexuses Against the Superficial Capillary Plexus
Unexpectedly, the mixed-effects models suggested an independent and significant effect of sex on several OCTA parameters (Table 4). SCP and MCP VD, as well as MCP AFI, appeared to significantly differ by sex when disease stage was considered a continuous variable. Sex continued to exert an independent effect on MCP VD when disease stage was considered a categoric variable.
Discussion
In this study, we used OCTA to quantify the retinal microvascular structure and perfusion in the three retinal plexuses, comparing controls with diabetic subjects across a spectrum of severity. First, we used univariate analyses to explore the relationship between OCTA parameters and DR stages (Tables 2, 3). Second, we implemented linear mixed-effects models to adjust for sex, age, and eyes from the same subject (Table 4). Using univariate analyses, we found that changes in OCTA parameters in every plexus (except SCP AFI) were significantly correlated with DR stage (Tables 2, 3), which is consistent with our previous study.20 After controlling for covariates using mixed-effects models, changes in these parameters remained significant across disease groups, with the continued exception of the SCP AFI (Table 4). In general, MCP and DCP OCTA parameters changed in a similar direction with worsening disease severity.
Our main goal was to characterize changes at each plexus, with an emphasis on the MCP, and to identify changes in findings relative to our previous study.20 Prior studies have shown that the MCP is distinctly affected in DR, with disproportionately more microaneurysms and capillary loops.18,26,27 In their study of the three retinal capillary plexuses, Zhang et al.19 observed significant increases in the avascular areas of patients with mild NPDR relative to healthy controls that seemed more pronounced in the SCP and DCP compared with the MCP. In addition, they noted that the avascular area was qualitatively lower in the MCP compared with the SCP and DCP. In our study, PAN, an objective marker of retinal nonperfusion, was also lower in the MCP compared with the SCP and DCP in controls and across the spectrum of DR severity (Table 2). However, in contrast to the previously mentioned report, after controlling for sex and age with a mixed-effects analysis, our results suggested significant increases in PAN in all three plexuses in the NPDR group compared with controls. Importantly and distinct from the study by Zhang et al.,19 we also identified a significant increase in SCP PAN in the DM without DR group compared with controls (Table 4). Interestingly, the fitted regression line for DCP PAN was significantly steeper relative to the other layers (Table 5), which differs from our previous study results, which found no difference in the SCP and DCP PAN regression lines.20 This finding further emphasizes the importance of OCTA segmentation schemes that consider the MCP separately from the SCP and DCP.
We also identified a role for sex and age exerting an independent effect on VD and AFI in the linear mixed-effects models (Table 4). Because a negative correlation between age and retinal blood flow and VD has been shown, we focused our investigations on the effect of sex.28–30 In our results, sex appeared to have a significant effect on MCP VD across DR stages (whether continuous or categoric variables), and MCP AFI when DR stage was considered a continuous variable (Table 4). Men had a significantly lower MCP VD (estimate = −2.393, P < 0.001) and AFI (estimate = −1.061e−02, P = 0.041) than women. Differences in ocular blood flow between men and women have been reported in the past, with sex hormones postulated to be responsible.31 Additionally, previous studies have suggested a role for sex in DR progression and retinal perfusion.32–34 While these data may suggest the MCP is differentially regulated by sex, we found that after adjusting for age and correlation between eyes of the same patient in our mixed-effects analyses, the interaction between sex and disease severity was no longer significant (data not shown). Based on these findings and a limited number of studies demonstrating how sex influences the microvascular changes in DR,35 we believe that future studies specifically powered to examine the relationship between sex and vasculature in DR are warranted.
Retinal VD has previously been identified as a marker of disease severity in diabetic eyes.36 In our mixed-effects model, parafoveal VD in all three plexuses reliably showed a significant decrease in eyes with DR compared with healthy controls (Table 4).37 Nevertheless, we found that only two SCP parameters (PAN and AFI) distinguished eyes in the DM without DR group from the healthy control eyes (Table 4). These early changes in the SCP support previous studies demonstrating the ability of SCP OCTA parameters to distinguish healthy eyes from eyes with various stages of DR,38 and confirm our recent findings identifying increased SCP AFI and PAN as markers of preclinical microvascular changes in DM.20
The fact that the SCP AFI was significantly increased when comparing healthy controls with subjects with DM without DR in the mixed-effects model was surprising given the univariate analysis results (Tables 2–4). While raw data showed higher SCP AFI in DM without DR eyes compared with controls, these differences were not significant with ANOVA or Pearson/Spearman analyses (Fig. 4; Tables 2, 3). To investigate this discrepancy, a t-test comparing SCP AFI between the two groups was performed (P = 0.067). We believe that using multivariable models with mixed-effects analyses unveiled an underlying significant increase in SCP AFI in diabetic eyes without retinopathy by controlling for the effect of confounders not considered in the univariate analysis. While the observed patterns in SCP, MCP, and DCP AFI were generally consistent with those of our recent study, trends in SCP AFI in NPDR (estimate = −6.630e−04) and PDR (estimate = −2.502e−03) groups were an order of magnitude lower in value in the current study relative to controls.20 This is likely due to the removal of the contribution of MCP vasculature from the SCP AFI in the current study.
This apparent increase in SCP AFI occurred in the setting of a concurrent increase in SCP PAN, a marker of nonperfusion (Table 4). This would suggest that while capillary closure occurs in the superficial retina in DM without DR, the remaining vasculature within the SCP show relatively increased retinal blood flow.20 This early increase in retinal blood flow in DR is consistent with findings from studies in rats and humans.39,40 Tang et al.41 recently reported an increase in an OCTA parameter (vessel diameter index) that was correlated with worsening DR, suggesting widening capillaries and hyperperfusion. However, other studies have suggested an initial decrease and then increase in retinal blood flow with progression of retinopathy.42 Our findings of an increase in SCP AFI, a parameter approximating blood flow, in eyes with DM without DR compared with controls would support the former studies (Table 4). In addition, the MCP and DCP showed similar, though nonsignificant, trends when comparing DM without DR with healthy eyes (Table 4; Fig. 4). Notably, when analyzing AFI in the different plexuses across the spectrum of DR severity, MCP and DCP AFI appeared to decrease steeply while SCP AFI decreased more slowly, if at all (Fig. 4). This slow or absent decline in SCP AFI with DR severity was confirmed by the linear mixed-effects models, which showed significant differences between the slopes of SCP AFI and both MCP and DCP AFI (Table 5).
Flow differences between the capillary networks with disease progression suggest differential involvement of the retinal capillary layers.13,43 One possible explanation is that autoregulation of SCP blood flow may be somewhat preserved with progressing DR compared with deeper capillary layers, explaining the relative preservation in flow observed in the SCP compared with a steep decline at the MCP and DCP. Another possibility is that dilated, telangiectatic SCP vessels (precursors of neovascularization) with their higher flow and decreased vascular resistance contribute to a “steal phenomenon” at the deeper layers. In this situation, the increased AFI in the SCP could be exacerbating ischemia at the MCP and DCP and contributing to the steeply decreasing AFI at these layers. Regardless of the pathophysiology, these contrasting changes in the individual retinal plexuses, which had been inaccessible to study prior to the advent of OCTA, may explain historic difficulties in studying retinal blood flow in DR. While retinal blood flow is undoubtedly affected in DR, the nature of the effect has been vigorously debated. When assessed globally (without consideration of the trilaminar capillary structure) using imaging modalities other than OCTA, blood flow changes in more severely affected capillary layers could mask changes in the opposite direction affecting other plexuses, and in turn lead to controversial results.42,44–47 Similarly, given the stark differences in AFI observed between the SCP and the other two plexuses, future OCTA studies should use segmentation schemes that consider the SCP separately from the deeper layers.
It is challenging to directly compare the current study results with those of other studies using different modalities, such as adaptive optics, due to OCTA's unique ability to resolve individual capillary plexuses. That being said, a previous adaptive optics study found nonsignificant decreases in parafoveal capillary density in diabetic patients without DR compared with healthy controls, consistent with our study.48 Other adaptive optics studies have found somewhat contradictory results; for example, regarding capillary diameter in NPDR patients compared with healthy controls.49,50 Importantly, there is a notable dearth of systematic studies of retinal capillary blood flow and depth-resolved capillary changes using adaptive optics, which would be important contributions to our understanding of DR.
While strengths of this study include the large patient cohort, improved segmentation scheme, and robust statistical models, there are important limitations to consider. These include the cross-sectional study design as well as differences in several patient demographics between disease groups, such as age and breakdown of sex, although we adjusted for these demographic differences in our mixed-effects analyses. Importantly, we were not able to adjust for differences in treatment between the groups, particularly in eyes with PDR, which could affect OCTA outcome measures. An additional limitation is the use of a 3 × 3-mm2 area of OCTA imaging, which does not address more peripheral retinal changes.51 Other limitations include the lack of projection resolution, as well as occasional segmentation failure leading to segmentation artifact. However, the segmentation protocol used for the MCP was centered on the INL and excluded the hyperreflective inner plexiform layer and outer plexiform layer where projection artifact would typically be most prominent.
In summary, we used objective OCTA parameters to quantify vascular changes at each of the individual retinal capillary plexuses in DR. In general, our study shows that vessel density, perfusion, and blood flow in the MCP and DCP largely follow similar trends with worsening DR. In contrast, changes at the SCP are significantly different, suggesting potential areas for future study, as well as emphasizing the need for segmentation schemes that consider the MCP separately. In addition, we confirm our recent finding of SCP PAN and AFI as the only biomarkers capable of distinguishing eyes of subjects with diabetes before the onset of clinically apparent DR from healthy control eyes, with higher statistical significance as the SCP is considered individually (after MCP segmentation).20 Other notable findings include nonlinear patterns of blood flow changes with advancing DR stage (at all capillary layers) as well as a significant effect for sex on several MCP OCTA parameters. Larger scale studies are needed to further explore the effect of sex on the different capillary plexuses in DR.
Acknowledgments
Supported by grants from the National Institutes of Health DP3DK108248 (AAF; Bethesda, MD, USA) and Research to Prevent Blindness, Inc., (New York, NY, USA) with unrestricted funds to the Department of Ophthalmology, Northwestern University. Optovue, Inc. (Fremont, CA, USA) provided research instrument support.
Disclosure: A.C. Onishi, None; P.L. Nesper, None; P.K. Roberts, None; G.A. Moharram, None; H. Chai, None; L. Liu, None; L.M. Jampol, None; A.A. Fawzi, None
References
- 1. Nesper PL, Soetikno BT, Zhang HF, Fawzi AA. . OCT angiography and visible-light OCT in diabetic retinopathy. Vision Res. 2017; 139: 191– 203. [DOI] [PMC free article] [PubMed] [Google Scholar]
- 2. Miwa Y, Murakami T, Suzuma K,et al. . Relationship between functional and structural changes in diabetic vessels in optical coherence tomography angiography. Sci Rep. 2016; 6: 29064. [DOI] [PMC free article] [PubMed] [Google Scholar]
- 3. Couturier A, Mane V, Bonnin S,et al. . Capillary plexus anomalies in diabetic retinopathy on optical coherence tomography angiography. Retina. 2015; 35: 2384– 2391. [DOI] [PubMed] [Google Scholar]
- 4. Mo S, Krawitz B, Efstathiadis E,et al. . Imaging foveal microvasculature: optical coherence tomography angiography versus adaptive optics scanning light ophthalmoscope fluorescein angiography. Invest Ophthalmol Vis Sci. 2016; 57: OCT130– OCT140. [DOI] [PMC free article] [PubMed] [Google Scholar]
- 5. Bhanushali D, Anegondi N, Gadde SG,et al. . Linking retinal microvasculature features with severity of diabetic retinopathy using optical coherence tomography angiography. Invest Ophthalmol Vis Sci. 2016; 57: OCT130– OCT140. [DOI] [PubMed] [Google Scholar]
- 6. Kim AY, Chu Z, Shahidzadeh A, Wang RK, Puliafito CA, Kashani AH. . Quantifying microvascular density and morphology in diabetic retinopathy using spectral-domain optical coherence tomography angiography. Invest Ophthalmol Vis Sci. 2016; 57: OCT362– OCT370. [DOI] [PMC free article] [PubMed] [Google Scholar]
- 7. Ishibazawa A, Nagaoka T, Takahashi A,et al. . Optical coherence tomography angiography in diabetic retinopathy: pilot study. Am J Ophthalmol. 2015; 160: 35– 44. [DOI] [PubMed] [Google Scholar]
- 8. Tan PE, Yu PK, Balaratnasingam C,et al. . Quantitative confocal imaging of the retinal microvasculature in the human retina. Invest Ophthalmol Vis Sci. 2012; 53: 5728– 5736. [DOI] [PubMed] [Google Scholar]
- 9. Snodderly DM, Weinhaus RS, Choi JC. . Neural-vascular relationships in central retina of macaque monkeys (Macaca fascicularis). J Neurosci. 1992; 12: 1169– 1193. [DOI] [PMC free article] [PubMed] [Google Scholar]
- 10. Gariano RF, Iruela-Arispe ML, Hendrickson AE. . Vascular development in primate retina: comparison of laminar plexus formation in monkey and human. Invest Ophthalmol Vis Sci. 1994; 35: 3442– 3455. [PubMed] [Google Scholar]
- 11. Chan G, Balaratnasingam C, Yu PK,et al. . Quantitative morphometry of perifoveal capillary networks in the human retina. Invest Ophthalmol Vis Sci. 2012; 53: 5502– 5514. [DOI] [PubMed] [Google Scholar]
- 12. Stahl A, Connor KM, Sapieha P,et al. . The mouse retina as an angiogenesis model. Invest Ophthalmol Vis Sci. 2010; 51: 2813– 2826. [DOI] [PMC free article] [PubMed] [Google Scholar]
- 13. Kornfield TE, Newman EA. . Regulation of blood flow in the retinal trilaminar vascular network. J Neurosci. 2014; 34: 11504– 11513. [DOI] [PMC free article] [PubMed] [Google Scholar]
- 14. Usui Y, Westenskow PD, Kurihara T,et al. . Neurovascular crosstalk between interneurons and capillaries is required for vision. J Clin Invest. 2015; 125: 2335– 2346. [DOI] [PMC free article] [PubMed] [Google Scholar]
- 15. Hwang TS, Zhang M, Bhavsar K,et al. . Visualization of 3 distinct retinal plexuses by projection-resolved optical coherence tomography angiography in diabetic retinopathy. JAMA Ophthalmol. 2016; 134: 1411– 1419. [DOI] [PMC free article] [PubMed] [Google Scholar]
- 16. Spaide RF. . Volume-rendered optical coherence tomography of diabetic retinopathy pilot study. Am J Ophthalmol. 2015; 160: 1200– 1210. [DOI] [PubMed] [Google Scholar]
- 17. Park JJ, Soetikno BT, Fawzi AA. . Characterization of the middle capillary plexus using optical coherence tomography angiography in healthy and diabetic eyes. Retina. 2016; 36: 2039– 2050. [DOI] [PMC free article] [PubMed] [Google Scholar]
- 18. Choi W, Waheed NK, Moult EM,et al. . Ultrahigh speed swept source optical coherence tomography angiography of retinal and choriocapillaris alterations in diabetic patients with and without retinopathy. Retina. 2017; 37: 11– 21. [DOI] [PMC free article] [PubMed] [Google Scholar]
- 19. Zhang M, Hwang TS, Dongye C, Wilson DJ, Huang D, Jia Y. . Automated quantification of nonperfusion in three retinal plexuses using projection-resolved optical coherence tomography angiography in diabetic retinopathy. Invest Ophthalmol Vis Sci. 2016; 57: 5101– 5106. [DOI] [PMC free article] [PubMed] [Google Scholar]
- 20. Nesper PL, Roberts PK, Onishi AC,et al. . Quantifying microvascular abnormalities with increasing disease severity of diabetic retinopathy using optical coherence tomography angiography. Invest Ophthalmol Vis Sci. 2017; 58: BIO307– BIO315. [DOI] [PMC free article] [PubMed] [Google Scholar]
- 21. Garg S, Davis RM. . Diabetic retinopathy screening update. Clin Diabetes. 2009; 27: 140– 145. [Google Scholar]
- 22. Early Treatment Diabetic Retinopathy Study Research Group. Grading diabetic retinopathy from stereoscopic color fundus photographs—an extension of the modified Airlie House classification: ETDRS report number 10. Ophthalmology. 1991; 98 5 Suppl: 786– 806. [PubMed] [Google Scholar]
- 23. Holladay JT. . Proper method for calculating average visual acuity. J Refract Surg. 1997; 13: 388– 391. [DOI] [PubMed] [Google Scholar]
- 24. Foundation NK. . K/DOQI clinical practice guidelines for chronic kidney disease: part 5. Evaluation of laboratory measurements for clinical assessment of kidney disease. Guideline 4. Estimation of GFR. Am J Kidney Dis. 2002; 39: S76– S110. [Google Scholar]
- 25. Jia Y, Tan O, Tokayer J,et al. . Split-spectrum amplitude-decorrelation angiography with optical coherence tomography. Opt Express. 2012; 20: 4710– 4725. [DOI] [PMC free article] [PubMed] [Google Scholar]
- 26. Stitt AW, Gardiner TA, Archer DB. . Histological and ultrastructural investigation of retinal microaneurysm development in diabetic patients. Br J Ophthalmol. 1995; 79: 362– 367. [DOI] [PMC free article] [PubMed] [Google Scholar]
- 27. Moore J, Bagley S, Ireland G, McLeod D, Boulton ME. . Three dimensional analysis of microaneurysms in the human diabetic retina. J Anat. 1999; 194: 89– 100. [DOI] [PMC free article] [PubMed] [Google Scholar]
- 28. Iafe NA, Phasukkijwatana N, Chen X, Sarraf D. . Retinal capillary density and foveal avascular zone area are age-dependent: quantitative analysis using optical coherence tomography angiography. Invest Ophthalmol Vis Sci. 2016; 57: 5780– 5787. [DOI] [PubMed] [Google Scholar]
- 29. Coscas F, Sellam A, Glacet-Bernard A,et al. . Normative data for vascular density in superficial and deep capillary plexuses of healthy adults assessed by optical coherence tomography angiography. Invest Ophthalmol Vis Sci. 2016; 57: OCT211– OCT223. [DOI] [PubMed] [Google Scholar]
- 30. Groh MJM, Michelsenn G, Langhans MJ, Harazny J. . Influence of age on retinal and optic nerve head blood circulation. Ophthalmology. 1996; 103: 529– 534. [DOI] [PubMed] [Google Scholar]
- 31. Schmidl D, Schmetterer L, Garhofer G, Popa-Cherecheanu A. . Gender differences in ocular blood flow. Curr Eye Res. 2015; 40: 201– 212. [DOI] [PMC free article] [PubMed] [Google Scholar]
- 32. Bodansky HJ, Cudworth AG, Whitelocke RA, Dobree JH. . Diabetic retinopathy and its relation to type of diabetes: review of a retinal clinic population. Br J Ophthalmol. 1982; 66: 496– 499. [DOI] [PMC free article] [PubMed] [Google Scholar]
- 33. Ozawa GY, Bearse MA, Adams AJ. . Male-female differences in diabetic retinopathy? Curr Eye Res. 2015; 40: 234– 246. [DOI] [PubMed] [Google Scholar]
- 34. Roy MS, Klein R, O'Colmain BJ, Klein BEK, Moss SE, Kempen JH. . The prevalence of diabetic retinopathy among adult type 1 diabetic persons in the United States. Arch Ophthalmol. 2004; 122: 546– 551. [DOI] [PubMed] [Google Scholar]
- 35. Fawzi AA. . Consensus on optical coherence tomography angiography nomenclature: do we need to develop and learn a new language? JAMA Ophthalmol. 2017; 135: 377– 378. [DOI] [PMC free article] [PubMed] [Google Scholar]
- 36. Hwang TS, Gao SS, Liu L,et al. . Automated quantification of capillary nonperfusion using optical coherence tomography angiography in diabetic retinopathy. JAMA Ophthalmol. 2016; 134: 367– 373. [DOI] [PMC free article] [PubMed] [Google Scholar]
- 37. Agemy SA, Scripsema NK, Shah CM,et al. . Retinal vascular perfusion density mapping using optical coherence tomography angiography in normals and diabetic retinopathy patients. Retina. 2015; 35: 2353– 2363. [DOI] [PubMed] [Google Scholar]
- 38. Durbin MK, An L, Shemonski ND,et al. . Quantification of retinal microvascular density in optical coherence tomography angiography images in diabetic retinopathy. JAMA Ophthalmol. 2017; 135: 370– 376. [DOI] [PMC free article] [PubMed] [Google Scholar]
- 39. Grunwald JE, DuPont J, Riva CE. . Retinal haemodynamics in patients with early diabetes mellitus. Br J Ophthalmol. 1996; 80: 327– 331. [DOI] [PMC free article] [PubMed] [Google Scholar]
- 40. Cringle SJ, Yu DY, Alder VA, Su EN. . Retinal blood flow by hydrogen clearance polarography in the streptozotocin-induced diabetic rat. Invest Ophthalmol Vis Sci. 1993; 34: 1716– 1721. [PubMed] [Google Scholar]
- 41. Tang FY, Ng DS, Lam A,et al. . Determinants of quantitative optical coherence tomography angiography metrics in patients with diabetes. Sci Rep. 2017; 7: 2575. [DOI] [PMC free article] [PubMed] [Google Scholar]
- 42. Konno S, Feke GT, Yoshida A, Fujio N, Goger DG, Buzney SM. . Retinal blood flow changes in type I diabetes: a long-term, follow-up study. Invest Ophthalmol Vis Sci. 1996; 37: 1140– 1148. [PubMed] [Google Scholar]
- 43. Yu DY, Cringle SJ, Alder VA, Su EN. . Intraretinal oxygen distribution in rats as a function of systemic blood pressure. Am J Physiol. 1994; 267: H2498– H2507. [DOI] [PubMed] [Google Scholar]
- 44. Nagaoka T, Sato E, Takahashi A, Yokota H, Sogawa K, Yoshida A. . Impaired retinal circulation in patients with type 2 diabetes mellitus: retinal laser Doppler velocimetry study. Invest Ophthalmol Vis Sci. 2010; 51: 6729– 6734. [DOI] [PubMed] [Google Scholar]
- 45. Patel V, Rassam S, Newsom R, Wiek J, Kohner E. . Retinal blood flow in diabetic retinopathy. BMJ. 1992; 305: 678– 683. [DOI] [PMC free article] [PubMed] [Google Scholar]
- 46. Nguyen HT, van Duinkerken E, Verbraak FD,et al. . Retinal blood flow is increased in type 1 diabetes mellitus patients with advanced stages of retinopathy. BMC Endocr Disord. 2016; 16: 25. [DOI] [PMC free article] [PubMed] [Google Scholar]
- 47. Ludovico J, Bernardes R, Pires I, Figueira J, Lobo C, Cunha-Vaz J. . Alterations of retinal capillary blood flow in preclinical retinopathy in subjects with type 2 diabetes. Graefes Arch Clin Exp Ophthalmol. 2003; 241: 181– 186. [DOI] [PubMed] [Google Scholar]
- 48. Tam J, Dhamdhere KP, Tiruveedhula P,et al. . Disruption of the retinal parafoveal capillary network in type 2 diabetes before the onset of diabetic retinopathy. Invest Ophthalmol Vis Sci. 2011; 52: 9257– 9266. [DOI] [PMC free article] [PubMed] [Google Scholar]
- 49. Burns SA, Elsner AE, Chui TY. . In vivo adaptive optics microvascular imaging in diabetic patients without clinically severe diabetic retinopathy. Biomed Opt Express. 2014; 5: 961– 974. [DOI] [PMC free article] [PubMed] [Google Scholar]
- 50. Lombardo M, Parravano M, Serrao S,et al. . Analysis of retinal capillaries in patients with type 1 diabetes and nonproliferative diabetic retinopathy using adaptive optics imaging. Retina. 2013; 33: 1630– 1639. [DOI] [PubMed] [Google Scholar]
- 51. Silva PS, Cavallerano JD, Haddad NM,et al. . Peripheral lesions identified on ultrawide field imaging predict increased risk of diabetic retinopathy progression over 4 years. Ophthalmology. 2015; 122: 949– 956. [DOI] [PubMed] [Google Scholar]


