

Summary
Covalent inhibitors of K-Ras(G12C) have been reported that exclusively recognize the GDP state. Here, we utilize disulfide tethering of a non-natural cysteine (K-Ras(M72C)) to identify a new Switch-II Pocket (S-IIP) binding ligand (2C07) that engages the active GTP state. Co-crystal structures of 2C07 bound to H-Ras(M72C) reveal binding in a cryptic groove we term S-IIG. In the GppNHp state, 2C07 binding to a modified S-IIP pushes switch-I away from the nucleotide breaking the network of polar contacts essential for adopting the canonical GTP state. Biochemical studies show 2C07 alters nucleotide preference and inhibits SOS binding and catalyzed nucleotide exchange. 2C07 was converted to irreversible covalent analogs, which target both nucleotide states, inhibit PI3K activation in vitro, and function as occupancy probes to detect reversible engagement in competition assays. Targeting both nucleotide states opens the possibility of inhibiting oncogenic mutants of Ras, which exist predominantly in the GTP state in cells.
eTOC
Small molecule Ras inhibitors offer a promising avenue to address the 20% of cancers driven by this oncogene. Gentile et al. structurally and biochemically characterize a new switch-II binder, 2C07, which expands switch-II pocket inhibition to both nucleotide states by stabilizing Ras GDP and preventing PI3K activation by Ras GTP.

Introduction
Oncogenic mutations in Ras are found in over 20% of all cancers and are generally associated with increased mortality (Forbes et al., 2010). Mutations in Ras lead to constitutive activation of Ras signaling by impairing GTP hydrolysis, making signaling dependent on nucleotide affinity and relative nucleotide concentration rather than GAP (GTPase Accelerating Protein) mediated inactivation (Ostrem and Shokat, 2016). The switch-like activation cycle is mediated by switch-I (residues 30–38) and switch-II (residues 59–76), which undergo drastic changes in topology and dynamics upon nucleotide exchange (Ito et al., 1997; Milburn et al., 1990; Muraoka et al., 2012). Oncogenic mutations at G12, G13, and Q61 disturb these structural changes causing constitutive activation (Hunter et al., 2015).
Ras has until recently been deemed “undruggable” due to its picomolar affinity for nucleotide and a lack of other functional binding pockets (John et al., 1990). Our lab and others have begun to re-evaluate the possibility of direct Ras inhibition by employing various methods to detect protein allostery and screen for binding ligands (Lim et al., 2013; Maurer et al., 2012; Muraoka et al., 2012; Ostrem et al., 2013; Patgiri et al., 2011; Shima et al., 2013; Spencer-Smith et al., 2017; Sun et al., 2012; Welsch et al., 2017). From this work, novel pockets have been identified that provide new opportunities for drug discovery. A series of oncogene specific irreversible K-Ras(G12C) inhibitors (eg. ARS-853), which bind to a transient pocket under switch-II (termed S-IIP), have been reported (Lito et al., 2016; Ostrem et al., 2013; Patricelli et al., 2016). Intriguingly, these electrophiles inhibit K-Ras(G12C) signaling by exclusively binding to and stabilizing the GDP form, which is the “inactive state” of the target in cells (Lito et al., 2016; Ostrem et al., 2013; Patricelli et al., 2016). The inability to bind the GTP state of K-Ras(G12C) is compensated by the near wild-type intrinsic GTPase activity of this oncogenic allele (Hunter et al., 2015; Patricelli et al., 2016). Although the G12C binding compounds provide an attractive entry point into drugging K-Ras, their exclusive specificity for the GDP state may limit their application beyond this particular allele. Other prevalent oncogenic K-Ras mutations such as G12V and G12D have significantly lower intrinsic hydrolysis rates and are predominately GTP bound in cells (Hunter et al., 2015).
Analysis of multiple Ras GDP crystal structures revealed residues that comprise the S-IIP are highly mobile in the GDP state but only form a stable pocket upon binding of a S-IIP ligand (Domaille et al., 1994; Ostrem et al., 2013; Ostrem and Shokat, 2016). By contrast, crystal structures of Ras GppNHp (5′-guanylyl imidodiphosphate, a non-hydrolyzable GTP analog) show the residues of switch-II closed over the S-IIP suggesting limited access to the pocket (Ostrem et al., 2013). However, analysis of B-factors for the deposited GppNHp structure of H-Ras(G12C) indicates that the switch-II region is still highly mobile (Figure S1) (Ostrem et al., 2013). NMR studies also suggest that activated Ras transitions between multiple conformational states to accommodate effector binding and GTPase activities (Kalbitzer et al., 2009; Muraoka et al., 2012). Therefore, we hypothesized it may be possible to find a ligand that takes advantage of switch-II’s flexibility in the GTP state for binding. Since the site of covalent attachment (residue 12) is proximal to the γ-phosphate of GTP, we wondered if the opposite end of the S-IIP, distant from position 12, might be accessible in the GTP state. Driven by the hypothesis that S-IIP inhibitors that bind to the GTP state could offer a means to access the most active form of K-Ras in cells, we carried out a fragment-based tethering screen with an engineered cysteine mutant of Ras (M72C) to discover new scaffolds that could expand switch-II inhibition to both nucleotide states and reveal new S-IIP dynamics and structural changes. This screen yielded a fragment that binds to both the GDP and GTP nucleotide states of mutant Ras, revealing unexpected Ras dynamics in the ligand bound GTP state and altering biochemical properties of Ras. 2C07 was then readily converted to a series of carbon-based electrophiles, which irreversibly target both nucleotide states and have detectable reversible binding in competition studies with fully reversible and equivalent scaffolds.
Results and Discussion
Fragment 2C07 Occupies an Expanded S-IIP in K-Ras(M72C) GDP
The discovery of the S-IIP relied on a disulfide-fragment-based screening approach called tethering to identify weak reversible covalent binders of K-Ras(G12C) (Erlanson et al., 2004; Forbes et al., 2010; Ostrem et al., 2013). Analysis of co-crystal structures of numerous published ligands for K-Ras(G12C) reveal a tripartite Switch-II Pocket: 1) Covalent attachment to G12C near the β-phosphate of GDP, including a common H-bond of the acrylamide to Lys 16, 2) The “linker region” which connects regions #1 and #3 and lacks obvious H-bond interactions, and 3) Distal to G12C a sub-pocket with several H-bond interactions (Asp 69 and Arg 68) to substituents on the phenol ring found in all reported S-IIP binders (Figure 1a) (Ostrem et al., 2013; Patricelli et al., 2016). Focusing on the two sub-pockets (#2 & #3) critical for non-covalent recognition, it is clear from extensive SAR analysis of various S-IIP binders that the phenol recognition pocket is critical for compound binding. In contrast, sub-pocket #2 makes limited ligand interactions and analyses of co-crystal structures and SAR across various compounds reveal modest improvements in potency and suggest the linker must be of appropriate length and flexibility to reach sub-pocket #3. To target sub-pocket #3 distal to position 12 and the γ-phosphate of GTP, non-native cysteine residues were introduced near the binding site of the phenol of ARS-853 to serve as a reactive handle for targeted tethering. By placing non-native cysteines far from the nucleotide-binding site, we hoped to select for fragments with higher potency and greater interactions with sub-pocket #3, which could potentially bind either nucleotide state.
Figure 1. Tethering at 72 Yields New S-IIP Binder.

a) Surface and cartoon representation of the S-IIP formed by the binding of ARS-853 (PDB: 5F2E, Figure S5). Residues of interest (Met 72 and Val 9) are marked and are proximal to sub-pocket #3 of the S-IIP where key polar contacts form with ARS-853. Sub-pockets #1 and #2 are also annotated. b) Top hits from the tethering screen as well as two 2C07 derivatives with βME50 values reported. Percent labeling of 2C07 and 2B02 against various Ras constructs at screening βME concentration (1 mM) are graphed. c) (Top) Co-crystal structure of 2C07 and K-Ras(M72C) with GDP (grey) and Mg2+ (green). (Bottom) Surface representation of the S-IIG and 2C07 FO - FC omit map (grey mesh 3 σ). Indicated residues form hydrophobic contacts with 2C07. d) Differences between ARS-853 and 2C07 structures are localized to Switch-II. Overlay of ARS-853 (magenta sticks) on the surface representation of K-Ras(M72C) 2C07 (cyan sticks) show distinct binding modes.
We first identified two amino acids, Met 72 and Val 9, that interact with current K-Ras(G12C) binders but do not form critical H-bonding interactions and individually mutated these residues to cysteine for tethering. K-Ras(V9C) was not reactive with various electrophiles such as Ellman’s reagent and a small panel of the disulfide tethering library. This lack of reactivity precluded its use for screening purposes. We therefore focused on K-Ras(M72C), which was solvent exposed and readily reacted with disulfide containing fragments.
A tethering library of 960 disulfides were screened against 1–169 K-Ras(M72C) GDP using intact protein mass spectrometry to monitor percent modification (See Methods, Figure S2). Fragments 2C07 (69.7% ± 3.1%) and 2B02 (52.8% ± 1.9%) exhibited the highest level of modification. These fragments were selective for Cys 72 as they did not modify full-length wild-type K-Ras (which contains 4 native cysteine residues), formed a single adduct with full-length K-Ras(M72C), and labeled Cys 72 in both truncated K and H-Ras isoforms (Figure 1b). 2C07 labeling is not significantly different between truncated isoforms, which reflects the near sequence identity between isoforms in the absence of their hypervariable region (Vigil et al., 2010). To better prioritize tethering fragments, a βME50 value (the concentration of βME needed to reduce disulfide fragment modification to 50%) was determined for each compound. A higher βME50 value corresponds to a better fragment as it can bind with increasing concentrations of competitive thiol (Erlanson et al., 2004; Yang et al., 2009).
We next explored small chemical modifications to 2C07. Increasing the 2C07 linker length (2C07b) lead to a modest loss in binding potency indicated by a small decrease in βME50. Removal of the trifluoromethyl group (2C07c) resulted in a drastic decrease in βME50 indicative of a substantial role in binding. We chose to investigate 2C07 further since it had a high starting βME50, a distinct chemotype from previously reported S-IIP binders, and several analogs suggested elements of 2C07 could be optimized to improve binding.
In order to better understand 2C07 binding, we solved its structure bound to K-Ras(M72C). To ensure uniform labeling specifically at Cys 72, we used a previously validated K-Ras Cys-light construct lacking all native cysteines (Ostrem et al., 2013). Using this construct, we obtained a 1.49 Å co-crystal structure of 2C07 bound to K-Ras(M72C) GDP (PDB: 5VBM) (Figure 1c). 2C07 binds under switch-II, but does not engage with a fully formed S-IIP as seen in K-Ras(G12C) binders. Instead of projecting back through sub-pockets #1 and #2 as described above, 2C07 engages with sub pocket #3 and diverts down into a new hydrophobic groove away from the nucleotide-binding site. Unexpectedly, 2C07 also expands this sub-pocket further by extending into a new hydrophobic groove. We refer to this S-IIP structural change as the Switch-II Groove (S-IIG) to convey that the ligand projects out of the S-IIP and is not covered by switch-II.
Like the S-IIP, the S-IIG is located between the central β-sheet and the α2-(switch-II) and α3 helices. However, 2C07 has more extensive interactions with the surface between the central β-sheet and the α3 helix than the original G12C fragment hits. This surface is shown in detail in Figure 1c (top) with key residues annotated and the defined and complete electron density of 2C07 shown (Fo−Fc, 2.5σ, bottom). Figure 1d shows a comparison between 2C07 and ARS-853 binding. 2C07 has a distinct trajectory away from the nucleotide-binding site and the conformation of the α2-(switch-II) helix is higher than the ARS-853 structure where polar contacts hold the helix close to the ligand. From its point of covalent attachment at Cys 12, ARS-853 traverses the mouth of the pocket and displaces Gly 60 reaching sub-pocket #3 underneath switch-II. Overlaying the two ligands (Figure 1d, right) with the surface of the 2C07 structure suggests overlapping but distinct trajectories occurring with specific switch-II conformations. The 2C07 (cyan sticks) stabilized switch-II surface (blue) clashes and cuts off sub-pocket #2, which ARS-853 (magenta sticks) traverses to form key H-bonding interactions with residues of sub-pocket #3 (Figure 1c). Since 2C07 possesses a new trajectory away from the nucleotide-binding pocket, we hypothesized that it may also have measurable binding to Ras GTP, in contrast to K-Ras(G12C) binding molecules.
2C07 Binds the GppNHp-state of H-Ras(M72C)
The tethering hit, 2C07, readily modifies H-Ras(M72C) GppNHp and retains its ability to label Cys 72 even in the presence of excess competitive thiol (βME50: 1.10 mM (1.01 mM – 1.20 mM)) (Figure 2a). This is in striking contrast to previous tethering fragments against K-Ras(G12C), which did not label the GppNHp state even at the lowest βME concentrations. We also observed that the second hit (2B02) labeled H-Ras(M72C) GppNHp, but chose to investigate 2C07 further due to its higher labeling efficiency for both nucleotide states and ease of crystallographic analysis.
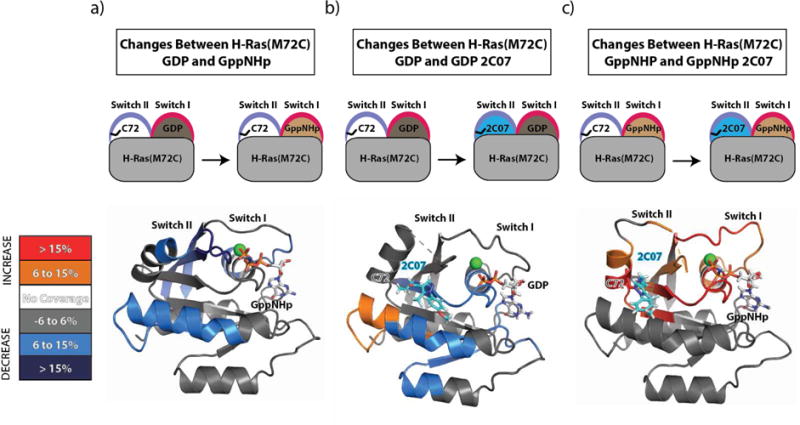
Figure 2. 2C07 Binds to H-Ras(M72C) GppNHp Causing Alternative Mg2+ Coordination.

a) βME50 values of 2C07 and 2B02 binding to the GppNHp state. Percent labeling against H-Ras(M72C) GDP and GppNHp at the screening βME concentration (1 mM) are graphed. b) Co-crystal structure of 2C07 and H-Ras(M72C) Chain C with GppNHp (grey) and Mg2+ (green). 2C07 FO - FC omit map is shown (grey mesh 3 σ). c) Full cartoon structural comparison of 2C07 bound to both nucleotide states. 2C07 induces a disordering of Switch II and a drastic movement of Switch I away from the nucleotide breaking polar contacts with Y32 and the GppNHp γ-phosphate. d) Distinct coordination states are representative of active (GppNHp State 2) and inactive forms of Ras (GDP and GppNHp State 1). 2C07 induces a new Mg2+ coordination distinct from previous structures.
In order to determine the co-crystal structure of 2C07 bound to the GppNHp bound state, we turned to the 1–166 H-Ras(M72C) construct as more H-Ras GppNHp structures have been reported in the PDB, and there was negligible difference in 2C07 labeling between truncated K and H-Ras isoforms (Figure 1b) (Burns et al., 2014; Johnson et al., 2016). Using a truncated 1–166 H-Ras(M72C) construct containing all endogenous cysteines, we obtained a 2.2 Å resolution co-crystal structure of 2C07 bound to H-Ras(M72C) GppNHp (PDB: 5VBZ). To our knowledge, this is the first structure of a drug-like fragment bound to active Ras (Kauke et al., 2017). The unit cell contains three Ras molecules with complete density for 2C07 present in Chain C, which is shown in Figure 2b. We also obtained a 1.57 Å co-crystal structure of 2C07 bound to H-Ras(M72C) GDP (PDB: 5VBE) and found minimal differences between this structure and the 2C07 K-Ras(M72C) GDP Cys-light structure (Figure S3), which supports the similar labeling efficiency of 2C07 across different Ras isoforms. Figure 2c shows the major structural differences between the H-Ras(M72C) 2C07 bound GDP and GppNHp states. The binding pose of 2C07 is not significantly altered except for a slight rotation out of the S-IIG along the axis of the trifluoromethyl group. The switch-II conformation is also similar with a slight disordering and loss of α-helical secondary structure for the α2-(switch-II) helix in the GppNHp structure. It appears that the switch-II structural changes needed to form the S-IIG are relatively conserved in both nucleotide states. Surprisingly, switch-I is significantly altered by 2C07 in the GppNHp crystal structure.
In multiple K- and H-Ras GppNHp crystal structures, both switch regions form essential polar contacts between the GppNHp γ-phosphate mediated by Gly 60 of switch-II and Thr 35, and Tyr 32 of switch-I (Ostrem et al., 2013; Ostrem and Shokat, 2016). These three residues have been implicated in GTP binding and effector signaling in previous mutational studies (Ford et al., 2005; Hall et al., 2001; Spoerner et al., 2001). In the GppNHp state, 2C07 binding to the S-IIG causes a drastic movement of switch-I away from the nucleotide thereby breaking the network of polar contacts important for switch-I adoption of the canonical “GTP state.” The critical hydroxyl group of Tyr 32 no longer coordinates the γ-phosphate and the entire residue is distal from the nucleotide (Figure 2c). Gly 60 could not be modeled, which suggests this region is likely destabilized and highly flexible. Most striking is the change in Thr 35’s conformation, which results in alteration of the highly conserved Mg2+ coordination in the GTP state.
Two distinct states of Mg2+ coordination in the GTP state of Ras have been identified and linked to divergent Ras effector binding interactions (Kalbitzer et al., 2009; Matsumoto et al., 2016; Spoerner et al., 2001; 2004). Figure 2d shows the changes in Mg2+ coordination that occur between the two GppNHp bound states (Muraoka et al., 2012). 31P NMR and crystallographic studies have demonstrated that activated Ras exists in one of two states (State 1 and State 2) that differ in the alternative coordination of Mg2+ through either the hydroxyl of Thr 35 (State 2) or an ordered water molecule (State 1) (Spoerner et al., 2004). This difference leads to a significant reordering of switch-1, which alters the presentation and conformation of the Ras effector region. Previously characterized mutants, G60A and T35S, each bias activated Ras towards State 1, which has been correlated with decreased effector binding to Raf-1 kinase compared to State 2 (Ford et al., 2005; Muraoka et al., 2012). In the 2C07 bound H-Ras(M72C) GppNHp structure, we observe a new Mg2+ coordination by Thr 35 where the hydroxyl and carbonyl backbone each displace an ordered water to form contacts with magnesium (Figure 2d). The co-crystal structure of 2C07 H-Ras GppNHp reveals unexpectedly that some ligands have access to switch-II in both nucleotide states and those that bind the GppNHp state can allosterically alter switch-I mediated nucleotide interactions, which are over 13 Å removed from the ligand.
Hydrogen Deuterium Exchange Mass Spectrometry (HDX-MS) Analysis of 2C07 Bound to the GppNHp State of Ras
To rule out the possibility that our crystallographic evidence for 2C07 induced allosteric changes in switch-I in the GppNHp state are the result of crystallographic packing interactions, we next characterized the dynamics of 2C07-bound structures in solution using hydrogen deuterium exchange mass spectrometry (HDX-MS). HDX-MS measures the exchange of amide hydrogens in solution and, as their rate of exchange is mediated by their involvement in secondary structure, it is an excellent probe of protein conformational dynamics. This technique offers a strong complement to our X-ray crystallographic analysis as it is not influenced by crystal packing, offers time resolved information on protein dynamics, and has been used previously to study ligand binding to the S-IIP (Fowler et al., 2016; Gallagher and Hudgens, 2016; Lu et al., 2017; McGregor et al., 2017; Vadas and Burke, 2015). We therefore utilized HDX-MS to complement our static X-ray structure data and to explore the structural and dynamic differences between both 2C07 bound nucleotide states in solution.
As a point of reference for H/D exchange, we first compared the difference in deuterium incorporation between unlabeled H-Ras(M72C) GDP and GppNHp. Numerous regions in H-Ras(M72C) showed decreases in deuterium exchange in the presence of GppNHp compared to in the presence of GDP (Figure 3a). Comparing the crystal structures of GppNHp and GDP loaded H-Ras revealed differences in deuterium incorporation decreased significantly for regions that are more structured and less dynamic in the GppNHp state, as expected. The largest decrease in exchange was in switch-II, which has increased alpha helical structure, as well as regions of switch-I that form stabilizing polar contacts with the γ-phosphate. Portions of the central β-sheet, which connect both switch regions, and the α3 helix also had decreased deuterium incorporation. This investigation validated our HDX-MS approach and confirmed the M72C mutation does not significantly disturb the structure, conformation, or dynamics normally associated with nucleotide exchange in WT Ras. Therefore, there are negligible structural and conformational differences between previously published WT H-Ras crystal structures and the H-Ras(M72C) mutant.
Figure 3. HDX-MS Supports 2C07 Crystallographic Binding Pose in Both Nucleotide States.
a) Change in % deuterium incorporated between H-Ras(M72C) GDP and H-Ras(M72C) GppNHp displayed on H-Ras(WT) GppNHp (PDB: 5P21, Figure S5). b) Change in % deuterium incorporated between H-Ras(M72C) GDP and H-Ras(M72C) GDP 2C07 displayed on the H-Ras(M72C) GDP 2C07 crystal structure. c) Change in % deuterium incorporated between H-Ras(M72C) GppNHp and H-Ras(M72C) GppNHp 2C07 displayed on Chain C of the H-Ras(M72C) GppNHp 2C07 crystal structure. All reported differences are the highest % deuterium difference across a 300 sec time course and are assigned a color based on the corresponding legend. All colored regions indicated as either an increase or decrease were tested for significance by a two-tailed T-test and had a p value < 0.05. The full list of all peptides and their deuterium exchange values used for this figure are shown in Figure S4.
When comparing the change in deuterium incorporation between H-Ras(M72C) GDP and the 2C07 modified protein, we observed both significant increases and decreases in H/D exchange rates (Figure 3b). The α3 helix directly beneath the ligand as well as portions of the central beta sheet closest to the binding site exhibited decreased deuterium incorporation. Decreased deuterium exchange was also observed for portions of the nucleotide-binding pocket, which suggests 2C07 binding can increase shielding in regions outside of the S-IIG. Additionally, there was a small increase in H/D exchange radiating out from 2C07 in the other direction near the end of the α3 helix and the beginning of the next β-sheet. Overall the HDX-MS results support our crystallographic model of 2C07 binding to the GDP bound state.
When comparing the change in deuterium incorporation between the H-Ras(M72C) GppNHp and the 2C07 modified state, we see a significant increase in deuterium incorporation in both switch regions. This suggests a large increase in switch dynamics and exposure to solvent after compound binding (Figure 3c). The largest increases in deuterium exchange occur in portions of switch-I that are responsible for coordinating Mg2+ and the γ-phosphate as well as the central beta sheet, which connects to the nucleotide binding pocket. This data supports our crystallographic analysis in which 2C07 binding results in an alternative coordination of Mg2+, which induces switch-I to disengage from the nucleotide and move into a less shielded environment. We also detected an increase in deuterium incorporation for the switch-II helix near Cys 72, indicating increased flexibility in the vicinity of 2C07 binding. This is consistent with the x-ray structure showing that 2C07 wedges underneath and pushes the switch outward, which results in a loss of helical character for a large portion of the α2-(switch-II) helix. The increase in deuterium exchange for the central beta sheet indicates that even while 2C07 binds in this region, it still results in destabilization possibly suggesting that it is not an optimal binder to the S-IIG in the GppNHp state. The combination of x-ray co-crystal structures and HDX may aid development of future 2C07 derivatives that better engage the GTP state by prioritizing compounds that destabilize switch-I while not destabilizing the central beta sheet and α3 helix.
2C07 Binding Alters Nucleotide Preference, Inhibits Ras Binding to SOS and Prevents Catalytic Activation of Ras by SOS in vitro
To determine whether the structural changes we observed might influence Ras activity in vitro, we assessed the influence of 2C07 on Ras binding to a portion (Raf-1-RBD, residues 52–131) of the effector Raf, preference for nucleotide under various GppNHp/GDP concentrations, and the effect of 2C07 on SOS catalyzed nucleotide exchange. Based on the large changes to H-Ras(M72C) GppNHp induced by 2C07, we anticipated a decrease in Raf-1-RBD binding. However, no significant difference in Raf-1-RBD binding was observed between 2C07 labeled and unlabeled protein (Figure 4a). Co-crystal structures of active Ras bound to the Raf-1-RBD (RBD residues 52–131 and Cysteine Rich Domain (CRD) residues 139–184) show binding interactions occur exclusively between the RBD and switch-I residues with no ordering of the CRD domain (Figure S7) (Fetics et al., 2015a). Perhaps the allosteric disruption of switch-I by 2C07 as seen in our co-crystal structure and HDX-MS analysis is not significant enough of a perturbation to overcome the tight binding between active Ras and the Raf-1-RBD. Previous investigations have reported the Kd of Raf-1-RBD binding to be less than 20 nM (Fetics et al., 2015a; Thapar et al., 2004), which may effectively out-compete the 2C07-induced allosteric disruption of switch-I. Modifications to 2C07 may lead to a more stable interaction with the S-IIG, while maintaining a stronger disruption of the active state of switch I, leading to inhibition of Raf effector binding.
Figure 4. Pull-down Studies Demonstrate 2C07 Preserves H-Ras(M72C) Binding to Raf, Shifts Intrinsic Nucleotide Preference Towards the GDP State, and Prevents SOS Binding and Catalyzed Nucleotide Exchange.

In b) through d), normalized pull-down signals are shown below the blot. S.E.M for each signal, number of replicates, and α values for each comparative Standard T-Test are summarized in Figure S6. Values that are significantly different (α ≤ .05) from one another are bolded. Comparative statistics were done for normalized pull-down signals between protein constructs of the same condition (i.e. in b) and c), column 1 for unlabeled and 1 for labeled protein, 2 for unlabeled and 2 for labeled, and so on were statistically compared, and in d) only the +SOScat and +GppNHp lanes were compared across protein constructs). a) Cartoon representation of pull down protocol. Raf-1-RBD pull-down of H-Ras(M72C) GppNHp and H-Ras(M72C) 2C07 GppNHp at various concentrations of H-Ras demonstrate 2C07 does not inhibit Raf binding. Reported values are quantified pull-down signals normalized to input. b) Cartoon representation of pull down protocol. EDTA catalyzed exchange and subsequent pull down of H-Ras(M72C) GppNHp and H-Ras(M72C) GppNHp 2C07 by Raf-1-RBD demonstrates that 2C07 alters Ras nucleotide preference. c) Cartoon representation of pull down protocol. SOScat pull-down of H-Ras(M72C) GDP at various concentrations of H-Ras demonstrates 2C07 inhibits SOS binding. d) Cartoon representation of pull down protocol. Ras activation is achieved by catalyzing nucleotide exchange by SOScat and indirectly reading out activated Ras by subsequent pull down by Raf-1-RBD. 2C07 inhibits SOScat catalyzed nucleotide exchange.
We next investigated how 2C07 binding affects intrinsic nucleotide preference and Ras activation. Incubating H-Ras(M72C) GDP with varying ratios of GDP : GppNHp at a constant total nucleotide concentration, we observed dose dependent exchange of GDP for GppNHp by EDTA catalyzed exchange. The total activated (GppNHp bound) Ras was measured indirectly by Raf-1-RBD pull down. Figure 4b illustrates that H-Ras(M72C) GDP exhibits a dose dependent increase in Raf-1-RBD pull down as the relative ratio of GppNHp to GDP is increased. When we performed the same assay with 2C07 bound Ras, we observed decreased Raf-1-RBD pull down even at high ratios of GppNHp to GDP, although the pull-down efficiency with only GppNHp present remained the same. These results suggest that 2C07 bound Ras has a nucleotide preference for GDP over GppNHp. Therefore, 2C07 retains the GDP trapping mechanism of the original G12C targeting electrophiles while expanding engagement to the active, GTP state (Lito et al., 2016; Ostrem et al., 2013; Patricelli et al., 2016).
We next investigated the effect of 2C07 on the ability of SOS, the Ras cognate guanosine exchange factor (GEF), to catalyze nucleotide exchange. In contrast to Raf-1-RBD, which only contacts switch-I, co-crystal structures of Ras-SOS show contacts with both switch-I and –II, implying that 2C07 might in fact be able to disrupt this interaction. We first asked if 2C07 interferes with Ras/GEF binding by utilizing His6 tagged SOScat to pull down Ras (Hall et al., 2001). Figure 4c shows that 2C07 diminishes the efficiency of Ras pull down by SOS. This is consistent with structural analysis of Ras-SOS structures that demonstrate the importance of key contacts in switch-II as essential for SOS binding (Hall et al., 2001). Since 2C07 binds underneath switch-II and raises the α2-(switch-II) helix upward, the switch may be less able to engage with SOS resulting in reduced binding. Since SOS mediated nucleotide exchange may still occur despite reduced binding affinity for Ras-2C07, we asked if SOS catalyzed exchange is directly affected by 2C07 binding. We reconstituted the nucleotide exchange cycle in vitro by utilizing untagged SOScat and His6 tagged Raf-1-RBD. After incubating constant concentrations of GDP-bound H-Ras (WT, M72C, or M72C-2C07) GDP, SOScat, and GppNHp, the amount of Ras activation was measured indirectly by Raf-1-RBD pull down. Lanes 1–3 and 4–6 in Figure 4d confirm that SOS and GppNHp are both necessary for H-Ras and H-Ras(M72C) pull down by Raf-1-RBD, respectively. However, 2C07 modified H-Ras(M72C) is significantly compromised in SOS mediated exchange compared to unlabeled H-Ras(M72C).
Electrophiles Derived from 2C07 Modify H-Ras(M72C) in Both Nucleotide States, Inhibit PI3K Activation and Bind Reversibly in Competition Labeling Studies
SOS inhibition supports that 2C07-induced switch-II changes are sufficient to inhibit GDP-dependent effector binding. In the 2C07 bound GppNHp state, similar changes to switch-II occur as well as additional allosteric disruption of switch-I (Figure 2b and 3c). However, this allosteric change was not sufficient to inhibit Raf-1-RBD binding, which interacts exclusively with switch-I (Figure 4a, Figure S7). The crystal structure of active Ras bound to PI3K-γ (PDB: 1HE8) suggests this GTP-dependent effector, unlike Raf-1-RBD, forms essential interactions with both switches for binding and activation (Pacold et al., 2000). We therefore hypothesized that 2C07 would have a larger effect on PI3K activation compared to Raf-1-RBD binding. Until recently, assessment of Ras activation of PI3K has been exceedingly difficult to reconstitute in vitro since membrane localization is required for Ras to be presented to PI3K (Siempelkamp et al., 2017). Membrane attachment of full length Ras through the reaction of C118 with maleimide functionalized lipids provided a means to assess if occupancy of the S-IIG affects PI3K activation. However, the irreversible maleimide chemistry is incompatible with a disulfide attachment of 2C07 to Ras(M72C). Thus, to successfully test PI3K activation, we required an irreversible covalent 2C07 analog to obviate complications due to the reversible nature of the disulfide in the presence of reductant.
Our tethering screen relied on the positioning of the engineered cysteine to select fragments that bind distal to the nucleotide-binding site in sub-pocket 3 of the S-IIP. After reviewing both 2C07 crystal structures, it was apparent that improvements to the flexible methylene linker could provide further interactions with sub-pocket 3 and potentially improve binding. The overlay between ARS-853 and 2C07 in Figure 1f shows a significant portion of the 2C07 linker overlays with the phenol ring of ARS-853, which is critical for ARS-853 binding. Taking advantage of existing crystallographic data and SAR information from G12C specific electrophiles, we modified 2C07 to contain a phenylenediamine linker to mimic ARS-853’s phenol motif. This yielded a series of 2C07-based electrophiles, which are summarized in Figure 5a. Percent modification was monitored for each derivative by whole protein LC/MS against 4 μM H-Ras(M72C) bound to either GDP or GppNHp with 100 μM electrophile for 24 hours. Placement of the electrophile was extremely important for successful targeting of Cys 72. In particular, acrylamides in a p-phenylenediamine linker had no detectable labeling (Compound 1) while a m-phenylenediamine linker had a significant increase (Compound 2). Furthermore, the introduction of a 5-chloro substitution to 2, also improved covalent binding (Compound 3). Additional labeling kinetics demonstrate 3 also rapidly and fully labels the GDP state while significantly modifying the GppNHp state (88.7% (+/− 0.3%)) at a much lower electrophile concentration of 20 μM (ie. 1:5 Ras to Compound 3) (Figure 5b). Labeling studies were conducted using the 1–166 H-Ras(M72C) construct containing all endogenous cysteines and only one covalent modification was observed for all electrophiles. Trials using full-length Ras constructs also showed no off target labeling (data not shown). Pull-down experiments were also conducted with H-Ras(M72C) pre-labeled with Compound 2 and, like 2C07, did not inhibit Raf-1-RBD binding as expected (Figure S8).
Figure 5. Electrophiles Derived from the 2C07 Scaffold Readily Modify Ras(M72C) in both Nucleotide States.

a) Covalent modification of H-Ras(M72C) bound to GDP and GppNHp monitored by whole protein LC/MS. b) Time-course of Compound 3 labeling of H-Ras(M72C) GDP and GppNHp monitored by whole protein LC/MS. c) Specific activities of PI3K-δ activated by an RTK derived phosphopeptide in the presence or absence of GTPγS loaded H-Ras constructs as indicated in the legend. Assays measured the production of ADP in the presence of 1–600 nM of PI3K-δ, 100 μM ATP, 0.45 mg/mL 5% PIP2/10% PE-MCC/15% PC/30% PS/40% PE vesicles, 1 μM PDGFR pY (735–767, phosphorylated at pY740,751) and 1.3–1.5 μM membrane-bound H-Ras. Kinase assays were performed in triplicate (error shown as SD; n=3). d) Competition time course of Compound 3 labeling of H-Ras(M72C) GDP in the presence of varying concentrations of reversible Compound 4 with initial velocities, V0 (%/h), calculated per condition.
Compound 3 is a 2C07 derivative that retains selectivity for Cys 72, and targets both nucleotide-bound states making it a suitable irreversible ligand to test in our PI3K activation assay. To interrogate how S-IIG binders affect active Ras signaling, we screened the ability for Compound 3 to inhibit phosphoinositide 3-kinase (PI3K) activation. We used a covalently coupled H-Ras PI3K activation assay, with H-Ras coupled through its C-terminal cysteine to maleimide functionalized lipids present in vesicles mimicking the composition of the plasma membrane. We examined the activation of full-length p110δ/p85α (referred to afterwards as PI3K-δ) by H-Ras-GTP in the presence of a receptor tyrosine kinase derived phosphopeptide. Experiments were carried out under three conditions: PI3K-δ in the absence of H-Ras, PI3K-δ with H-Ras(G12V), and H-Ras(G12V/M72C) coupled to compound 3. The presence of H-Ras(G12V) led to a ~20 fold activation of PI3K-δ activity, similar to previous results, however, PI3K-δ was only weakly activated by H-Ras(G12V/M72C) bound to Compound 3 (~3 fold) (Fig. 5D)(Siempelkamp et al., 2017). These results demonstrate that H-Ras modified with S-IIG binders are unable to fully activate PI3K-δ downstream of Ras. Interrogation of the structure of H-Ras bound to PI3K-γ as well as the Raf-1-RBD revealed a potential mechanism for this selectivity (Figure S7) (Fetics et al., 2015b; Pacold et al., 2000). When comparing both effector structures, it is evident that the 2C07-induced switch-II conformation is well tolerated in the Ras/Raf-1-RBD (Figure S7). In this model, there is sufficient space to accommodate the movement of the α2-(switch-II) helix without disrupting key switch-I binding interactions to Raf-1-RBD (Figure S7). However, in the Ras/PI3K-γ structure, movement of the α2-(switch-II) helix would result in significant clashes and loss of key PI3K-γ binding interactions. This data supports that targeting the S-IIG in active Ras is inhibitory and significantly affects effectors that require direct interactions with switch-II for activation. Thus, S-IIG binders retain the GDP trapping mechanism of the original K-Ras(G12C) binders while expanding inhibition to the active GTP state where switch-II dependent effectors, like PI3K, are inhibited.
The availability of an irreversible covalent ligand for the S-IIG of H-Ras(M72C) provided the opportunity to carry out a competition binding experiment for non-covalent binding to the site. The readout for reversible ligand binding is dependent on competition for covalent attachment of Compound 3 to H-Ras(M72C). A similar screening platform has been exploited using irreversible activity based protein profiling (ABPP) probes in competition with reversible inhibitors against multiple protein families (Adibekian et al., 2012; Bachovchin et al., 2009; Carelli et al., 2015; Zhao et al., 2017). At long time points the irreversible ligand will always predominate, so we measured competition at multiple time points. One caveat of this assay system is its requirement for H-Ras(M72C) rather than native K- or H-Ras. We synthesized a non-electrophilic derivative of 3 (Compound 4). The competition labeling experiment is summarized in Figure 5c where a constant concentration (20 μM) of 3 was co-incubated with varying concentrations of 4. Labeling kinetics are reported as % labeled per hour against 4 μM H-Ras(M72C) GDP. This experiment shows a dose dependent decrease in the rate of 3 labeling in the presence of higher concentrations of 4. This is the first evidence of a reversible compound competing with an irreversible switch-II binder for Ras engagement (McGregor et al., 2017; Patricelli et al., 2016). We also tested Compound 4’s ability to reversibly bind WT H-Ras by BioLayer Interferometry (BLI), but were unable to detect measurable binding. These results show 2C07 is a potential starting point for the development of reversible inhibitors of H-Ras.
In the past five years, significant advances have led to the discovery of direct inhibitors of Ras. Several distinct regions of the protein have been proposed as sites for allosteric inhibition (McCormick, 2016; Ostrem and Shokat, 2016; Stephen et al., 2014). The cardinal feature of current K-Ras(G12C) S-IIP binders is their inability to access the GTP bound state. Our study suggests that the dynamics of switch-II allow access to fragments, which bind in a new region under switch-II, termed the S-IIG. The current covalent S-IIG binding ligands are not able to block Raf-1-RBD binding, thus necessitating further modifications to target this important RAS effector. The current ligands do however block SOS mediated exchange, which is known to be highly sensitive to switch-II loop mutations (Hall et al., 2001). Electrophiles derived from 2C07 target both nucleotide states and demonstrate the first evidence of reversible binding through competition labeling experiments. Furthermore, our S-IIG binders inhibit PI3K activation by directly targeting Ras-GTP, but do not affect Raf-1-RBD binding, which has never been demonstrated before. Perhaps selecting for binders that more drastically alter switch-I and potently stabilize the S-IIG could expand effector inhibition to Raf as well. Our work thus expands the diversity of ligands that bind to Ras, and more importantly, demonstrates accessibility and inhibition of the active GTP state, which is most abundant in oncogenic Ras transformed cells.
Significance
Since the discovery of Ras and its ability to drive tumor growth, Ras continues to inspire efforts to better understand and treat cancer. The small GTPase K-Ras is the most frequently mutated oncogene, and its high nucleotide affinity and lack of druggable pockets have made direct inhibitors difficult to develop. Recently, covalent inhibitors of K-Ras(G12C) were discovered that are GDP specific and rely on covalent attachment to Cys 12 to bind the switch-II pocket (S-IIP) and inhibit signaling. These limitations are problematic since a majority of Ras-driven cancers express non-cysteine mutations and are predominately GTP bound. Using previously published structures and SAR from various S-IIP binders, we designed a tethering screen to a non-native cysteine to select fragments free from these limitations. This screen yielded fragment 2C07, which binds to both nucleotide states and expands the S-IIP into a new groove away from the nucleotide, which we termed the Switch-II Groove (S-IIG). Herein we provide a structural model for the S-IIG in both nucleotide states through the combination of crystallography and hydrogen deuterium exchange mass spectrometry. We present the first active Ras structure bound to an inhibitory small molecule, which demonstrates switch-II pockets are dynamic and accessible in both nucleotide states. Through in vitro biochemical assays, we confirmed 2C07 retains the GDP trapping mechanism of the K-Ras(G12C) binders and expands inhibition to the GTP state preventing PI3K activation. We further validated 2C07 by developing irreversible covalent electrophiles that potently target Cys 72 in both states and serve as occupancy probes for reversible engagement. A reversible derivative of our best occupancy probe provided the first evidence of a reversible compound competing with an irreversible switch-II binder. Fragment 2C07 and the S-IIG may guide the development of more potent, fully reversible Ras inhibitors that bind regardless of nucleotide state.
STAR★Methods
Contact for Reagent and Resource Sharing
Further information and requests for resources and reagents should be directed to and will be fulfilled by the Lead Contact, Kevan Shokat (Kevan.Shokat@ucsf.edu).
Experimental Model and Subject Details
All recombinant proteins herein were expressed and purified from BL21(DE3) E. coli. Please refer to the specific protein purification protocols below in the Method Details section for growth, induction, and purification procedures.
Method Details
General Ras Protein Purification Protocol for Crystallography and In Vitro Studies
His6-tagged recombinant bacterial codon optimized human K-Ras (isoform 2, residues 1–169), K-Ras Cys Light (isoform 2, residues 1–169, C51S/C80L/C118S), K-Ras (isoform 2, residues 1–189), and H-Ras (residues 1–166) were transformed into Escherichia coli (BL21 (DE3)) for expression. The M72C mutation was introduced into each vector using the standard QuikChange™ PCR protocol (Li et al., 2008). The plasmids used and the expression/purification protocol for all aforementioned constructs were previously published in the methods section of Ostrem et al., 2013.
Isolation of Fully Modified Ras(M72C) 2C07 for Crystallographic and Hydrogen Deuterium Exchange Mass Spectrometry (HDX-MS)
Large-scale labeling reactions were set to isolate enough protein for screening crystal conditions and setting trays for XTAL collection (usually between 8–10 mg of total protein). Labeling reactions were done with 150 – 200 μM Ras protein and 400 μM 2C07 in gel filtration buffer (20 mM HEPES (pH 7.5), 150 mM NaCl) supplemented with 5 mM MgCl2, 200 μM βME, and a total DMSO of 5% by volume. Reactions were kept at 4 °C and monitored for completion by LC/MS. The percent modification was analyzed by electrospray mass spectrometry using a Waters Acquity UPLC/ESI-TQD with a 2.1 × 50 mm Acquity UPLC BEH300 C4 column. Once complete, reactions were cleared by ultracentrifugation, concentrated, and purified by gel filtration using gel filtration buffer with added reductant. Pure labeled protein was concentrated (8 – 12 mg/mL) and immediately used for crystallography or prepped for HDX-MS.
All samples analyzed by HDX-MS were dialyzed overnight into the same preparation of gel filtration buffer using Slide-A-Lyzer MINI Dialysis units. Samples were recovered from the dialysis unit, and sample concentrations were determined by Bradford. Samples were normalized to 1 mg/mL and immediately snap frozen in liquid nitrogen prior to analysis by HDX-MS.
Nucleotide Exchange Protocol
This procedure was adapted from Ostrem et al., 2013 who created their protocol from prior studies (Ahmadian et al., 1999; John et al., 1990b; Maurer et al., 2012). As an example, to make the H-Ras(M72C) GppNHp protein bound to 2C07 for crystallography, 3.0 mL of partially purified protein (anion-exchange only) at ~3 mg/mL (~9.0 mg total, ~0.15 mM) 6 mg of GppNHP (4 mM final) was added along with 25 mM EDTA (Diluted from a .5M EDTA pH 8.0 buffered stock). After incubation for 1h at room temperature slowly rotating, the solution was concentrated to less than 2.5 mL and was buffer exchanged using a PD-10 column into phosphatase compatible buffer at 4 °C (32 mM Tris pH=8, 200 mM ammonium sulfate, 0.1 mM zinc chloride). To the 3.5 mL eluted buffer exchanged sample 30 units of calf intestine alkaline phosphatase was added, along with 4 mg more of GppNHp. After slowly rotating for 1 hour at 4 °C, 30 mM (final) magnesium chloride was added, the protein was concentrated using an Amicon-4 (10,000 MWCO) concentrator to approximately 1 mL and purified by gel filtration as previously described in the General Ras Protein Purification Protocol.
SOScat (residues 566–1049) Protein Purification Protocol
The SOScat purification protocol was previously described and slightly modified to isolate both pure SOScat and His6-tagged SOScat for pull down assays (Sondermann et al., 2004). To purify protein containing the His6 tag, a portion was dialyzed after elution from Ni-NTA beads without TEV protease. Due to the tag’s effect on the isoelectric point (pI), the ion exchange chromatography step was omitted and the final purification step after batch binding and dialysis was gel filtration using a Superdex 200 column (10/300 GL). All proteins were concentrated to approximately 15–20 mg/mL, aliquoted, snap frozen in liquid nitrogen, and stored at −80 °C.
Raf-1-RBDwitt (residues 52–131) Protein Purification Protocol
Dr. Bill Gillette (Leidos Biomedical and the National Cancer Institute Ras Initiative) graciously provided the Raf-1-RBDwitt expression plasmid (R702-X66-566) as well as the procedure for its expression and purification. The following is an adaptation of Dr. Bill Gillette’s protocol. Recombinant bacterial codon optimized His6-MBP-TEV-Raf1-RBDwitt (residues 52–131) was transformed into Escherichia coli (BL21 (DE3)) for expression. The same induction protocol used to express Ras in Ostrem et al. 2013 was used for Raf-1-RBDwitt. A similar lysis and purification procedure was used omitting the ion exchange chromatography purification step with the following amended buffers: Lysis Buffer: 20 mM HEPES (pH 7.3), 300 mM NaCl, 35 mM imidazole, 1 mM TCEP, protease inhibitor cocktail (Roche complete EDTA free). Elution Buffer: Lysis Buffer containing 500 mM imidazole, pH 7.3. Dialysis/TEV/Gel Filtration Buffer: 20 mM HEPES (pH 7.3), 300 mM NaCl, 1 mM TCEP. For the Raf-1-RBDwitt pull down assay it was necessary to purify protein containing the His6 tag so a portion was dialyzed without TEV protease and purified by gel filtration using a Superdex 75 column (10/300 GL). All proteins were concentrated to approximately 15–20 mg/mL, aliquoted, snap frozen in liquid nitrogen, and stored at −80 °C.
Tethering Screen by LC/MS Whole Protein Mass Spectrometry
This procedure was adapted in full from Ostrem et al., 2013. Untagged recombinant 1–169 K-Ras(M72C) GDP at 4 μM was allowed to react with 100 μM tethering fragment and 1 mM βME in 20 mM HEPES, pH 7.5, 150 mM NaCl, and 10 mM EDTA. The total reaction volume for each tethering reaction was 25 μL and 2% DMSO by volume. Reactions were conducted in 96 well plate format and analyzed individually by LC/MS after equilibrating for 1h shaking at room temperature. The percent modification was analyzed by electrospray mass spectrometry using a Waters Acquity UPLC/ESI-TQD with a 2.1 × 50 mm Acquity UPLC BEH300 C4 column. Using a threshold of ≥ 50% modification, we achieved a 1.6 % hit rate.
Chemical Synthesis and Characterization of 2C07 and its Derivatives
General Methods for Chemical Synthesis
All solvents and chemical reagents were purchased from commercial sources and used as provided. 1H spectra were obtained on either a Bruker Avance DRX 400 or 500 MHz NMR spectrometer as specified, and all 13C NMR were obtained on a Bruker Avance DRX 500 NMR spectrometer. NMR chemical shifts are reported in δ (ppm) relative to internal solvent peaks and coupling constants were measured in Hz. 1H splitting patterns are reported as s (singlet), d (dublet), dd (dublet of dublets), t (triplet), q (quartet), and m (multiplet). NMR spectra were processed and analyzed using MNova NMR software. Low resolution LC/MS analysis of purified compounds was performed on a Waters Acquity UPLC/ESI-TQD instrument with a 2.1 × 50 mm Acquity UPLC BEH C18 column (Product #: 186002350). Silica chromatography was performed on a Teledyne CombiFlash Rf+ instrument. All reverse phase high performance liquid chromatography (RP-HPLC) was performed on a Waters 2545 binary gradient module equipped with an XBridge prep C18 column using H2O + 0.1% formic acid and CH3CN + 0.1% formic acid (5–95% gradient) while monitoring peak collection at 254 nm.
Synthesis of S1–4: tert-butyl (3-((2-(dimethylamino)ethyl)disulfanyl)propyl)carbamate

[S1-1]: 3-chloropropylamine-HCL (5 g, 38.46 mmole, 1.0 equiv) was dissolved in 20 mL dry DCM under inert atmosphere. DIPEA (5.47g, 42.31 mmole, 1.1 equiv) was added via syringe at room temperature to the stirring mixture. When the solution was clear and all reagents solubilized, the reaction mixture was cooled to 0 °C. Under inert atmosphere, boc-anhydride (8.4 g, 38.49 mmole, 1.1 equiv) was dissolved in 5 mL dry DCM. This solution was added slowly to the stirring solution of 3-chloropropylamine-HCL at 0 °C. After addition, the solution was allowed to warm up to R.T. and mix for 5 hrs while monitoring for completion by TLC and LC/MS. Upon completion, 25 mL of H2O was added to the reaction at ambient atmosphere while mixing. The mixture was then diluted, transferred to a seperatory funnel, and the water layer extracted into DCM (3 × 20 mL). The organic layer was dried over Na2SO4, filtered, and evaporated to dryness to afford a crude powder. The product was purified by Hex : EtOAc silica chromatography using a CombiFlash purification system. Product eluted at 2 : 1 Hex : EtOAc and collected fractions were evaporated to dryness to afford S1-1 as a white powder (MW: 193.67 g/mol, 6.08 g, 82% yield).
1H NMR (400 MHz, CDCl3): 3.58 (t, J = 6.4 Hz, 2H), 3.27 (m, 2H), 1.96 (m, 2H), 1.43 (s, 9H).
[S1–2]: S1-1 (557 mg, 2.876 mmole, 1 equiv) was dissolved in 2 mL dry DMF under inert atmosphere. To this solution, potassium thioacetate (548 mg, 3.164 mmole, 1.1 equiv) was added as a powder to the stirring reaction mixture. The reaction was allowed to go overnight and monitored for completion by TLC and LC/MS. The reaction mixture was diluted with 20 mL EtOAc and transferred to a seperatory funnel. The organic layer was washed with 3 × 20 mL saturated NaCl solution. The organic layer was dried over Na2SO4, filtered, and evaporated to dryness to afford a crude yellow oil (MW: 233.33 g/mol, 400 mg, 60% yield), which was of sufficient purity for the next step.
1H NMR (400 MHz, CDCl3): 3.12 (m, 2H), 2.86 (t, J = 7.0 Hz, 2H), 2.3 (s, 3H), 1.71 (m, 2H), 1.40 (s, 9H).
[S1–3]: S1–2 (400 mg, 1.71 mmole, 1 equiv) was dissolved in 5 mL of methanolic NaOH (5 g of NaOH powder in 5 mL of MeOH). To the slurry mixture, I2(s) (70.8 mg, .56 mmole, .3 equiv) was added. The reaction mixture was left at ambient atmosphere at R.T. overnight while monitoring for completion by TLC and LC/MS. Upon completion, 20 mL of H2O was added to the reaction to dissolve any solid NaOH, the mixture was transferred to a seperatory funnel, and the water layer was extracted into EtOAc (3 × 20 mL). The organic layer was dried over Na2SO4, filtered, and evaporated to dryness to afford a crude oil. The product was purified by Hex : EtOAc silica chromatography using a CombiFlash purification system. Product eluted at 1 : 1 Hex : EtOAc and collected fractions were evaporated to dryness to afford S1–3 as a light yellow oil (MW: 380.57 g/mol, 182.5 mg, 56% yield).
1H NMR (400 MHz, CDCl3): 3.25 (m, 4H), 2.73 (t, J = 7.2 Hz, 4H), 1.90 (m, 4H), 1.46 (s, 18H)
[S1–4]: S1–3 (60.6 mg, .159 mmole, 1 equiv) was dissolved in 3 mL of 1 : 1 : 1 H2O : TEA : DMF. To this stirring solution, 2-(Dimethylamino)ethanethiol HCL was added (243.5 mg, 1.27 mmole, 8 equiv) with TCEP (16 mg, .064 mmole, .4 equiv). The solution was then heated to 70 °C and let react overnight while monitoring for completion by TLC and LC/MS. When complete, the reaction mixture was separated by RP-HPLC (H2O [.1% TFA] : ACN [.1% TFA]) and lyophilized to afford the product S1–4 as a clear oil (MW: 294.48 g/mol, 52 mg, 56% yield).
1H NMR (400 MHz, CD3OD): 3.14 (m, 2H), 2.90 (m, 4H), 2.74 (m, 2H), 2.48 (s, 6), 1.86 (m, 2H), 1.44 (s, 9)
Synthesis of S2-2: tert-butyl (4-((2-(dimethylamino)ethyl)disulfanyl)butyl)carbamate

[S2-1]: 1. 4-bromobutan-1-amine (420 mg, 1.67 mmole, 1.0 equiv) was dissolved in 2 mL dry DMF under inert atmosphere. To this solution, potassium thioacetate (347 mg, 3.04 mmole, 1.8 equiv) was added as a powder to the stirring reaction mixture. The reaction was allowed to go overnight and monitored for completion by TLC and LC/MS. The reaction mixture was diluted with 10 mL EtOAc and transferred to a seperatory funnel. The organic layer was washed with 3 × 10 mL sat NaCl solution. The organic layer was dried over Na2SO4, filtered, and evaporated to dryness to afford a crude yellow oil.
2. The crude oil was then dissolved in 5 mL of methanolic NaOH (5 g of NaOH powder in 5 mL of MeOH). To the slurry mixture, I2(s) (70.8 mg, .56 mmole, .38 equiv) was added. The reaction mixture was left at ambient atmosphere at R.T. overnight while monitoring for completion by TLC and LC/MS. Upon completion, 20 mL of H2O was added to the reaction to dissolve any solid NaOH, the mixture was transferred to a seperatory funnel, and the water layer was extracted into EtOAc (3 × 20 mL). The organic layer was dried over Na2SO4, filtered, and evaporated to dryness to afford a crude oil. The product was purified by Hex : EtOAc silica chromatography using a CombiFlash purification system. Product eluted at 1 : 1 Hex : EtOAc and collected fractions were evaporated to dryness to afford S2-1 as a light yellow oil (MW: 408.62 g/mol, 207.2 mg, 61% yield over two steps).
1H NMR (400 MHz, CDCl3): 3.15 (m, 4H), 2.70 (m, 4H), 1.73 (m, 4H), 1.60 (m, 4H), 1.45 (s, 18H).
[S2-2]: S2-1 (207.2 mg, .507 mmole, 1 equiv) was dissolved in 3 mL of 1 : 1 : 1 H2O : TEA : DMF. To this stirring solution, 2-(Dimethylamino)ethanethiol HCL was added (998.6 mg, 3.55 mmole, 7 equiv) with TCEP (16 mg, .064 mmole, .13 equiv). The solution was then heated to 70 °C and allowed to react overnight while monitoring for completion by TLC and LC/MS. When complete, the reaction mixture was separated by RP-HPLC (H2O [.1% TFA] : ACN [.1% TFA]) and lyophilized to afford the product S2-2 as a clear oil formic acid salt (MW: 308.5 + 46.03 (FA) g/mol, 95 mg, 26% yield).
1H NMR (500 MHz, (CD3)2SO): 8.21 (s, 1H, HCOOH aldehyde proton), 6.85 (m, 1H), 3.31 (m, 2H), 2.84 (m, 2H), 2.72 (m, 2H), 2.58 (m, 2H), 2.21 (s, 6H), 1.60 (m, 2H), 1.45 (m, 2H), 1.38 (s, 9H).
Synthesis of 2C07: N-(3-((2-(dimethylamino)ethyl)disulfanyl)propyl)-1-(4-methoxyphenyl)-5-(trifluoromethyl)-1H-pyrazole-4-carboxamide
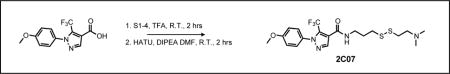
[2C07]: 1. S1–4 (12 mg, .041 mmol, 1 equiv) was dissolved in 1 mL DCM and cooled to 0 °C. To this solution, neat TFA (250 μL, 3.3 mmol, 80 equiv) was added drop wise while stirring. Once added, the reaction was allowed to warm up to R.T. over 2 hrs while being monitored by TLC and LC/MS. When complete, the crude mixture was evaporated to dryness. Once dry, the crude oil was re-suspended in 5 mL toluene and evaporated to dryness three times to remove by azeotrope in vacuo any excess TFA or H2O. This crude oil was then dissolved in .5 mL dry DMF under inert atmosphere.
2. To a separate reaction vessel, 1-(4-Methoxyphenyl)-5-(trifluoromethyl)-1H-pyrazole-4-carboxylic acid (15 mg, .052 mmol, 1.3 equiv) was dissolved in 1 mL dry DMF under inert atmosphere with HATU (24 mg, mmol, 1.5 equiv). While stirring, DIPEA (16 mg, .12 mmol, 3 equiv) was added drop wise at 0 °C. When all the DIPEA was added, it was allowed to sit for 15 minutes. After this, the 1 mL DMF solution containing the crude de-protected S2-2 was added via syringe. This reaction was allowed to warm up to R.T. over the course of 2 hrs and was monitored by TLC and LC/MS. When complete, the reaction mixture was separated by RP-HPLC (H2O [.1% TFA] : ACN [.1% TFA]) and lyophilized to afford the product 2C07 as a white powder formic acid salt (462.55 + 46.04 (FA) g/mol, 14 mg, 67% yield).
1H (500 MHz, (CD3)2SO) δ: 8.60 (m, 1H), 8.18 (s, 1H, HCOOH aldehyde proton), 8.08 (s, 1H), 7.41 (d, J = 8.9 Hz, 2H), 7.10 (d, J = 8.9 Hz, 2H), 3.83 (s, 3H), 3.31 (m, 2H), 2.85 (m, 2H), 2.77 (m, 2H), 2.56 (m, 2H), 2.19 (s, 6H), 1.86 (m, 2H),.
13C (125 MHz, (CD3)2SO) δ: 163.55 (HCOOH carbonyl signal), 160.40, 160.04, 139.18, 131.67, 127.43 (2C), 121.18, 120.49, 118.34, 114.36 (2C), 58.03, 55.60, 44.70 (2C), 37.74, 35.80, 35.24, 28.61.
Synthesis of 2C07b: N-(4-((2-(dimethylamino)ethyl)disulfanyl)butyl)-1-(4-methoxyphenyl)-5-(trifluoromethyl)-1H-pyrazole-4-carboxamide

[2C07b]: 1. S2-2 (10 mg, .032 mmol, 1 equiv) was dissolved in 1 mL DCM and cooled to 0 °C. To this solution, neat TFA (250 μL, 3.3 mmol, 97 equiv) was added drop wise while stirring. Once all the TFA was added, the reaction was allowed to warm up to R.T. over 2 hrs while being monitored by TLC and LC/MS. When complete, the crude mixture was evaporated to dryness. Once dry, the crude oil was re-suspended in 5 mL toluene and evaporated to dryness three times to remove by azeotrope in vacuo any excess TFA or H2O. This crude oil was then dissolved in .5 mL dry DMF under inert atmosphere.
2. To a separate reaction vessel, 1-(4-Methoxyphenyl)-5-(trifluoromethyl)-1H-pyrazole-4-carboxylic acid (14 mg, .049 mmol, 1.5 equiv) was dissolved in 1 mL dry DMF under inert atmosphere with HATU (mg, mmol, equiv). While stirring, DIPEA (6.8 mg, .053 mmol, 1.6 equiv) was added drop wise at 0 °C. When all the DIPEA was added, it was allowed to sit for 15 minutes. After this, the 1 mL DMF solution containing the crude de-protected S2-2 was added via syringe. This reaction was allowed to warm up to R.T. over the course of 2 hrs and was monitored by TLC and LC/MS. When complete, the reaction mixture was separated by RP-HPLC (H2O [.1% TFA] : ACN [.1% TFA]) and lyophilized to afford the product 2C07b as a white powder formic acid salt (476.57 + 46.03 (FA) g/mol, 11 mg, 66% yield).
1H NMR (500 MHz, (CD3)2SO) δ: 8.56 (m, 1H), 8.18 (s, 1H, HCOOH aldehyde proton), 8.05 (s, 1H), 7.40 (d, J = 8.3 Hz, 2H), 7.09 (d, J = 8.3 Hz, 2H), 3.83 (s, 3H), 3.24 (m, 2H), 2.85 (m, 2H), 2.76 (m, 2H), 2.63 (m, 2H), 2.24 (s, 6H), 1.68 (m, 2H), 1.58 (m, 2H),.
13C NMR (125 MHz, (CD3)2SO) δ: 163.55 (HCOOH carbonyl signal), 160.31, 160.04, 139.12, 131.69, 127.43 (2C), 121.30, 120.51, 118.35, 114.37 (2C), 57.80, 55.60, 44.50 (2C), 38.47, 37.46, 35.37, 27.80, 25.96.
Synthesis of 2C07c: N-(3-((2-(dimethylamino)ethyl)disulfanyl)propyl)-1-(4-methoxyphenyl)-1H-pyrazole-4-carboxamide

[S3-1]: 1. Ethyl-4-pyrazole carboxylate (100 mg, .71 mmol, 1 equiv) and 4-methoxy-phenyl boronic acid (110.6 mg, .71 mmol, 11 equiv) were dissolved in 1 mL dry DMF under inert atmosphere and heated to 60 °C. Cu(II) acetate (117.4 mg, .54 mmol, .75 equiv) was dissolved in a mixture of 1 : 1 dry pyridine and DMF (.5 mL : .5 mL) under inert atmosphere. This mixture was then added via syringe to the DMF solution of the carboxylate and boronic acid and the reaction was monitored for completion by TLC and LC/MS. When complete, the reaction was cooled to R.T. and filtered through cotton to remove insoluble Cu precipitant. The filtered reaction was concentrated in vacuo and the product was purified by Hex : EtOAc silica chromatography using a CombiFlash purification system. Product eluted at 3 : 1 Hex : EtOAc and collected fractions were evaporated to dryness to afford the product S3-1 as a clear oil (MW: 246.26 g/mol, 110 mg, 63% yield).
2. S3-1 was dissolved (110 mg, .45 mmole, 1 equiv) in 2 mL 1 : 1 MeOH : H2O and LiOH (11 mg, .45 mmol, 1 equiv) was added. The mixture was heated to 70 °C and was monitored for completion by TLC and LC/MS. Once complete, the reaction mixture was cooled to R. T. To the cooled mixture, 2 mL of 1N HCl was added until the pH < 4. The reaction mixture was then diluted with 5 mL of EtOAc and transferred to a seperatory funnel. The aqueous layer was extracted into EtOAc (5 mL × 3). The organic layer was dried over Na2SO4, filtered, and evaporated to dryness to afford a crude white powder, which was of sufficient purity for the next step (MW: 218.21 g/mol, 90 mg, 92% yield).
[2C07c]: 1. S1–4 (10 mg, .034 mmol, 1 equiv) was dissolved in 1 mL DCM and cooled to 0 °C. To this solution, neat TFA (250 μL, 3.3 mmol, 97 equiv) was added drop wise while stirring. Once all the TFA was added, the reaction was allowed to warm up to R.T. over 2 hrs while being monitored by TLC and LC/MS. When complete, the crude mixture was evaporated to dryness. Once dry, the crude oil was re-suspended in 5 mL toluene and evaporated to dryness three times to remove by azeotrope in vacuo any excess TFA or H2O. This crude oil was then dissolved in .5 mL dry DMF under inert atmosphere.
2. To a separate reaction vessel, S3-1 (12 mg, .055 mmol, 1.6 equiv) was dissolved in 1 mL dry DMF under inert atmosphere with HATU (26 mg, .068 mmol, 2 equiv). While stirring, DIPEA (9 mg, .070 mmol, 2 equiv) was added drop wise at 0 °C. When all the DIPEA was added, it was allowed to sit for 15 minutes. After this, the 1 mL DMF solution containing the crude de-protected S2-2 was added via syringe. This reaction was allowed to warm up to R.T. over the course of 2 hrs and was monitored by TLC and LC/MS. When complete, 5 mL of H2O and 5 mL of EtOAc were added and the mixture was transferred to a seperatory funnel. The aqueous layer was extracted into EtOAc (5 mL × 3). The organic layer was dried over Na2SO4, filtered, and evaporated to dryness. The crude product was purified by Hex : EtOAc silica chromatography using a CombiFlash purification system. Product eluted at 3 : 1 Hex : EtOAc and collected fractions were evaporated to dryness to afford the product 2C07c as a clear oil (394.55 g/mol, 9 mg, 67% yield).
1H (500 MHz, (CD3)2SO) δ: 8.78 (s, 1H), 8.24 (m, 1H), 8.08 (s, 1H), 7.74 (d, J = 8.9 Hz), 7.07 (d, J = 8.9 Hz), 3.80 (s, 3H), 3.31 (m, 2H), 2.84 (m, 2H), 2.78 (m, 2H), 2.55 (m, 2H), 2.18 (s, 6H), 1.86 (m, 2H).
13C (125 MHz, (CD3)2SO) δ: 161.50, 158.10, 139.72, 132.83, 128.60, 120.35, 120.26 (2C), 114.70 (2C), 58.05, 55.47, 44.75 (2C), 37.32, 35.88, 35.34, 28.90.
Synthesis of 2B02: N-(3-((2-(dimethylamino)ethyl)disulfanyl)propyl)-2-(1H-indol-3-yl)-2-oxoacetamide

[2B02]: 1. S1–4 (10 mg, .034 mmol, 1 equiv) was dissolved in 1 mL DCM and cooled to 0 °C. To this solution, neat TFA (250 μL, 3.3 mmol, 97 equiv) was added drop wise while stirring. Once all the TFA was added, the reaction was allowed to warm up to R.T. over 2 hrs while being monitored by TLC and LC/MS. When complete, the crude mixture was evaporated to dryness. Once dry, the crude oil was re-suspended in 5 mL toluene and evaporated to dryness three times to remove by azeotrope in vacuo any excess TFA or H2O. This crude oil was then dissolved in .5 mL dry DMF under inert atmosphere.
2. To a separate reaction vessel, 2-(1H-indol-3-yl)-2-oxoacetic acid (9.6 mg, .051 mmol, 1.5 equiv) was dissolved in 1 mL dry DMF under inert atmosphere with HATU (21.7 mg, .057 mmol, 1.7 equiv). While stirring, DIPEA (7.4 mg, .051 mmol, 1.5 equiv) was added drop wise at 0 °C. When all the DIPEA was added, it was allowed to sit for 15 minutes. After this, the 1 mL DMF solution containing the crude de-protected S2-2 was added via syringe. This reaction was allowed to warm up to R.T. over the course of 2 hrs and was monitored by TLC and LC/MS. When complete, the reaction mixture was separated by RP-HPLC (H2O [.1% TFA] : ACN [.1% TFA]) and lyophilized to afford the product 2B02 as a white powder formic acid salt (365.51 + 46.03 (FA) g/mol, 7 mg, 50% yield).
1H (500 MHz, (CD3)2SO) δ: 8.84 (m, 1H), 8.73 (s, 1H), 8.17 (s, 1H, HCOOH aldehyde proton), 8.22 (m, 1H), 7.26 (m, 2H), 7.26 (m, 1H), 3.31 (m, 2H), 2.86 (m, 2H), 2.76 (m, 2H), 2.61 (m, 2H), 2.22 (m, 6H), 1.88 (m, 2H).
13C (125 MHz, (CD3)2SO) δ: 182.28, 163.83, 163.58 (HCOOH carbonyl signal), 138.55, 136.35, 126.27, 123.57, 122.68, 121.34, 112.67, 112.24, 57.89, 44.58 (2C), 37.44, 35.51, 35.49, 28.57.
Synthesis of 1: N-(4-acrylamidophenyl)-1-(4-methoxyphenyl)-5-(trifluoromethyl)-1H-pyrazole-4-carboxamide

[1]: 1. 1-(4-Methoxyphenyl)-5-(trifluoromethyl)-1H-pyrazole-4-carboxylic acid (50 mg, .175 mmol, 1 equiv) was dissolved in .5 mL dry DMF under inert atmosphere with HATU (66.5 mg, .175 mmol, 1 equiv). While stirring, DIPEA (24.2 mg, .192 mmol, 1.1 equiv) was added drop wise at 0 °C. When all the DIPEA was added, it was allowed to sit for 15 minutes. After this, p-phenylenediamine (75.7 mg, .7 mmol, 4 equiv) was added. The reaction was allowed to warm up to R.T. over the course of 2 hrs and was monitored by TLC and LC/MS. When complete, 5 mL of H2O and 5 mL of EtOAc were added and the mixture transferred to a seperatory funnel. The aqueous layer was extracted into EtOAc (5 mL × 3). The organic layer was dried over Na2SO4, filtered, and evaporated to dryness. The crude product was purified by Hex : EtOAc silica chromatography using a CombiFlash purification system. The intermediate eluted at 1 : 1 Hex : EtOAc and collected fractions were evaporated to dryness to afford the coupled intermediate as a yellow oil (376.41 g/mol, 33.5 mg, 51% yield).
2. A portion of the purified product from step one (15 mg, .040 mmol, 1 equiv) was dissolved in .5 mL dry DMF under inert atmosphere. Dry TEA (8.1 mg, .080 mmole, 2 equiv) was added via syringe at 0 °C. In a separate vial under inert atmosphere, 900 μL dry DMF and 100 μL of neat acryloyl chloride were mixed to make a 1 : 10 dilution of the acryloyl chloride reagent. 32 μL of this dilution as transferred via syringe to the reaction vial (3.6 mg, .040 mmol, 1 equiv) at 0 °C. The reaction was allowed to warm up to R. T. and was monitored by TLC and LC/MS. Once complete, 1 mL of saturated NaHCO3 solution was added and allowed to mix for 15 minutes to quench the reaction. To this, 5 mL of EtOAc was added and the mixture was transferred to a seperatory funnel. The aqueous layer was extracted into EtOAc (5 mL × 3). The organic layer was dried over Na2SO4, filtered, and evaporated to dryness. The crude product was purified by DCM : MeOH silica chromatography using a CombiFlash purification system. The intermediate eluted at 10 : 1 DCM : MeOH and collected fractions were evaporated to dryness to afford the compound 1 as a clear oil (430.38 g/mol, 9.3 mg, 54% yield).
1H (500 MHz, (CD3)2CO) δ: 8.08 (s, 1H), 7.65 (s, 4H), 7.42 (m, 2H), 7.10 (m, 2H), 6.44 (dd, J1 = 17.0 Hz, J2 = 9.5 Hz, 1H), 6.36 (dd, J1 = 17.0 Hz, J2 = 2.3 Hz, 1H), 5.78 (dd, J1 = 9.5 Hz, J2 = 2.3 Hz, 1H), 3.89 (s, 3H)
Synthesis of 2: N-(3-acrylamidophenyl)-1-(4-methoxyphenyl)-5-(trifluoromethyl)-1H-pyrazole-4-carboxamide

[2]: 1. 1-(4-Methoxyphenyl)-5-(trifluoromethyl)-1H-pyrazole-4-carboxylic acid (50 mg, .175 mmol, 1 equiv) was dissolved in .5 mL dry DMF under inert atmosphere with HATU (66.5 mg, .175 mmol, 1 equiv). While stirring, DIPEA (90.3 mg, .700 mmol, 4 equiv) was added drop wise at 0 °C. When all the DIPEA was added, it was allowed to sit for 15 minutes. After this, m-phenylenediamine (76 mg, .700 mmol, 4 equiv) was added. The reaction was allowed to warm up to R.T. over the course of 2 hrs and was monitored by TLC and LC/MS. When complete, 5 mL of H2O and 5 mL of EtOAc were added and the mixture transferred to a seperatory funnel. The aqueous layer was extracted into EtOAc (5 mL × 3). The organic layer was dried over Na2SO4, filtered, and evaporated to dryness. The crude product was purified by DCM : MeOH silica chromatography using a CombiFlash purification system. The intermediate eluted at 10 : 1 DCM : MeOH and collected fractions were evaporated to dryness to afford the coupled intermediate as a yellow oil (376.41 g/mol, 21 mg, 32% yield).
2. The purified product from step one (21 mg, .056 mmol, 1 equiv) was dissolved in .5 mL dry DMF under inert atmosphere. Dry TEA (22.7 mg, .223 mmole, 4 equiv) was added via syringe at 0 °C. In a separate vial under inert atmosphere, 900 μL dry DMF and 100 μL of neat acryloyl chloride were mixed to make a 1 : 10 dilution of the acryloyl chloride reagent. 50 μL of this dilution as transferred via syringe to the reaction vial (5.5 mg, .061 mmol, 1.1 equiv) at 0 °C. The reaction was allowed to warm up to R. T. and was monitored by TLC and LC/MS. Once complete, 1 mL of saturated NaHCO3 solution was added and allowed to mix for 15 minutes to quench the reaction. To this, 5 mL of EtOAc was added and the mixture was transferred to a seperatory funnel. The aqueous layer was extracted into EtOAc (5 mL × 3). The organic layer was dried over Na2SO4, filtered, and evaporated to dryness. The crude product was purified by DCM : MeOH silica chromatography using a CombiFlash purification system. The intermediate eluted at 10 : 1 DCM : MeOH and collected fractions were evaporated to dryness to afford compound 2 as a clear oil (430.38 g/mol, 8.2 mg, 34% yield).
1H (500 MHz, CD3OD) δ: 8.06 (s, 1H), 7.43 (m, 1H), 7.41 (m, 1H), 7.40 (m, 2H), 7.31 (s, 1H), 7.08 (s, 2H), 6.44 (dd, J1 = 16.94 Hz, J2 = 9 Hz, 1H), 6.35 (d, J = 16.94 Hz, 1H), 5.76 (d, J = 9.7 Hz, 1H)
Synthesis of 3: N-(3-acrylamido-5-chlorophenyl)-1-(4-methoxyphenyl)-5-(trifluoromethyl)-1H-pyrazole-4-carboxamide

[3]: 1. 1-(4-Methoxyphenyl)-5-(trifluoromethyl)-1H-pyrazole-4-carboxylic acid (500 mg, 1.75 mmol, 1 equiv) was dissolved in .5 mL dry DMF under inert atmosphere with HATU (732 mg, 1.93 mmol, 1.1 equiv). While stirring, DIPEA (1.8 g, 14 mmol, 8 equiv) was added drop wise at 0 °C. When all the DIPEA was added, it was allowed to sit for 15 minutes. After this, 5-chloro-m-phenylenediamine (996 mg, 7.0 mmol, 4 equiv) was added. The reaction was allowed to warm up to R.T. over the course of 2 hrs and was monitored by TLC and LC/MS. When complete, 5 mL of H2O and 5 mL of EtOAc were added and the mixture transferred to a seperatory funnel. The aqueous layer was extracted into EtOAc (5 mL × 3). The crude product was dissolved in 1 : 1 ACN : H2O, separated by RP-HPLC (H2O [.1% TFA] : ACN [.1% TFA]), and lyophilized to afford the coupled intermediate as a clear oil (410.78 g/mol, 245 mg, 34% yield).
2. A portion of the purified product from step one (100 mg, .22 mmol, 1 equiv) was dissolved in .5 mL dry DMF under inert atmosphere. Dry TEA (90 mg, .85 mmole, 4 equiv) was added via syringe at 0 °C. 20 μL of acryloyl chloride was transferred via syringe to the reaction vial (22 mg, .242 mmol, 1.1 equiv) at 0 °C. The reaction was allowed to warm up to R. T. and was monitored by TLC and LC/MS. Once complete, 1 mL of saturated NaHCO3 solution was added and allowed to mix for 15 minutes to quench the reaction. To this, 5 mL of EtOAc was added and the mixture was transferred to a seperatory funnel. The aqueous layer was extracted into EtOAc (5 mL × 3). The crude product was dissolved in 1 : 1 ACN : H2O, separated by RP-HPLC (H2O [.1% TFA] : ACN [.1% TFA]), and lyophilized to afford compound 3 as a clear oil (464.78 g/mol, 48 mg, 47% yield).
1H (500 MHz, (CD3)2SO) δ: 10.71 (s, 1H), 10.41 (s, 1H), 8.05 (m, 1H), 7.69 (m, 1H), 7.49 (m, 1H), 8.29 (s, 1H), 7.46 (m, 2H), 7.12 (m, 2H), 6.44 (dd, J1 = 17.00 Hz, J2 = 10.08 Hz, 1H), 6.30 (dd, J1 = 17.00 Hz, J2 = 1.76 Hz, 1H), 5.80 (dd, J1 = 10.08 Hz, J2 = 1.76 Hz, 1H), 3.85 (s, 3H).
13C (125 MHz, (CD3)2SO) δ: 163.47, 160.15, 159.32, 140.64, 140.25, 139.55, 133.08, 131.51, 131.46, 127.64, 127.47 (2C), 120.74, 120.38, 118.22, 114.40 (2C), 114.28, 114.26, 108.83, 55.60.
Synthesis of 4: N-(3-chloro-5-propionamidophenyl)-1-(4-methoxyphenyl)-5-(trifluoromethyl)-1H-pyrazole-4-carboxamide

[4]: 1. Please refer to step one of the synthesis of compound 3 above.
2. A portion of the purified coupled intermediate from step one compound 3’s synthesis (100 mg, .22 mmol, 1 equiv) was dissolved in .5 mL dry DMF under inert atmosphere. Dry TEA (90 mg, .85 mmole, 4 equiv) was added via syringe at 0 °C. 20 μL of propionyl chloride was transferred via syringe to the reaction vial (22 mg, .242 mmol, 1.1 equiv) at 0 °C. The reaction was allowed to warm up to R. T. and was monitored by TLC and LC/MS. Once complete, 1 mL of saturated NaHCO3 solution was added and allowed to mix for 15 minutes to quench the reaction. To this, 5 mL of EtOAc was added and the mixture was transferred to a seperatory funnel. The aqueous layer was extracted into EtOAc (5 mL × 3). The crude product was dissolved in 1 : 1 ACN : H2O, separated by RP-HPLC (H2O [.1% TFA] : ACN [.1% TFA]), and lyophilized to afford compound 4 as a clear oil (466.8 g/mol, 74 mg, 72% yield).
1H (500 MHz, (CD3)2SO) δ: 10.66 (s, 1H), 10.12 (s, 1H), 8.28, (s, 1H), 7.97 (m, 1H), 7.58 (m, 1H), 7.46 (m, 3H), 7.12 (m, 2H), 3.85 (s, 3H), 2.33 (q, J = 7.6 Hz, 2H), 1.08 (t, J = 7.6 Hz, 3H)
13C (125 MHz, (CD3)2SO) δ: 172.47, 160.13, 159.29, 140.96, 140.16, 139.54, 132.96, 131.47, 127.47 (2C), 120.78, 120.39, 118.22, 114.40 (2C), 113.97, 113.73, 108.52, 55.60, 29.56, 9.53.
βME50 Determination of 2C07, 2B02, and 2C07 Derivatives
Each reaction was 50 μL total volume and conducted in a 96 well plate format for analysis by LC/MS. A base master mix of 4 μM Ras, 1 mM MgCl2, 100 μM tethering compound in Gel Filtration Buffer was made. Another master mix containing the same reagents supplemented with 25 mM βME was also made. 100 μL of the master mix containing 25 mM βME was put in wells in row A. The remaining rows were filled with 50 μL of the master mix with no βME. Using a multi-channel pipette, the solutions were serial diluted 1 : 1 from row A down to H. This made 8 reactions with βME concentration varying from 25 mM down to 185 μM. Once set, the tray was allowed to equilibrate while mixing at room temperature for 1 h. After equilibration, the percent modification was detected by LC/MS. The percent modification was analyzed by electrospray mass spectrometry using a Waters Acquity UPLC/ESI-TQD with a 2.1 × 50 mm Acquity UPLC BEH300 C4 column. Percent modifications for each βME concentration were plotted in PRISM and fit using a Boltzman sigmoidal non-linear regression (curve fit) to determine the βME50 value and 95% confidence interval.
Crystallization, Data Collection, and Structure Determination
For all X-Ray crystallography, a similar protocol was followed as outlined in Ostrem et al., 2013. To every protein crystallography prep, 1 mM MgCl2 was added prior to setup. After high-speed centrifugation to remove insoluble protein, a 1:1 volume of protein and precipitation solutions were mixed for hanging drop evaporative diffusion. Protein concentrations varied from 8–12 mg/mL prior to dilution with precipitation solutions. For initial screening, Qiagen screening plates (see Key Resource Table) were used to find the optimal precipitation solution. To set up our 96-well screening trays, we utilized a TTPLabtech Mosquito Nanoliter Dropsetter and let our crystals rest at 20 °C in a climate controlled crystal storage facility. Each day, trays were monitored for crystal formation. Commonly, several days would elapse (3–5 days) before crystals had sufficiently grown for harvesting. Common successful reservoir conditions contained various PEG precipitants (see table below) and some were improved by the addition of an additive solution. Additive solutions were added 10% (by volume) and screened from commercially available NeXtal DWBlock Opti Salt Suite solutions. For the best precipitation solution hits, hanging drops were set using larger crystal trays and optimized to yield large, singular crystals. Crystals were cryoprotected by adding various amounts of glycerol. Once looped, crystals were frozen and stored in liquid nitrogen prior to obtaining diffraction data. All datasets were collected at Beamline 8.2.2 (100 K nitrogen stream) at the Berkeley Advanced Light Source. Datasets were integrated with iMosflm and scaled with Aimless and Scala in the CCP4 software suite (Battye et al., 2011; Evans et al., 2013; EvansIUCr, 2006). Phenix MRage molecular replacement program was used to solve the initial structure of 1–169 K-Ras(M72C) Cys Light GDP 2C07 (Collaborative Computational Project, 1994; Evans et al., 2013; EvansIUCr, 2006). A previously deposited S-IIP structure by Ostrem et al (PDB: 4LYJ) provided the best solution and starting point for model building. The solution was further refined with manual building in Coot and several rounds of refinement in Phenix, with simulated annealing, ADP (B factor) refinement, TLS (parameters provided by the TLSMD server) (Adams et al., 2011; Painter et al., 2006). Subsequent crystal structure datasets underwent a similar refinement process. Ligand geometrical restraints were generated using Phenix Elbow (Moriarty et al., 2009). The 1–166 H-Ras(M72C) GppNHp 2C07 dataset underwent MRage molecular replacement using several truncated models, and the previously deposited 1–166 H-Ras GppNHp structure (PDB: 3K9L) gave the best starting solution. All figures were made with PyMOL except for electrostatic surfaces, which were generated by CCP4mg and then rendered in PyMOL. For crystal statistics, please refer to SI Figure 5.
Crystallography Growth Conditions Summary.
| Crystal (PDB Code) |
Growth Condition | 10% Additive Solution | Beamline/Wavelength (Å) |
|---|---|---|---|
| K-Ras(M72C) Cys Light GDP 2C07 (5VBM) | 33% PEG4000, .1 M Na Citrate (pH 4.6), .2 M Ammonium Acetate | 2.2M KCl | ALS 8.2.2/1.0000 |
| H-Ras(M72C) GDP 2C07 (5VBE) | 22% PEG8000, .1M Tris HCl (pH 7.7), .1 M CaCl2 | .1M Tris HCl (pH 8.5), 1.75 M Na Formate | ALS 8.2.2/1.0000 |
| H-Ras(M72C) GppNHp 2C07 (5BVZ) | 32% PEG4000, .1 M Na Cacodylate (pH 6.6), .2 M CaCl2 | N/A | ALS 8.2.2/1.0000 |
Hydrogen Deuterium Exchange Mass Spectrometry Data Collection
HDX reactions were conducted with 40pmol of protein, and were initiated by the addition of 46 μL of D2O Buffer Solution (10 mM HEPES pH 7.5, 50 mM NaCl, 97% D2O), to give a final concentration of 87% D2O. Exchange was carried out for 0.3s, 3s, 30s, 300s and 3000s, and exchange was terminated by the addition of a quench buffer (final concentration 0.6 M guanidine HCl, 0.8% formic acid). Samples were rapidly frozen in liquid nitrogen and stored at −80°C until mass analysis.
Protein samples were rapidly thawed and injected onto a UPLC system at 2°C. The protein was run over two immobilized pepsin columns (Applied Biosystems; porosyme, 2-3131-00) at 10°C and 2°C at 200 μL/min for 3 minutes, and peptides were collected onto a VanGuard precolumn trap (Waters). The trap was subsequently eluted in line with an Acquity 1.7 μm particle, 100 × 1 mm2 C18 UPLC column (Waters), using a gradient of 5–36% B (buffer A 0.1% formic acid, buffer B 100% acetonitrile) over 16 minutes. Mass spectrometry experiments were performed on an Impact II TOF (Bruker) acquiring over a mass range from 150 to 2200 m/z using an electrospray ionization source operated at a temperature of 200 °C and a spray voltage of 4.5 kV. Peptides were identified using data-dependent acquisition methods following tandem MS/MS experiments (0.5 s precursor scan from 150–2200 m/z; twelve 0.25 s fragment scans from 150–2200 m/z). MS/MS datasets were analyzed using PEAKS7 (PEAKS), and a false discovery rate was set at 1% using a database of purified proteins and known contaminants.
Deuterium incorporation calculations were carried out as described previously (Fowler et al., 2016). HD-Examiner Software (Sierra Analytics) was used to automatically calculate the level of deuterium incorporation into each peptide. All peptides were manually inspected for correct charge state and presence of overlapping peptides. Deuteration levels were calculated using the centroid of the experimental isotope clusters.
Ras GppNHp In Vitro Pull Down Assay by His6-MBP-Raf-1-RBD
For each His6-MBP-Raf-1-RBD in vitro pull down the total volume was 500 μL. Each reaction had the following final composition: Either 20, 80, 200, 400, or 800 nM Ras GppNHp (from .2 mg/mL Ras stock), 75 nM BSA (2.5 μg, 5 μL of .5 mg/mL BSA stock), 200 nM of His6-MBP-Raf-1-RBD (5.3 μg, 1.2 μL of 4.38 mg/mL stock of His6-MBP-Raf-1-RBDwitt), and Raf Pull Down Buffer to volume (25 mM Tris (pH 7.2), 150 mM NaCl, 5 mM MgCl2, 1% NP-40, 5% glycerol, 20 mM imidazole). Samples were then mixed by gentle rotation at 4 °C for 30 min. While equilibrating, add 50 μL Ni-NTA slurry (Qiagen) to a cellulose acetate spin cup and spin at 5,000 rpm on a tabletop centrifuge for 30 seconds. Wash the beads with 400 μL of Raf Pull Down Buffer to wash away bead storage buffer. Before adding each pull down solution, take 10 μL and save as a loading control sample. To each spin cup filled with washed Ni-NTA beads, add the remaining equilibrated pull down solution, seal the spin cup with parafilm and let rotate at 4 °C for 30 more minutes. After mixing, centrifuge the sample for 30 seconds at 5,000 rpm. Toss flow through. Wash the beads × 5 with 400 μL of Raf Pull Down Buffer. After last wash, centrifuge one last time to remove any excess buffer stuck to the beads. To each cup, add 50 μL of 5X SDS loading buffer and mix by vortexing. Let the buffer sit on the beads for 5 minutes and then elute into a fresh tube by centrifuging at 5000 rpm for 1.5 minutes. Load 10 μL of each loading control sample and 25 μL of each eluted pull down onto a SDS-PAGE gel and transfer to a nitrocellulose blot for Western Blot analysis. Block with 5% BSA TBS buffer and then blot with pan Ras primary antibody at a 1:500 dilution in 5% BSA in TBST (Cell Signaling #3965). Blots were read out using LICOR compatible secondary antibodies. Pull-down signals were reported as ratios relative to input protein signal.
Intrinsic Nucleotide Affinity by EDTA Catalyzed Nucleotide Exchange
For each EDTA catalyzed reaction, the total reaction volume was 500 μL. Each reaction had the following final composition: 100 nM Ras GDP (1 μg, 5 μL of .2 mg/mL Ras stock), 75 nM BSA (2.5 μg, 5 μL of .5 mg/mL BSA stock), 100 μM total nucleotide concentration (5 μL of various ratios of GDP : GppNHp from 10 mM stock solutions), 10 mM of EDTA (10 μL of .5M EDTA pH 8.0), 64 mM of MgCl2 (16 μL of 2M MgCl2 stock), 3 μM of His6-MBP-Raf-1-RBDwitt (80 μg, 18.3 μL of 4.38 mg/mL stock of His6-MBP-Raf-1-RBDwitt), and Raf Pull Down Buffer to volume (25 mM Tris (pH 7.2), 150 mM NaCl, 5 mM MgCl2, 1% NP-40, 5% glycerol, 20 mM imidazole). Prior to initiating the EDTA catalyzed nucleotide exchange, the Ras, BSA, nucleotide, and Raf Pull Down Buffer were mixed by pipette on ice. To each tube, the EDTA was added, sample was inverted × 3, and then placed in a pre-warmed tube rack at 30 °C. The exchange was allowed to occur at 30 °C for 15 minutes, inverting each tube × 3 every 5 minutes. Once the 15 minutes of exchange was complete, MgCl2 was added to each tube and inverted × 3 and placed on ice for 15 minutes. During the quenching on ice, add 100 μL Ni-NTA slurry (Qiagen) to a cellulose acetate spin cup and spin at 5,000 rpm on a tabletop centrifuge for 30 seconds. Wash the beads with 400 μL of Raf Pull Down Buffer to wash away bead storage buffer. Before adding the beads and His6-tagged Raf-1-RBDwitt, take a 10 μL sample as a loading control and quench it with 5 μL 5X SDS loading buffer. To each spin cup filled with washed Ni-NTA beads, add the quenched EDTA catalyzed exchange reaction and the His6-tagged Raf-1-RBDwitt. Seal the spin cup with parafilm and let rotate at 4 °C for 1 h. After mixing, centrifuge the sample for 30 seconds at 5,000 rpm. Toss flow through. Wash the beads × 5 with 400 μL of Raf Pull Down Buffer. After last wash, centrifuge one last time to remove any excess buffer stuck to the beads. To each cup, add 50 μL of 5X SDS loading buffer and mix by vortexing. Let the buffer sit on the beads for 5 minutes and then elute into a fresh tube by centrifuging at 5000 rpm for 1.5 minutes. Load 10 μL of each loading control sample and 25 μL of each eluted pull down onto a SDS-PAGE gel and transfer to a nitrocellulose blot for Western Blot analysis. Block with 5% BSA TBS buffer and then blot with pan Ras primary antibody at a 1:500 dilution in 5% BSA in TBST (Cell Signaling #3965). Blots were read out using LICOR compatible secondary antibodies and quantified. Signal from each GDP-only (i.e. 0% GppNHp) exchange was subtracted as background from the 20%, 50%, and 66% GppNHp pull-down signals for each protein construct. The signal for the GppNHp only lane (i.e. 100% GppNHp) was normalized to 1 and all other signals were made relative to this band within each protein construct tested.
Ras GDP In Vitro Pull Down Assay by His6 Tagged SOSCAT
This experiment was created based on a procedure published in Hall et al., 2001. For each SOSCAT in vitro pull down the total volume was 500 μL. Each reaction had the following final composition: Either 20, 80, 200, 400, or 800 nM Ras GDP (from .2 mg/mL Ras stock), 75 nM BSA (2.5 μg, 5 μL of .5 mg/mL BSA stock), 200 nM of His6-SOSCAT (6 μg, 3 μL of diluted .2 mg/mL stock of His6-SOSCAT), and SOSCAT Pull Down Buffer to volume (20 mM Tris (pH 7.6), 50 mM NaCl, 5 mM EDTA, 1% Triton X-100, 20 mM imidazole). Samples were then mixed by gentle rotation at 4 °C for 30 min. While equilibrating, add 50 μL Ni-NTA slurry (Qiagen) to a cellulose acetate spin cup and spin at 5,000 rpm on a tabletop centrifuge for 30 seconds. Wash the beads with 400 μL of SOSCAT Pull Down Buffer to wash away bead storage buffer. Before adding each pull down solution, take 10 μL and save as a loading control sample. To each spin cup filled with washed Ni-NTA beads, add the remaining equilibrated pull down solution, seal the spin cup with parafilm and let rotate at 4 °C for 30 more minutes. After mixing, centrifuge the sample for 30 seconds at 5,000 rpm. Toss flow through. Wash the beads × 5 with 400 μL of SOSCAT Pull Down Buffer. After last wash, centrifuge one last time to remove any excess buffer stuck to the beads. To each cup, add 50 μL of 5X SDS loading buffer and mix by vortexing. Let the buffer sit on the beads for 5 minutes and then elute into a fresh tube by centrifuging at 5000 rpm for 1.5 minutes. Load 10 μL of each loading control sample and 25 μL of each eluted pull down onto a SDS-PAGE gel and transfer to a nitrocellulose blot for Western Blot analysis. Block with 5% BSA TBS buffer and then blot with pan Ras primary antibody at a 1:500 dilution in 5% BSA in TBST (Cell Signaling #3965). Blots were read out using LICOR compatible secondary antibodies and quantified. The largest input signal was normalized to one for each protein construct and each pull-down signal (i.e. 20 nM, 80 nM, 200 nM, 400 nM, and 800 nM respectively) was reported relative to that maximum signal. Thus, normalized pull-down signals represent the proportion of Ras pulled down relative to the maximum blot signal detected for that particular protein construct.
SOSCAT Catalyzed Nucleotide Exchange In Vitro Analyzed by Ras GppNHp Pull Down by His6 Tagged Raf-1-RBD
For each SOSCAT in vitro catalyzed nucleotide exchange reaction the total volume was 500 μL. Each reaction had the following final composition: 100 nM Ras GDP (1 μg, 5 μL of .2 mg/mL Ras stock), 75 nM BSA (2.5 μg, 5 μL of .5 mg/mL BSA stock), 800 nM of SOSCAT (6 μg, 12 μL of diluted .2 mg/mL stock of His6-SOSCAT), 100 μM total nucleotide concentration (5 μL of 10 mM nucleotide stock solutions), 200 nM of His6-MBP-Raf-1-RBDwitt (5.3 μg, 1.2 μL of 4.38 mg/mL stock of His6-MBP-Raf-1-RBDwitt), and SOSCAT Catalyzed Exchange Buffer to volume (20 mM Tris (pH 7.6), 50 mM NaCl, 5 mM MgCl2, 1% Triton X-100, 20 mM imidazole). Mix the Ras, BSA, SOSCAT, nucleotide, and SOSCAT Catalyzed Exchange Buffer in an eppendorf tube and let rotate at 4 °C for 3 h. While equilibrating, add 50 μL Ni-NTA slurry (Qiagen) to a cellulose acetate spin cup and spin at 5,000 rpm on a tabletop centrifuge for 30 seconds. Wash the beads with 400 μL of SOSCAT Catalyzed Exchange Buffer to wash away bead storage buffer. To each exchange reaction, add His6-MBP-Raf-1-RBDwitt. Before adding each pull down solution to the spin cup, take 10 μL and save as a loading control sample. To each spin cup filled with washed Ni-NTA beads, add the remaining exchange reaction, seal the spin cup with parafilm and let rotate at 4 °C for 1 hr. After mixing, centrifuge the sample for 30 seconds at 5,000 rpm. Toss flow through. Wash the beads × 5 with 400 μL of SOSCAT Pull Down Buffer. After last wash, centrifuge one last time to remove any excess buffer stuck to the beads. To each cup, add 50 μL of 5X SDS loading buffer and mix by vortexing. Let the buffer sit on the beads for 5 minutes and then elute into a fresh tube by centrifuging at 5000 rpm for 1.5 minutes. Load 10 μL of each loading control sample and 25 μL of each eluted pull down onto a SDS-PAGE gel and transfer to a nitrocellulose blot for Western Blot analysis. Block with 5% BSA TBS buffer and then blot with pan Ras primary antibody at a 1:500 dilution in 5% BSA in TBST (Cell Signaling #3965). Blots were read out using LICOR compatible secondary antibodies and quantified. +GppNHp and +SOScat pull-down conditions were quantified and reported as ratios relative to the input signal for each protein construct.
Electrophile Labeling Experiments
Each reaction was analyzed in a 96 well plate format for analysis by LC/MS. Total reaction volumes were 25 μL for single time point labeling experiments and 200 uL for full 24-hour time courses. 25 μL reactions were made in the wells of a V-bottom 96 well plate and 200 uL reactions were made in 1.25 mL eppendorf tubes. All labeling reactions were conducted in Gel Filtration Buffer (20 mM HEPES (pH 7.5), 150 mM NaCl) with no added reductant at room temperature. Final reaction mixtures were 4 μM Ras, 1 mM MgCl2, and had a total DMSO concentration of 4% by volume. Electrophile stocks were made in DMSO at 10 mM, aliquoted, and frozen. Labeling reactions were started by the addition of the desired volume of 10 mM electrophile stock and mixed thoroughly by pipette. General screening of new electrophiles was done at 100 μM electrophile in triplicate and sampled as a single time point after 24 hours of incubation. For Compound 3, labeling time courses were conducted at 20 μM compound with sampling done every 2 hours for the first 10 hours of incubation and continued after overnight incubation until the protein was fully modified. Reactions were allowed to sit at room temperature in the dark (either covered in aluminum foil or in a bench drawer) until the desired time point was reached. For 24-hour single point labeling experiments, the reaction was directly sampled from the 96 well plate and analyzed by LC/MS. For experiments with multiple time points, 22.5 μL aliquots of the 200 μL master reaction were sampled and quenched by the addition of 2.5 μL of 2% formic acid (also made in Gel Filtration Buffer). This 25 μL quenched sample was then analyzed by LC/MS and the remaining master reaction was allowed to continue reacting after gentle mixing by pipette. The percent modification was analyzed by electrospray mass spectrometry using a Waters Acquity UPLC/ESI-TQD with a 2.1 × 50 mm Acquity UPLC BEH300 C4 column.
Competition Labeling Experiments
200 μL reactions were made in Gel Filtration buffer (20 mM HEPES (pH 7.5), 150 mM NaCl) with no added reductant at room temperature. The final concentrations of each reagent were as follows: 4 μM Ras, 1 mM MgCl2, 20 μM Compound 3, X μM Compound 4, and a total DMSO concentration of 4% by volume. Compound 4 was varied from 0X (0 μM), 1X (20 μM), 3X (60 μM), and 9X (180 μM) respectively. Adding the desired volume of Gel Filtration Buffer, MgCl2, DMSO, and 10 mM compound stocks of Compounds 3 and 4 was done first and mixed thoroughly before protein was added. Reactions were started by the addition and gentle mixing by pipette of concentrated Ras stocks diluted into the master reaction down to 4 μM. Each reaction was set in triplicate and allowed to react at room temperature in the dark (either covered in aluminum foil or in a bench drawer) until the desired time point was reached. At each time point, 22.5 μL aliquots of each 200 μL master reaction was sampled and quenched by the addition of 2.5 μL of 2% formic acid (also made in Gel Filtration Buffer). This 25 μL quenched sample was then analyzed by LC/MS and the remaining master reaction was allowed to continue reacting after gentle mixing by pipette. The percent modification was analyzed by electrospray mass spectrometry using a Waters Acquity UPLC/ESI-TQD with a 2.1 × 50 mm Acquity UPLC BEH300 C4 column.
Purification and Modification of H-Ras Constructs for Lipid Kinase Assays
Plasmids expressing 1–181 H-Ras(G12V/C118S) and H-Ras(G12V/M72C/C118S) were transformed into BL21 DE3 and the culture was induced at OD 0.6–0.9 with 100 μg/mL IPTG. The cultures were then allowed to grow for 4 h at 37 °C after which the cells were pelleted and stored at −80 °C.
Frozen pellets were re-suspended in lysis buffer and lysed by sonication (10s ON; 10s OFF; Power-6.0). Triton-X was added to a final concentration of 0.1% and lysate was centrifuged at 20,000 g for 45 minutes (Beckman Coulter Avanti J-25I, JA 25.50 rotor). The supernatant was loaded on a 5 mL HisTrap™ FF column (GE Healthcare) equilibrated with buffer containing 10 mM imidazole pH 8.0 (NiNTA A). Following washes with 20 mL NiNTA A and 20 mL of 6% buffer containing 200 mM imidazole pH 8.0 (NiNTA B)., the protein was eluted in 100% NiNTA B. The elution was buffer exchanged with NiNTA A buffer in a 10,000 MWCO Amicon concentrator (Millipore). The sample was concentrated down to < 2 mL and TEV protease was added to ~0.3 mg/mL. The cleavage was allowed to proceed overnight at 4 °C. To de-enrich the TEV protease, the protein solution was loaded onto a HisTrap™ FF column and eluted with 10 mL of NiNTA A buffer. The elution was concentrated to ~2 mL.
For H-Ras G12V, 2-fold excess GTPγS was added with 25 mM EDTA and incubated for 1 h at room temperature. The solution was buffer exchanged with phosphatase buffer (32 mM Tris pH 8.0, 200 mM ammonium sulphate, 0.1 mM ZnCl2, 2 mM βME) and 1 unit of immobilized calf alkaline phosphatase (Sigma) was added per milligram of H-Ras along with a two-fold excess nucleotide. After incubation for 1 h at room temperature, MgCl2 was added to 30 mM to lock bound nucleotide in place and immobilized phosphatase beads were removed using a 0.22 micron spin filter (EMD Millipore).
For the M72C construct, the protein was incubated with 25 mM EDTA for 1 h at room temperature. Following buffer exchange with phosphatase buffer, immobilized calf alkaline phosphatase was added to 1 unit/mg and incubated for 1 h at room temperature. The phosphatase beads were removed and 5-fold excess GDP was added. After 30 mins at room temperature, MgCl2 was added to a final concentration of 30 mM.
The proteins were buffer exchanged with Ras gel filtration buffer (20 mM HEPES pH 7.0, 150 mM NaCl, 1 mM MgCl2) and concentrated to less than 1 mL. Protein was injected onto a Superdex™ 75 10/300 GL size-exclusion column (GE Healthcare) equilibrated in Ras gel filtration buffer.
Coupling to inhibitor was done in a reaction containing 100 μM of M72C construct, 100 μM TCEP, 1 mM MgCl2 and 200 μM Compound 3. DMSO was adjusted to a final concentration of 5%. After 24 hours, more inhibitor was added to a total final concentration of 250 μM. The coupling was allowed to proceed for ~72 hours at 4°C. Coupling efficiency was ~70%. The coupled protein was exchanged with gel filtration buffer and loaded with GTPγS in the same manner as the H-Ras(G12V) construct. The protein was then run on a Superdex™ 75 10/300 GL size-exclusion column (GE Healthcare) equilibrated in Ras gel filtration buffer to remove excess nucleotide.
Coupling of H-Ras to Maleimide Vesicles
Coupling to maleimide containing membranes was carried out as described previously (Siempelkamp et al., 2017). In brief, H-Ras constructs were added to 100 μL of 5 mg/mL PM-MCC vesicles (5% porcine brain phosphatidylinositol 4,5-bisphosphate, 10% maleimidomethyl phosphoethanolamine, 30% bovine brain phosphatidylserine, 40% egg yolk phosphatidylethanolamine (PE), and 15% egg yolk phosphatidylcholine) at a molar ratio of 1.25 H-Ras per maleimide. The thiol-maleimide conjugation reaction was bubbled under nitrogen for 2 minutes and allowed to proceed at room temperature for 1 h, followed by incubation at 4 °C overnight. A vesicles-only control was treated identically to the H-Ras sample with the exception that buffer was added in place of H-Ras. Reactions were terminated via the addition of 5 mM βME. H-Ras-coupled and non-coupled vesicles were separated from soluble H-Ras by size-exclusion chromatography on a Superdex™ 200 Increase 5/150 GL column (GE Healthcare) equilibrated in Ras gel filtration buffer. Both H-Ras-coupled and non-coupled vesicles were diluted to a final concentration of 1.0 mg/mL. The coupled H-Ras concentration was determined via intensity interpolation (ImageJ) of an SDS-PAGE standard curve using known soluble H-Ras concentrations.
PI3K Lipid Kinase Assays
Lipid kinase assays monitoring hydrolysis of ATP were carried out using the Transcreener ADP2 Fluorescence Intensity (FI) assay (Bellbrook labs). Lipid vesicles with or without coupled H-Ras were used at a final concentration of 0.45 mg/ml, with ATP present at 100 μM. Membrane coupled H-Ras was present at near saturating concentrations for activation of 0.75–1.5 μM H-Ras. Protein solutions containing either pY (PDGFR residues 735–767, with pY740 and pY751, referred to afterwards as pY; final concentration in assay 1 μM) or blank solution in 2X PI3K kinase buffer (100 mM HEPES pH 7.5, 200 mM NaCl, 6 mM MgCl2, 2 mM EDTA, 0.06% CHAPS, 2 mM TCEP) were equilibrated briefly at 25 °C. Kinase reactions were started by addition of 2 μL of protein solution to 2 μL of 2X substrate solution (0.9 mg/mL lipid vesicles ± H-Ras, 200 μM ATP) in a 384-well black microplate (Corning). The reaction was allowed to proceed at 23 °C for 15 minutes before the addition of 2X Stop and Detect buffer (1X Stop and Detect Buffer, 8 nM ADP Alexa594 Tracer, 93.7 μg/mL ADP2 Antibody-IRDye QC-1). Antibody, tracer, and ADP were equilibrated for 60 minutes. Fluorescence intensity was measured using a Cytation 5 plate reader with λexcitation = 590 nm and λemission = 620 nm (20 nm bandwidth; Molecular Devices). Specific activity was calculated using an ATP/ADP standard curve according to the Transcreener ADP FI protocol.
Data and Software Availability
All crystal structures have been deposited to the Protein Data Bank (PDB) with the following ascension codes: 5VBE, 5VBM, and 5VBZ.
Key Resources Table
| REAGENT or RESOURCE | SOURCE | IDENTIFIER |
|---|---|---|
| Antibodies | ||
| Pan Ras Antibody | Cell Signaling Technology | 3965 |
| Bacterial and Virus Strains | ||
| BL21(DE3) E.coli | 69450 | |
| Nova Blue E.coli | Novagen | 70181 |
| Chemicals, Peptides, and Recombinant Proteins | ||
| 1-(4-Methoxyphenyl)-5-(trifluoromethyl)-1H-pyrazole-4-carboxylic acid | Sigma-Aldrich | 639826-1G |
| 4-methoxyphenyl boronic acid | Sigma-Aldrich | 417599-5G |
| HATU 99% (HPLC) | AK Scientific | 65518-25g |
| 3-chloropropylamine-HCL | Sigma-Aldrich | 142549-50G |
| 4-bromobutan-1-amine | Sigma-Aldrich | 178330-5G |
| 2(Dimethylamino) ethanethiol-HCL | Sigma-Aldrich | D141003-25G |
| Ethyl-4-pyrazole carboxylate | AK Scientific | U889 |
| 4-Methoxy-phenyl boronic acid | AK Scientific | D033 |
| p-Phenylenediamine | AK Scientific | H423I809 |
| m-Phenylenediamine | Sigma-Aldrich | P23954-5G |
| 5-Chloro-m-phenylenediamine | Santa Cruz Biotechnology | Sc-268025 |
| Acryloyl chloride | Sigma-Aldrich | 549797-5G |
| Propionyl chloride | Sigma-Aldrich | P51559-25G |
| GDP | Sigma-Aldrich | G7127-100MG |
| GppNHp | Axorra | JBS-NU-401-50 |
| BSA | Millipore | 12659-1KG |
| PDGFR phosphopeptide (ESDGG(pY)MDMSKDESID (pY)VPMLDMKGDIKYADIE) | New England Peptide | Custom |
| porcine brain phosphatidylinositol 4,5-bisphosphate | Avanti Polar Lipids, Inc | 840046 |
| maleimidomethyl phosphoethanolamine | Avanti Polar Lipids, Inc | 780201C |
| bovine brain phosphatidylserine | Sigma-Aldrich | P7769-25MG |
| egg yolk phosphatidylethanolamine | Sigma-Aldrich | P6386-25MG |
| egg yolk phosphatidylcholine | Avanti Polar Lipids, Inc | 840051C |
| Calf Intestine Alkaline Phosphatase | Roche | 10108138001 |
| Critical Commercial Assays | ||
| BioRad Protein Assay Dye Concentrate | BioRad | 5000006 |
| Deposited Data | ||
| Crystal Structure of Small Molecule Disulfide 2C07 Bound to H-Ras M72C GDP | Protein Databank | 5VBE |
| Crystal Structure of Small Molecule Disulfide 2C07 Bound to K-Ras Cys Light M72C GDP | Protein Databank | 5VBM |
| Crystal Structure of Small Molecule Disulfide 2C07 Bound to H-Ras M72C GppNHp | Protein Databank | 5VBZ |
| Recombinant DNA | ||
| Plasmid: 1–169 K-Ras Cys Light | Ostrem et al., 2013 | N/A |
| Plasmid: 1–166 H-Ras(WT) | Ostrem et al., 2013 | N/A |
| Plasmid: 1–189 K-Ras(WT) | Ostrem et al., 2013 | N/A |
| Plasmid: 1–169 K-Ras(M72C) Cys Light | This Paper | N/A |
| Plasmid: 1–189 K-Ras(M72C) | This Paper | N/A |
| Plasmid: 1–166 H-Ras(M72C) | This Paper | N/A |
| Plasmid: 1–181 H-Ras(G12V/C118S) | Siempelkamp et al., 2017 | N/A |
| Plasmid: 1–181 H-Ras(G12V/M72C/C118S) | This Paper | N/A |
| Plasmid: full-length p110δ/p85α | Siempelkamp et al., 2017 | N/A |
| Plasmid: SOScat (Residues 566–1049) | Sondermann et al., 2014 | N/A |
| Plasmid: RAF1-RBDwitt (Residues 52–131) | NCI Ras Initiative; Gillette Lab | R702-X66-566 |
| Other | ||
| Waters Acquity HPLC 2545 Binary Gradient Module | Waters | 186025450 |
| Waters Acquity HPLC 2545 Binary Gradient Module | Waters | 186025450 |
| XBridge BEH C18 OBD Prep Column, 130Å, 5 μm, 30 mm × 250 mm | Waters | 186004025 |
| Waters Acquity UPLC/ESI-TQD | Waters | B10UPA010M/310UPB541M |
| 2.1 × 50 mm Acquity UPLC BEH300 C4 | Waters | 186004495 |
| 2.1 × 50 mm Acquity UPLC BEH C18 column | Waters | 186002350 |
| Impact HD Mass Spectrometer | Bruker | 1819596 |
| HDX Hydrogen Deuterium Exchange PAL | LEAP Technologies | PAL-HDX-1 |
| Aquity UPLC BEH C18 1.7μM 100 mm | Waters | 186002346 |
| Acquity UPLC BEH C18 1.7μM Vanguard pre-column 2.1 × 5 mm | Waters | 186003975 |
| Porozyme immobilized pepsin cartridge | Thermofisher Scientific | 2313100 |
| Transcreener ADP2 FI assay | BellBrook Labs | 3013-1K |
| Polystyrene assay plate 384 well, black, low volume, round bottom | Corning | 4514 |
| Polypropylene Plates V-bottom; 320 μL; Non-sterile | Corning | 3363 |
| Dionex Ultimate 3000 UHPLC | Thermofisher Scientific | 8268991-nLC |
| CombiFlash RF+ | Teledyneisco | 68-5230-022 |
| Protease Inhibitor Complete EDTA Free | Roche | 5056489001 |
| Co-Affinity Agarose Bead Resin | Clontech | 635503 |
| Ni-NTA Affinity Agarose Bead Resin | Qiagen | 30230 |
| Slide-A-Lyzer MINI Dialysis Units | Thermo Scientific | 69570 |
| Pierce cellulose acetate spin cup | Thermofisher | 69702 |
| NeXtal DWBlock Opti Salt Suite | Qiagen | 130921 |
| NeXtal DWBlock JCSG Core-III | Qiagen | 130926 |
| NeXtal DWBlock JCSG Core-II | Qiagen | 130925 |
| NeXtal DWBlock JCSG Core-1 | Qiagen | 130924 |
| NeXtal DWBlock ProComplex | Qiagen | 130915 |
| NeXtal DWBlock MbClass-1 | Qiagen | 130911 |
| NeXtal DWBlock MbClass-II | Qiagen | 130912 |
| NeXtal DWBlock PEGS-II Suite | Qiagen | 130916 |
| NeXtal DWBlock PEGS Suite | Qiagen | 130904 |
| HiTrap Q HP | GE Healthcare Life Sciences | 17-1154-01 |
| Superdex 200 | GE Healthcare Life Sciences | 28-9909-44 |
| Superdex 75 | GE Healthcare Life Sciences | 17-5174-01 |
| PD-10 | GE Healthcare Life Sciences | 17085101 |
| Amicon Spin Concentrators | Millipore | UFC8010124 (10kDa) UFC901024 (20kDa) UFC903024 (30kDa) |
Supplementary Material
Highlights.
Tethering yields new switch-II binder, 2C07, which binds Ras GDP and GTP states.
2C07 co-crystal structures and HDX-MS analysis show a modified Switch-II Pocket.
2C07 stabilizes the GDP state and prevents SOS binding and catalyzed exchange.
2C07-derived electrophiles inhibit PI3K activation, but not Raf-1-RBD binding.
Acknowledgments
This work was supported by NIH grants RO1 (1R01CA190409-01), Stand Up To Cancer - American Cancer Society Lung Cancer Dream Team Translational Research Grant (Grant Number: SU2C-AACR-DT17-15) to KMS. Stand Up To Cancer is a program of the Entertainment Industry Foundation. Research grants are administered by the American Association for Cancer Research, the scientific partner of SU2C. JEB is supported by a CIHR new investigator award, a Natural Sciences and Engineering Research Council of Canada discovery grant (NSERC-2014-05218), and a Cancer Research Society Operating Grant (CRS-22641). We would like to thank members of the Shokat, Burke, and Renslo Labs for helpful discussion, Dr. William Gillete and members of the NCI Ras Initiative for their guidance and providing the bacterial expression plasmid for the Raf-1-RBD protein, members of the Berkeley Advanced Light Source and Dr. Chris Waddling and Dr. Michael Lazarus for help with data collection and processing, and Dr. James Wells, Dr. Michelle Arkin, and Dr. Adam Renslo for access to the tethering library.
Footnotes
Publisher's Disclaimer: This is a PDF file of an unedited manuscript that has been accepted for publication. As a service to our customers we are providing this early version of the manuscript. The manuscript will undergo copyediting, typesetting, and review of the resulting proof before it is published in its final citable form. Please note that during the production process errors may be discovered which could affect the content, and all legal disclaimers that apply to the journal pertain.
Author Contributions:
DRG performed all experiments herein except for the collection of HDX-MS data and PI3K activation data. MLJ conducted and analyzed all HDX-MS experiments under the guidance of JEB with protein samples prepared by DRG. MKR prepared all lipidated full length H-Ras constructs and conducted the PI3K activation assay developed by BDS under the guidance of JEB. SMM contributed to the development of 2C07 and its derivatives. DRG, JEB and KMS wrote the manuscript, with input from all authors.
Supplemental Information:
Supplemental Information includes Figures S1–8.
References
- Adams PD, Afonine PV, Bunkóczi G, Chen VB, Echols N, Headd JJ, Hung LW, Jain S, Kapral GJ, Kunstleve RWG, et al. The Phenix software for automated determination of macromolecular structures. Methods. 2011;55:94–106. doi: 10.1016/j.ymeth.2011.07.005. [DOI] [PMC free article] [PubMed] [Google Scholar]
- Adibekian A, Martin BR, Chang JW, Hsu KL, Tsuboi K, Bachovchin DA, Speers AE, Brown SJ, Spicer T, Fernandez-Vega V, et al. Confirming Target Engagement for Reversible Inhibitors in Vivo by Kinetically Tuned Activity-Based Probes. J Am Chem Soc. 2012;134:10345–10348. doi: 10.1021/ja303400u. [DOI] [PMC free article] [PubMed] [Google Scholar]
- Ahmadian MR, Zor T, Vogt D, Kabsch W, Selinger Z, Wittinghofer A, Scheffzek K. Guanosine triphosphatase stimulation of oncogenic Ras mutants. Proc Natl Acad Sci USA. 1999;96:7065–7070. doi: 10.1073/pnas.96.12.7065. [DOI] [PMC free article] [PubMed] [Google Scholar]
- Bachovchin DA, Brown SJ, Rosen H, Cravatt BF. Identification of selective inhibitors of uncharacterized enzymes by high-throughput screening with fluorescent activity-based probes. Nature Biotechnology. 2009;27:387–394. doi: 10.1038/nbt.1531. [DOI] [PMC free article] [PubMed] [Google Scholar]
- Battye TGG, Kontogiannis L, Johnson O, Powell HR, Leslie AGW, IUCr iMOSFLM: a new graphical interface for diffraction-image processing with MOSFLM. Acta Crystallographica Section D Biological Crystallography. 2011;67:271–281. doi: 10.1107/S0907444910048675. [DOI] [PMC free article] [PubMed] [Google Scholar]
- Burns MC, Sun Q, Daniels RN, Camper D, Kennedy JP, Phan J, Olejniczak ET, Lee T, Waterson AG, Rossanese OW, et al. Approach for targeting Ras with small molecules that activate SOS-mediated nucleotide exchange. Proc Natl Acad Sci USA. 2014;111:3401–3406. doi: 10.1073/pnas.1315798111. [DOI] [PMC free article] [PubMed] [Google Scholar]
- Carelli JD, Sethofer SG, Smith GA, Miller HR, Simard JL, Merrick WC, Jain RK, Ross NT, Taunton J. Ternatin and improved synthetic variants kill cancer cells by targeting the elongation factor-1A ternary complex. eLife. 2015;4:e10222. doi: 10.7554/eLife.10222. [DOI] [PMC free article] [PubMed] [Google Scholar]
- Collaborative Computational Project, N.4. The CCP4 suite: programs for protein crystallography. Acta Crystallographica Section D Biological Crystallography. 1994;50:760–763. doi: 10.1107/S0907444994003112. [DOI] [PubMed] [Google Scholar]
- Domaille PJ, Campbell-Burk SL, Kraulis PJ, Van Aken T, Laue ED. Solution Structure and Dynamics of Ras p21.cntdot.GDP Determined by Heteronuclear Three- and Four-Dimensional NMR Spectroscopy. Biochemistry. 1994;33:3515–3531. doi: 10.1021/bi00178a008. [DOI] [PubMed] [Google Scholar]
- Erlanson DA, Wells JA, Braisted AC. Tethering: Fragment-Based Drug Discovery. Annu Rev Biophys Biomol Struct. 2004;33:199–223. doi: 10.1146/annurev.biophys.33.110502.140409. [DOI] [PubMed] [Google Scholar]
- Evans PR, Murshudov GN, IUCr How good are my data and what is the resolution? Acta Crystallographica Section D Biological Crystallography. 2013;69:1204–1214. doi: 10.1107/S0907444913000061. [DOI] [PMC free article] [PubMed] [Google Scholar]
- Evans P, IUCr Scaling and assessment of data quality. Acta Crystallographica Section D Biological Crystallography. 2006;62:72–82. doi: 10.1107/S0907444905036693. [DOI] [PubMed] [Google Scholar]
- Fetics SK, Guterres H, Kearney BM, Buhrman G, Ma B, Nussinov R, Mattos C. Allosteric effects of the oncogenic RasQ61L mutant on Raf-RBD. Structure. 2015a;23:505–516. doi: 10.1016/j.str.2014.12.017. [DOI] [PMC free article] [PubMed] [Google Scholar]
- Fetics SK, Guterres H, Kearney BM, Buhrman G, Ma B, Nussinov R, Mattos C. Allosteric Effects of the Oncogenic RasQ61L Mutant on Raf-RBD. Stfode. 2015b;23:505–516. doi: 10.1016/j.str.2014.12.017. [DOI] [PMC free article] [PubMed] [Google Scholar]
- Forbes SA, Forbes SA, Bindal N, Bindal N, Bamford S, Bamford S, Kok CY, Cole C, Cole C, Kok CY, et al. COSMIC: mining complete cancer genomes in the Catalogue of Somatic Mutations in Cancer. Nucleic Acids Research. 2010;39:D945–D950. doi: 10.1093/nar/gkq929. [DOI] [PMC free article] [PubMed] [Google Scholar]
- Ford B, Skowronek K, Boykevisch S, Bar-Sagi D, Nassar N. Structure of the G60A mutant of Ras: implications for the dominant negative effect. J Biol Chem. 2005;280:25697–25705. doi: 10.1074/jbc.M502240200. [DOI] [PubMed] [Google Scholar]
- Fowler ML, McPhail JA, Jenkins ML, Masson GR, Rutaganira FU, Shokat KM, Williams RL, Burke JE. Using hydrogen deuterium exchange mass spectrometry to engineer optimized constructs for crystallization of protein complexes: Case study of PI4KIIIβ with Rab11. Protein Science. 2016;25:826–839. doi: 10.1002/pro.2879. [DOI] [PMC free article] [PubMed] [Google Scholar]
- Gallagher ES, Hudgens JW. Mapping Protein–Ligand Interactions with Proteolytic Fragmentation. Hydrogen/Deuterium Exchange-Mass Spectrometry (Elsevier Inc.); 2016. [DOI] [PubMed] [Google Scholar]
- Hall BE, Yang SS, Boriack-Sjodin PA, Kuriyan J, Bar-Sagi D. Structure-based mutagenesis reveals distinct functions for Ras switch 1 and switch 2 in Sos-catalyzed guanine nucleotide exchange. J Biol Chem. 2001;276:27629–27637. doi: 10.1074/jbc.M101727200. [DOI] [PubMed] [Google Scholar]
- Hunter JC, Manandhar A, Carrasco MA, Gurbani D, Gondi S, Westover KD. Biochemical and Structural Analysis of Common Cancer-Associated KRAS Mutations. Molecular Cancer Research. 2015;13:1325–1335. doi: 10.1158/1541-7786.MCR-15-0203. [DOI] [PubMed] [Google Scholar]
- Ito Y, Ito Y, Yamasaki K, Kamiya A, Yamasaki K, Shirouzu M, Iwahara J, Iwahara J, Yokoyama S, Terada T, et al. Regional Polysterism in the GTP-Bound Form of the Human c-Ha-Ras Protein †,‡. Biochemistry. 1997;36:9109–9119. doi: 10.1021/bi970296u. [DOI] [PubMed] [Google Scholar]
- John J, Sohmen R, Feuerstein J, Linke R, Wittinghofer A, Goody RS. Kinetics of interaction of nucleotides with nucleotide-free H-ras p21. Biochemistry. 1990a;29:6058–6065. doi: 10.1021/bi00477a025. [DOI] [PubMed] [Google Scholar]
- John J, Sohmen R, Feuerstein J, Linke R, Wittinghofer A, Goody RS. Kinetics of interaction of nucleotides with nucleotide-free H-ras p21. Biochemistry. 1990b;29:6058–6065. doi: 10.1021/bi00477a025. [DOI] [PubMed] [Google Scholar]
- Johnson CW, Buhrman G, Ting PY, Colicelli J, Mattos C. Expression, purification, crystallization and X-ray data collection for RAS and its mutants. Data Brief. 2016;6:423–427. doi: 10.1016/j.dib.2015.12.007. [DOI] [PMC free article] [PubMed] [Google Scholar]
- Kalbitzer HR, Spoerner M, Ganser P, Hozsa C, Kremer W. Fundamental Link between Folding States and Functional States of Proteins. J Am Chem Soc. 2009;131:16714–16719. doi: 10.1021/ja904314q. [DOI] [PubMed] [Google Scholar]
- Kauke MJ, Traxlmayr MW, Parker JA, Kiefer JD, Knihtila R, McGee J, Verdine G, Mattos C, Wittrup KD. An engineered protein antagonist of K-Ras/B-Raf interaction. Scientific Reports. 2017;7:5831. doi: 10.1038/s41598-017-05889-7. [DOI] [PMC free article] [PubMed] [Google Scholar]
- Li J, Li C, Xiao W, Yuan D, Wan G, Ma L. Site-directed mutagenesis by combination of homologous recombination and DpnI digestion of the plasmid template in Escherichia coli. Analytical Biochemistry. 2008;373:389–391. doi: 10.1016/j.ab.2007.10.034. [DOI] [PubMed] [Google Scholar]
- Lim SM, Westover KD, Ficarro SB, Harrison RA, Choi HG, Pacold ME, Carrasco M, Hunter J, Kim ND, Xie T, et al. Therapeutic Targeting of Oncogenic K-Ras by a Covalent Catalytic Site Inhibitor. Angew Chem Int Ed. 2013;53:199–204. doi: 10.1002/anie.201307387. [DOI] [PMC free article] [PubMed] [Google Scholar]
- Lito P, Solomon M, Li L, Hansen R, Rosen N. Allele-specific inhibitors inactivate mutant KRAS G12C by a trapping mechanism. Science. 2016;351:604–608. doi: 10.1126/science.aad6204. [DOI] [PMC free article] [PubMed] [Google Scholar]
- Lu J, Harrison RA, Li L, Zeng M, Gondi S, Scott D, Gray NS, Engen JR, Westover KD. KRAS G12C Drug Development: Discrimination between Switch II Pocket Configurations Using Hydrogen/Deuterium-Exchange Mass Spectrometry. Structure. 2017 doi: 10.1016/j.str.2017.07.003. [DOI] [PMC free article] [PubMed] [Google Scholar]
- Matsumoto S, Miyano N, Baba S, Liao J, Kawamura T, Tsuda C, Takeda A, Yamamoto M, Kumasaka T, Kataoka T, et al. Molecular Mechanism for Conformational Dynamics of Ras·GTP Elucidated from In-Situ Structural Transition in Crystal. Scientific Reports. 2016;6:517. doi: 10.1038/srep25931. [DOI] [PMC free article] [PubMed] [Google Scholar]
- Maurer T, Maurer T, Garrenton LS, Garrenton LS, Oh A, Oh A, Pitts K, Pitts K, Anderson DJ, Anderson DJ, et al. Small-molecule ligands bind to a distinct pocket in Ras and inhibit SOS-mediated nucleotide exchange activity. Proc Natl Acad Sci USA. 2012;109:5299–5304. doi: 10.1073/pnas.1116510109. [DOI] [PMC free article] [PubMed] [Google Scholar]
- McCormick F. K-Ras protein as a drug target. J Mol Med. 2016:1–6. doi: 10.1007/s00109-016-1382-7. [DOI] [PMC free article] [PubMed] [Google Scholar]
- McGregor LM, Jenkins ML, Kerwin C, Burke JE, Shokat KM. Expanding the Scope of Electrophiles Capable of Targeting K-Ras Oncogenes. Biochemistry. 2017;56:3178–3183. doi: 10.1021/acs.biochem.7b00271. [DOI] [PMC free article] [PubMed] [Google Scholar]
- Milburn MV, Tong L, deVos AM, Brünger A, Yamaizumi Z, Nishimura S, Kim SH. Molecular switch for signal transduction: structural differences between active and inactive forms of protooncogenic ras proteins. Science. 1990;247:939–945. doi: 10.1126/science.2406906. [DOI] [PubMed] [Google Scholar]
- Moriarty NW, Grosse-Kunstleve RW, Adams PD. Electronic Ligand Builder and Optimization Workbench (eLBOW): a tool for ligand coordinate and restraint generation. Acta Crystallographica Section D Biological Crystallography. 2009;65:1074–1080. doi: 10.1107/S0907444909029436. [DOI] [PMC free article] [PubMed] [Google Scholar]
- Muraoka S, Shima F, Araki M, Inoue T, Yoshimoto A, Ijiri Y, Seki N, Tamura A, Kumasaka T, Yamamoto M, et al. Crystal structures of the state 1 conformations of the GTP-bound H-Ras protein and its oncogenic G12V and Q61L mutants. FEBS Letters. 2012;586:1715–1718. doi: 10.1016/j.febslet.2012.04.058. [DOI] [PubMed] [Google Scholar]
- Ostrem JML, Shokat KM. Direct small-molecule inhibitors of KRAS: from structural insights to mechanism-based design. Nature Publishing Group. 2016;15:771–785. doi: 10.1038/nrd.2016.139. [DOI] [PubMed] [Google Scholar]
- Ostrem JM, Peters U, Sos ML, Wells JA, Shokat KM. K-Ras(G12C) inhibitors allosterically control GTP affinity and effector interactions. Nature. 2013;503:548–551. doi: 10.1038/nature12796. [DOI] [PMC free article] [PubMed] [Google Scholar]
- Pacold ME, Suire S, Perisic O, Lara-Gonzalez S, Davis CT, Walker EH, Hawkins PT, Stephens L, Eccleston JF, Williams RL. Crystal structure and functional analysis of Ras binding to its effector phosphoinositide 3-kinase gamma. Cell. 2000;103:931–943. doi: 10.1016/s0092-8674(00)00196-3. [DOI] [PubMed] [Google Scholar]
- Painter J, Merritt EA, IUCr TLSMD web server for the generation of multi-group TLS models. Journal of Applied Crystallography. 2006;39:109–111. [Google Scholar]
- Patgiri A, Yadav KK, Arora PS, Bar-Sagi D. An orthosteric inhibitor of the Ras-Sos interaction. Nat Chem Biol. 2011;7:585–587. doi: 10.1038/nchembio.612. [DOI] [PMC free article] [PubMed] [Google Scholar]
- Patricelli MP, Janes MR, Li LS, Hansen R, Peters U, Kessler LV, Chen Y, Kucharski JM, Feng J, Ely T, et al. Selective Inhibition of Oncogenic KRAS Output with Small Molecules Targeting the Inactive State. Cancer Discovery. 2016;6:316–329. doi: 10.1158/2159-8290.CD-15-1105. [DOI] [PubMed] [Google Scholar]
- Shima F, Shima F, Yoshikawa Y, Yoshikawa Y, Ye M, Ye M, Araki M, Araki M, Matsumoto S, Matsumoto S, et al. In silico discovery of small-molecule Ras inhibitors that display antitumor activity by blocking the Ras-effector interaction. Proc Natl Acad Sci USA. 2013;110:8182–8187. doi: 10.1073/pnas.1217730110. [DOI] [PMC free article] [PubMed] [Google Scholar]
- Siempelkamp BD, Rathinaswamy MK, Jenkins ML, Burke JE. Molecular mechanism of activation of class IA phosphoinositide 3-kinases (PI3Ks) by membrane-localized HRas. J Biol Chem. 2017;292:12256–12266. doi: 10.1074/jbc.M117.789263. [DOI] [PMC free article] [PubMed] [Google Scholar]
- Sondermann H, Soisson SM, Boykevisch S, Yang SS, Bar-Sagi D, Kuriyan J. Structural analysis of autoinhibition in the Ras activator Son of sevenless. Cell. 2004;119:393–405. doi: 10.1016/j.cell.2004.10.005. [DOI] [PubMed] [Google Scholar]
- Spencer-Smith R, Koide A, Zhou Y, Eguchi RR, Sha F, Gajwani P, Santana D, Gupta A, Jacobs M, Herrero-Garcia E, et al. Inhibition of RAS function through targeting an allosteric regulatory site. Nat Chem Biol. 2017;13:62–68. doi: 10.1038/nchembio.2231. [DOI] [PMC free article] [PubMed] [Google Scholar]
- Spoerner M, Herrmann C, Vetter IR, Kalbitzer HR, Wittinghofer A. Dynamic properties of the Ras switch I region and its importance for binding to effectors. Proc Natl Acad Sci USA. 2001;98:4944–4949. doi: 10.1073/pnas.081441398. [DOI] [PMC free article] [PubMed] [Google Scholar]
- Spoerner M, Wittinghofer A, Kalbitzer HR. Perturbation of the conformational equilibria in Ras by selective mutations as studied by 31P NMR spectroscopy. FEBS Letters. 2004;578:305–310. doi: 10.1016/j.febslet.2004.11.020. [DOI] [PubMed] [Google Scholar]
- Stephen AG, Esposito D, Bagni RK, McCormick F. Dragging Ras Back in the Ring. Cancer Cell. 2014;25:272–281. doi: 10.1016/j.ccr.2014.02.017. [DOI] [PubMed] [Google Scholar]
- Sun Q, Burke JP, Phan J, Burns MC, Olejniczak ET, Waterson AG, Lee T, Rossanese OW, Fesik SW. Discovery of Small Molecules that Bind to K-Ras and Inhibit Sos-Mediated Activation. Angew Chem. 2012;124:6244–6247. doi: 10.1002/anie.201201358. [DOI] [PMC free article] [PubMed] [Google Scholar]
- Thapar R, Williams JG, Campbell SL. NMR Characterization of Full-length Farnesylated and Non-farnesylated H-Ras and its Implications for Raf Activation. Journal of Molecular Biology. 2004;343:1391–1408. doi: 10.1016/j.jmb.2004.08.106. [DOI] [PubMed] [Google Scholar]
- Vadas O, Burke JE. Probing the dynamic regulation of peripheral membrane proteins using hydrogen deuterium exchange-MS (HDX-MS) Biochm Soc Trans. 2015;43:773–786. doi: 10.1042/BST20150065. [DOI] [PubMed] [Google Scholar]
- Vigil D, Cherfils J, Rossman KL, Der CJ. Ras superfamily GEFs and GAPs: validated and tractable targets for cancer therapy? Nat Rev Cancer. 2010;10:842–857. doi: 10.1038/nrc2960. [DOI] [PMC free article] [PubMed] [Google Scholar]
- Welsch ME, Kaplan A, Chambers JM, Stokes ME, Bos PH, Zask A, Zhang Y, Sanchez-Martin M, Badgley MA, Huang CS, et al. Multivalent Small-Molecule Pan-RAS Inhibitors. Cell. 2017;168:878–889.e29. doi: 10.1016/j.cell.2017.02.006. [DOI] [PMC free article] [PubMed] [Google Scholar]
- Yang W, Fucini RV, Fahr BT, Lam MB, Lu Y, Randal M, Lind KE, Cary DR, Colussi D, Lu W, et al. Fragment-Based Discovery of Nonpeptidic BACE-1 Inhibitors Using Tethering. Biochemistry. 2009;48:4488–4496. doi: 10.1021/bi900017q. [DOI] [PubMed] [Google Scholar]
- Zhao Q, Ouyang X, Wan X, Gajiwala KS, Kath JC, Jones LH, Burlingame AL, Taunton J. Broad-Spectrum Kinase Profiling in Live Cells with Lysine-Targeted Sulfonyl Fluoride Probes. J Am Chem Soc. 2017;139:680–685. doi: 10.1021/jacs.6b08536. [DOI] [PMC free article] [PubMed] [Google Scholar]
- Adams PD, Afonine PV, Bunkóczi G, Chen VB, Echols N, Headd JJ, et al. The Phenix software for automated determination of macromolecular structures. Methods. 2011;55(1):94–106. doi: 10.1016/j.ymeth.2011.07.005. http://doi.org/10.1016/j.ymeth.2011.07.005. [DOI] [PMC free article] [PubMed] [Google Scholar]
- Ahmadian MR, Zor T, Vogt D, Kabsch W, Selinger Z, Wittinghofer A, Scheffzek K. Guanosine triphosphatase stimulation of oncogenic Ras mutants. Proceedings of the National Academy of Sciences. 1999;96(12):7065–7070. doi: 10.1073/pnas.96.12.7065. [DOI] [PMC free article] [PubMed] [Google Scholar]
- Battye TGG, Kontogiannis L, Johnson O, Powell HR, Leslie AGW, IUCr iMOSFLM: a new graphical interface for diffraction-image processing with MOSFLM. Acta Crystallographica Section D Biological Crystallography. 2011;67(4):271–281. doi: 10.1107/S0907444910048675. http://doi.org/10.1107/S0907444910048675. [DOI] [PMC free article] [PubMed] [Google Scholar]
- Collaborative Computational Project, N. 4. The CCP4 suite: programs for protein crystallography. Acta Crystallographica Section D Biological Crystallography. 1994;50(Pt 5):760–763. doi: 10.1107/S0907444994003112. http://doi.org/10.1107/S0907444994003112. [DOI] [PubMed] [Google Scholar]
- Evans PR, Murshudov GN, IUCr How good are my data and what is the resolution? Acta Crystallographica Section D Biological Crystallography. 2013;69(7):1204–1214. doi: 10.1107/S0907444913000061. http://doi.org/10.1107/S0907444913000061. [DOI] [PMC free article] [PubMed] [Google Scholar]
- Evans P, IUCr Scaling and assessment of data quality. Acta Crystallographica Section D Biological Crystallography. 2006;62(1):72–82. doi: 10.1107/S0907444905036693. http://doi.org/10.1107/S0907444905036693. [DOI] [PubMed] [Google Scholar]
- Fowler ML, McPhail JA, Jenkins ML, Masson GR, Rutaganira FU, Shokat KM, et al. Using hydrogen deuterium exchange mass spectrometry to engineer optimized constructs for crystallization of protein complexes: Case study of PI4KIIIβ with Rab11. Protein Science. 2016;25(4):826–839. doi: 10.1002/pro.2879. http://doi.org/10.1002/pro.2879. [DOI] [PMC free article] [PubMed] [Google Scholar]
- John J, Sohmen R, Feuerstein J, Linke R, Wittinghofer A, Goody RS. Kinetics of interaction of nucleotides with nucleotide-free H-ras p21. Biochemistry. 1990;29(25):6058–6065. doi: 10.1021/bi00477a025. [DOI] [PubMed] [Google Scholar]
- Li J, Li C, Xiao W, Yuan D, Wan G, Ma L. Site-directed mutagenesis by combination of homologous recombination and DpnI digestion of the plasmid template in Escherichia coli. Analytical Biochemistry. 2008;373(2):389–391. doi: 10.1016/j.ab.2007.10.034. http://doi.org/10.1016/j.ab.2007.10.034. [DOI] [PubMed] [Google Scholar]
- Maurer T, Maurer T, Garrenton LS, Garrenton LS, Oh A, Oh A, et al. Small-molecule ligands bind to a distinct pocket in Ras and inhibit SOS-mediated nucleotide exchange activity. Proceedings of the National Academy of Sciences. 2012;109(14):5299–5304. doi: 10.1073/pnas.1116510109. http://doi.org/10.1073/pnas.1116510109. [DOI] [PMC free article] [PubMed] [Google Scholar]
- Moriarty NW, Grosse-Kunstleve RW, Adams PD. electronic Ligand Builder and Optimization Workbench (eLBOW): a tool for ligand coordinate and restraint generation. Acta Crystallographica Section D Biological Crystallography. 2009;65(Pt 10):1074–1080. doi: 10.1107/S0907444909029436. http://doi.org/10.1107/S0907444909029436. [DOI] [PMC free article] [PubMed] [Google Scholar]
- Painter J, Merritt EA, IUCr TLSMD web server for the generation of multi-group TLS models. Journal of Applied Crystallography. 2006;39(1):109–111. http://doi.org/10.1107/S0021889805038987. [Google Scholar]
- Siempelkamp BD, Rathinaswamy MK, Jenkins ML, Burke JE. Molecular mechanism of activation of class IA phosphoinositide 3-kinases (PI3Ks) by membrane-localized HRas. Journal of Biological Chemistry. 2017;292(29):12256–12266. doi: 10.1074/jbc.M117.789263. http://doi.org/10.1074/jbc.M117.789263. [DOI] [PMC free article] [PubMed] [Google Scholar]
- Sondermann H, Soisson SM, Boykevisch S, Yang SS, Bar-Sagi D, Kuriyan J. Structural analysis of autoinhibition in the Ras activator Son of sevenless. Cell. 2004;119(3):393–405. doi: 10.1016/j.cell.2004.10.005. http://doi.org/10.1016/j.cell.2004.10.005. [DOI] [PubMed] [Google Scholar]
Associated Data
This section collects any data citations, data availability statements, or supplementary materials included in this article.