To the editor
A number of recent studies have documented the frequency and prognostic importance of recurrent mutations in acute myeloid leukemia (AML).1,2 However, other studies have demonstrated that AML risk classification using genetic and clinical data incompletely predicts outcome after induction chemotherapy, and additional prognostic tools are still needed for accurate risk stratification.3 We have developed both a clinical assay to assess multi-locus DNA methylation (xMELP), and a companion random forest classification system (M-score) for AML patient prognosis.4,5 We recently demonstrated that M-score predicts outcomes in a cohort of 166 adult patients with AML treated at the University of Pennsylvania (UPENN), and in an independent cohort of 383 patients treated within the Eastern Cooperative Oncology Group (ECOG) E1900 AML study.6 These results suggest that the rapid and technically straightforward evaluation of DNA methylation by M-score analysis could be a valuable prognostic test for AML patients at diagnosis. We now validate xMELP and M-score in an independent cohort of patients with AML treated at the University of Texas MD Anderson Cancer Center (UTMDACC), and include an analysis of patients with acute promyelocytic leukemia (APL) and secondary AML who have not been previously studied.
Genomic DNA was isolated from diagnostic blood or marrow samples collected at UTMDACC from 149 consecutive AML patients (2001–2013) who consented to donation of a sample to the UTMDACC Leukemia Tissue Bank, had adequate DNA quality, and had response and vital status information available (Supplemental Table I). All patients signed informed consent following institutional guidelines and in accordance with the Declaration of Helsinki. Patients received induction chemotherapy with high-dose cytarabine containing regimens (n=132) or all trans retinoic acid (ATRA) and arsenic trioxide (ATO) for acute promyelocytic leukemia (APL) (n=17) (Supplemental Table II). The xMELP assay was performed on each sample and M-score was determined as previously described.4,5 Standard molecular (FLT3-ITD and NPM1) and cytogenetic annotation was performed as per clinical care. Cytogenetic risk was classified according to Medical Research Council criteria.
In this cohort, 81% of patients achieved CR following induction and 57% were alive at 2 years (Supplemental Table II). Median follow-up was 29.2 months (range 0.1–112.2 months). Mean and median M-score for the cohort were 91.8 (95% confidence interval [CI], 86.1 to 97.5) and 88.7 (range, 26.7 to 183.9), respectively, similar to the UPENN and ECOG cohorts. Consistent with previous results, mean M-score was lower in patients with core binding factor (CBF) favorable-risk leukemia (58.2, 95% CI 50.9 to 65.6) compared to patients with intermediate and adverse cytogenetics (100.1, 95% CI 92.4 to 107.9 and 118.7, 95% CI 107.3 to 130.0, respectively; P<0.00001), and was not associated with sex, presenting WBC, or FLT3-ITD/NPM1 mutation profile (Supplemental Table I). Mean M-score for patients with APL was also lower than patients with intermediate or unfavorable risk cytogenetics at 82.3 (95% CI, 69.9 to 94.7), although not as low as the CBF subgroup. Notably, mean M-score was higher in patients >60 years compared to younger patients (106.7, 95% CI, 96.0 to 117.4 vs 85.4, 95% CI 78.9 vs 91.8, Supplemental Table I), and in patients with secondary AML compared to those with de novo AML (104.9, 95% CI, 91.7 to 118.2 vs 87.6, 95% CI, 81.5 to 93.8, P=0.01).
We found that mean M-score for patients surviving at 2 years was significantly lower than for deceased patients (80.1; 95% CI, 72.6 to 87.7 vs. 109.2; 95% CI 101.8 to 116.6, P<0.00001) and patients achieving CR had a lower mean M-score compared to those with primary refractory disease (85.3; 95% CI, 79.2 to 91.4 vs. 118.7; 95% CI, 108.4 to 129.1, P<0.00001). A univariate Cox survival analysis demonstrated that a 10-unit increase in M-score was associated with a 10% increase in the hazard of death (HR 1.1; 95% CI, 1.1 to 1.2; P<0.0001, Supplemental Table III) and a 40% increase in the odds of failing to achieve CR (OR 1.4; 95% CI, 1.2 to 1.6; P<0.0001). These associations are more robust than observed with the original cohorts.
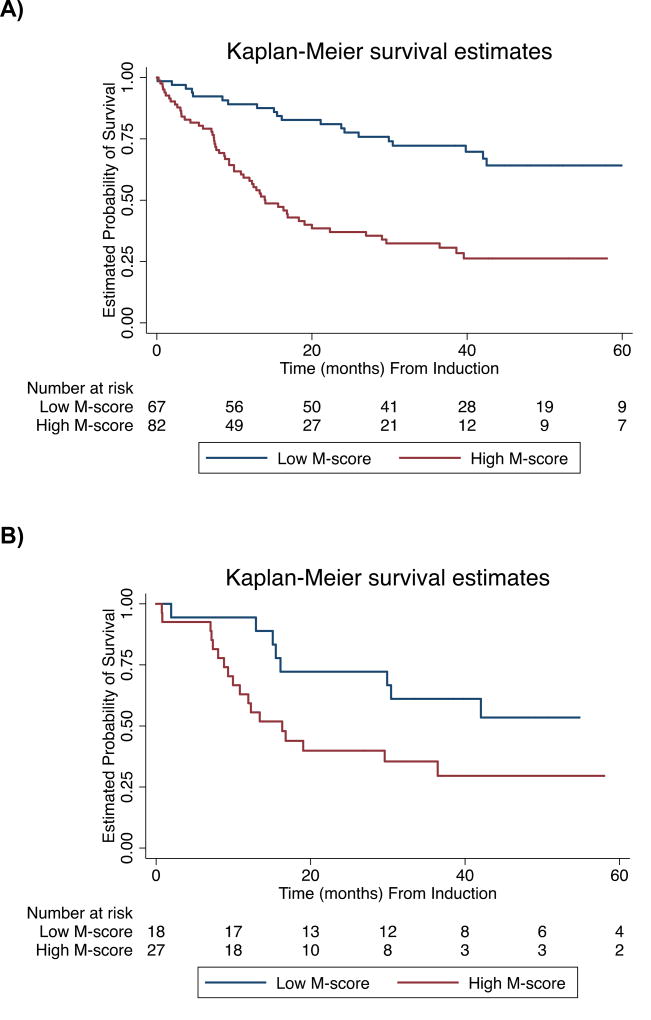
We segregated the AML cohort into subgroups based on a previously defined binary M-score cut-point (M-score=86) and found a significant difference in survival for low and high M-score groups determined by this classifier (log-rank P<0.00001). High M-score was associated with an increased hazard of death (HR 2.8; 95% CI, 1.7 to 4.5, P<0.0001, Supplemental Table III) with 2-year OS of 80% (95% CI, 70 to 90%) compared to 39% (95% CI, 28 to 50%) for low and high M-score groups, respectively (Supplemental Table IV). CR rates for low and high M-score groups were 97% (95% CI, 93 to 100%) and 67% (95% CI, 57 to 77%), respectively.
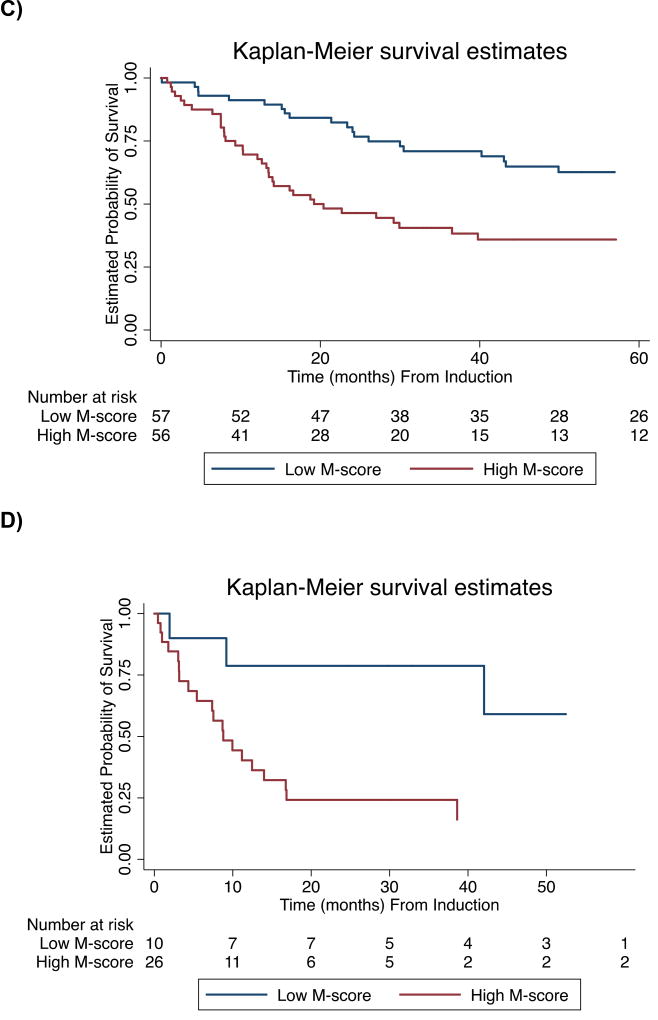
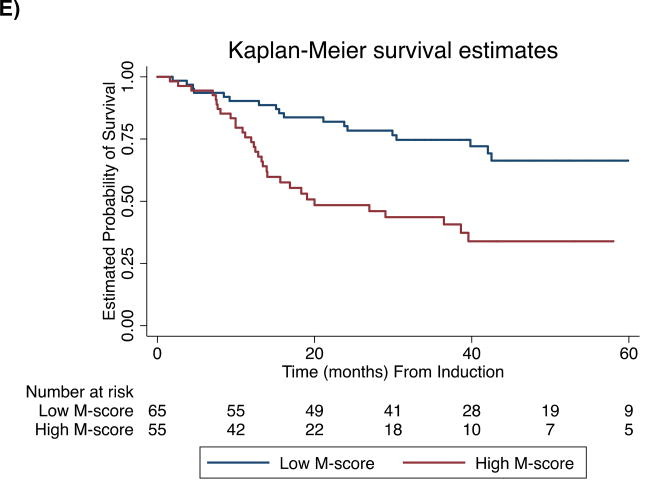
Subgroup analysis showed that for both de novo AML (n=113) and secondary AML (n=36), the M-score classifier significantly distinguishes prognostic categories (log-rank P=0.001 and P=0.02, respectively). Additionally, the M-score classifier is prognostic for OS in younger patients with intermediate cytogenetics (n=45, log-rank P=0.04) and for patients who achieve CR (n=120, log-rank P=0.004).
We performed multivariable analysis of M-score and “standard” clinicopathologic prognostic factors (age, diagnostic WBC, cytogenetics, de novo versus secondary, and FLT3-ITD status). Since the UTMDACC cohort had a relatively large number of patients with APL or CBF AML with favorable OS, we restricted the analysis to younger (age <60) patients with intermediate or unfavorable risk leukemia. In this prognostically diverse subgroup, the M-score is marginally associated with OS on multivariable analysis (P=0.054, Supplemental Table V).
We have previously demonstrated that multi-locus methylation assessment can be used to determine AML prognosis at diagnosis, and that it has several characteristics advantageous to clinical implementation including universal applicability, rapid turn-around, and ease of interpretation. The reproducibility of the xMELP assay and M-score for prognosis in this separate cohort of patients treated with intensified induction therapy strategies confirms the broad applicability of this assay. A novel finding in this study is that M-score can identify a subgroup of patients with secondary AML who experience a 2-yr OS >75% (Supplemental Table IV). An important finding confirmed by this study is that M-score retains prognostic significance in AML patients achieving CR with induction chemotherapy, suggesting value for guiding individualization of post-remission therapy in responding patients. Patients with high M-scores could be considered for referral for stem cell transplantation or investigational approaches for maintaining remission. Further prospective studies that incorporate M-score into current prognostic schemes are warranted, as well as studies to compare value to technically-difficult flow-based minimal-residual disease assays. Extending this analysis to a larger number of patients is of great interest as these results would have immediate implications for prognostication and design of therapeutic regimens.
Supplementary Material
Figure.
Kaplan-Meier Curves of Overall Survival. Subgroups determined by optimal M-score. Curves for A) Total cohort (n=149, log-rank P<0.00001), B) Younger patients (≤ 60 years) with intermediate cytogenetics (n=45, log-rank P=0.04), C) Patients with de novo AML (n=113, log-rank P=0.001), D) Secondary AML (n=36, log-rank P=0.02) E) Achieved CR (n=120, log-rank P=0.0002)
Acknowledgments
Funding: The University of Texas MD Anderson Cancer Center is supported in part by the National Institutes of Health through Cancer Center Support NIH/NCI Cancer Center Support Grant P30 CA16672.
References
- 1.Papaemmanuil E, Gerstung M, Bullinger L, et al. Genomic classification and prognosis in acute myeloid leukemia. N Eng J Med. 2016;374:2209–2221. doi: 10.1056/NEJMoa1516192. [DOI] [PMC free article] [PubMed] [Google Scholar]
- 2.Metzeler KH, Herold T, Rothenberg-Thurley M, et al. Spectrum and prognostic relevance of driver gene mutations in acute myeloid leukemia. Blood. 2016;128:686–698. doi: 10.1182/blood-2016-01-693879. [DOI] [PubMed] [Google Scholar]
- 3.Walter RB, Othus M, Paietta EM, et al. Effect of genetic profiling on prediction of therapeutic resistance and survival in adult acute myeloid leukemia. Leukemia. 2015;29:2104–2107. doi: 10.1038/leu.2015.76. [DOI] [PMC free article] [PubMed] [Google Scholar]
- 4.Wertheim GB, Smith C, Figueroa ME, et al. Microsphere-based multiplex analysis of DNA methylation in acute myeloid leukemia. J Mol Diagn. 2014;16:207–215. doi: 10.1016/j.jmoldx.2013.10.010. [DOI] [PMC free article] [PubMed] [Google Scholar]
- 5.Wertheim GB, Smith C, Luskin M, et al. Validation of DNA methylation to predict outcome in acute myeloid leukemia by use of xMELP. Clinical Chem. 2015;1:249–258. doi: 10.1373/clinchem.2014.229781. [DOI] [PMC free article] [PubMed] [Google Scholar]
- 6.Luskin MR, Gimotty PA, Smith C, et al. A clinical measure of DNA methylation predicts outcome in de novo acute myeloid leukemia. JCI Insight. 2016;1:e87323. doi: 10.1172/jci.insight.87323. [DOI] [PMC free article] [PubMed] [Google Scholar]
Associated Data
This section collects any data citations, data availability statements, or supplementary materials included in this article.


