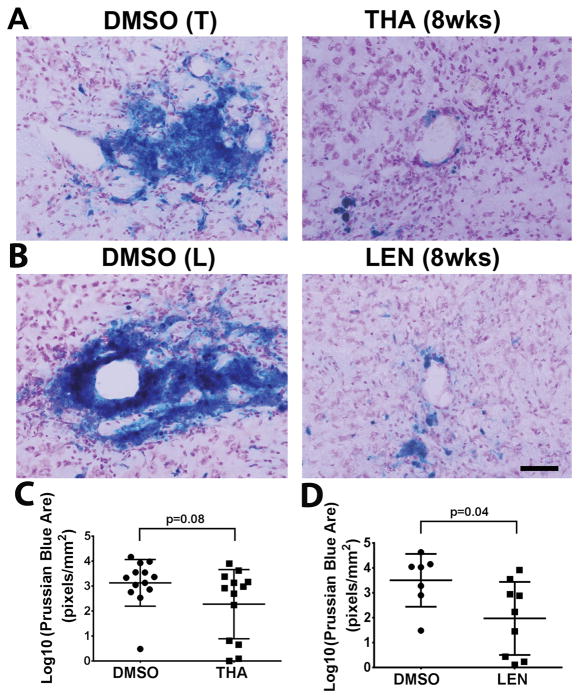
Figure 3. Thalidomide and lenalidomide reduces hemorrhage in the established bAVM.
A & B. Representative images of Prussian blue stained sections. Scale bar: 100 μm. C & D. Quantification of Prussian blue-positive area. Log 10: the data were 10 log conversed. THA (8wks): mice received thalidomide treatment starting 8 weeks after model induction. LEN (8wks): mice received lenalidomide treatment starting 8 weeks after model induction. DMSO (T): control for thalidomide treated-group; DMSO (L): control for lenalidomide treated-group. N=13 for thalidomide group and its DMSO control. N=9 for lenalidomide group and N=7 for its DMSO control. P values were determined by t-test analysis.

